모든 글
약 20분 분량 학습 프로젝트/토이 DB

DB 내부 ⑧: 병렬 실행: latch를 계층별로 걷어내고, 자로 재고, 병목을 고치기

목차

0. 들어가며: 논리적 동시성과 물리적 동시성은 다르다

4편의 MVCC로 “reader가 writer를 안 막는다”를 얻었고, 5편의 서버는 커넥션마다 스레드를 줬습니다. 그런데 정직하게 말하면, 실행 자체는 전역 엔진 latch 하나로 직렬화돼 있었습니다. MVCC는 논리적 동시성(가시성으로 안 막힘)이지, 물리적 동시성(두 쿼리가 정말 동시에 도는 것)이 아닙니다. 12코어 머신이 1코어처럼 돕니다.

이 편은 그 굵은 latch를 계층별로 걷어내는 여정입니다. 그리고 이 여정의 규율이 하나 있습니다. 매 단계를 ThreadSanitizer로 계측하고(동시성 코드에서 “테스트 통과”는 약한 증거니까, 1편 6절), 마지막엔 자로 재서 다음 병목을 찾습니다. 스포일러: 콜드 캐시의 천장은 공유 latch였고(§5~6의 A/B로 확증), 워밍 체제의 천장은 후보가 셋입니다: 스레드 생성 오버헤드와 latch(정황 증거), 메모리 대역폭(가설). 재보니 고칠 곳이 정확히 보였습니다.

lock vs latch: 트랜잭션 lock은 행·테이블 같은 논리적 객체를 트랜잭션 기간 내내 보호하고 deadlock 감지가 붙습니다. latch는 메모리 자료구조의 임계구역을 마이크로초 단위로 보호하는 물리적 뮤텍스고, deadlock 감지가 없습니다(Graefe 2010의 구분). 이 편에서 걷어내는 건 전부 후자입니다. 4편의 MVCC가 다루던 논리적 동시성과는 층이 다릅니다.

1. B+Tree latch crabbing: 트리를 동시에 타기

첫 계층은 인덱스입니다. 트리 전체에 락 하나를 걸면 모든 조회가 직렬화되니, 노드(페이지)마다 rwlock을 두고 “게처럼(crab)” 잡았다 놓으며 내려갑니다.

  • 탐색(읽기 crabbing): 자식을 잡고 → 부모를 놓는다. 한 시점에 최대 두 노드만 쥡니다. 여러 reader가 트리의 다른 가지를 동시에 탈 수 있습니다.
  • 삽입(쓰기 crabbing): 내려가며 조상들의 쓰기 락을 쥐되, 자식이 “안전”하면(분할 안 일어날 만큼 여유가 있으면) 쥐고 있던 조상을 전부 놓습니다. 분할이 위로 전파될 수 있는 경로만 잠그는 겁니다.
  • 루트 분할: 루트 자체가 바뀌는 순간이 까다로운데, 루트를 가리키는 가짜 부모(header) 노드를 두면 “루트도 어떤 노드의 자식”이 돼서 같은 crabbing 규칙으로 처리됩니다.

동시 삽입(분할 폭풍) + 읽기/쓰기 혼합 스트레스를 TSan으로 돌려 data race 0. 물론 TSan의 “0”은 관측된 인터리빙 기준이지 race 부재의 증명은 아닙니다. 이게 Graefe(2010)가 정리한 교과서 기법입니다. 실제 시스템은 여기서 각자 변형을 골랐습니다. InnoDB는 인덱스 전체 rw-latch(S/SX/X)에 낙관적 하강을 섞은 변형을 쓰고, PostgreSQL nbtree는 Lehman-Yao B-link(우측 형제 포인터 + high key)로 하강 중 coupling 자체를 회피합니다. (정직한 경계: 독립 모듈로 증명했다. 엔진의 디스크 B+Tree에 배선하는 건 굵은 latch를 걷어낼 때의 몫이다.)

2. 병렬 풀 스캔: 버퍼 풀 latch가 발판이다

다음 계층은 스캔입니다. read-only 풀 스캔은 유별나게 병렬화하기 쉽습니다:

  1. 자명하게 분할된다: 페이지 [0, N)을 워커별 연속 블록으로 나누면 끝.
  2. 공유 가변 상태가 없다: 읽기만 하니까. 스냅샷·스키마·WHERE는 불변.
  3. 밑바닥이 이미 스레드 안전하다: 1편의 버퍼 풀 latch + pin 프로토콜.

세 번째가 핵심 근거입니다. 버퍼 풀의 fetch/unpin이 latch 아래에서 pin_count를 관리하고 eviction이 pin된 프레임을 배제하므로, read-only 워커 N개가 같은 풀에서 동시에 페이지를 fetch/unpin해도 안전합니다. PostgreSQL이 병렬 쿼리를 parallel sequential scan부터 시작한 것과 같은 이유입니다.

구현의 요체는 락을 아예 없애는 설계입니다. 각 워커는 자기만의 지역 결과에 매칭 RID를 모으고(공유 쓰기 없음), leader가 워커 순서(=페이지 순서)로 병합합니다. 1~16 워커 모두 직렬 스캔과 RID 집합·순서까지 동일, TSan 클린.

3. 실제 SELECT에 배선: 워커는 판정, leader는 출력

독립 증명을 실행기에 꽂을 차례. 직렬 풀스캔이 행마다 하는 일은 넷입니다: ① 가시성 게이트, ② 행 디코드, ③ WHERE 평가, ④ 출력. ①②③은 읽기 전용이라 병렬로 안전하지만, ④는 공유 FILE*에 쓰니 동시에 하면 안 됩니다. 그래서 역할을 가릅니다:

워커(병렬): ①②③을 술어로 묶어 매칭 RID만 모은다. 뜨거운 CPU 작업. leader(직렬): 모은 RID를 페이지 순서로 받아 ④ 출력만 한다. → 결과가 직렬과 바이트 단위로 동일.

함정이 하나 있습니다. 서브쿼리를 품은 WHERE는 술어가 실행기를 재진입하므로(실행기는 스레드 안전이 아님) 병렬 불가. 그래서 게이트를 둡니다: 큰 테이블 + 서브쿼리 없는 WHERE만 병렬, 아니면 직렬 폴백. 자격 미달이 조용히 정확한 경로로 떨어지니 기존 테스트 전체가 무회귀입니다.

실제 PostgreSQL의 게이트는 훨씬 정교합니다. 워커 수는 max_parallel_workers_per_gather가 상한을 긋는데 기본값이 2입니다. 뒤의 §5에서 내 실측 정점이 2~4워커로 나오는 걸 보면, 이 보수적 기본값이 왜 그 값인지가 실감 납니다. 테이블이 min_parallel_table_scan_size(기본 8MB)보다 작으면 병렬을 고려조차 안 하고, 크기가 3배 늘 때마다 워커를 하나씩 더 붙이는 로그 스케일입니다. 함수마다 PARALLEL SAFE/RESTRICTED/UNSAFE 표시가 있어 UNSAFE가 끼면 직렬로 폴백합니다. 그리고 PG 문서가 명시하는 병렬 배제 조건은 *“the query writes any data or locks any database rows”*입니다. 쓰기 쿼리는 병렬 계획에서 아예 빠집니다. 내 “큰 테이블 + 서브쿼리 없는 WHERE” 게이트는 이 체계의 스케치인 셈입니다.

병렬 실행의 골격 자체도 시스템마다 다릅니다:

시스템병렬 단위기본 동작
PostgreSQL프로세스 워커 + Gather 노드, 공유 메모리 tuple queuemax_parallel_workers_per_gather 기본 2
MySQL8.0 기준 병렬 쿼리 실행이 사실상 없음. InnoDB 병렬 스캔은 CHECK TABLE·클러스터드 인덱스 count 계열 등 극히 제한적
SQL Server스레드MAXDOP + cost threshold for parallelism
db-hobby스레드페이지 범위 분할, 큰 테이블 + 서브쿼리 없는 WHERE만

“MySQL은 병렬 쿼리가 사실상 없다”는 면접 단골이기도 합니다.

실무 안티패턴: OLTP 서버에서 max_parallel_workers_per_gather를 무작정 올리는 것. sub-ms 쿼리는 워커를 띄우고 거두는 셋업 비용이 지배해 병렬이 오히려 손해고(§5에서 실측으로 확인합니다), 커넥션마다 워커를 몇 개씩 쓰면 워커끼리 CPU를 경합합니다. 병렬 쿼리는 소수의 큰 분석 쿼리를 위한 도구입니다.
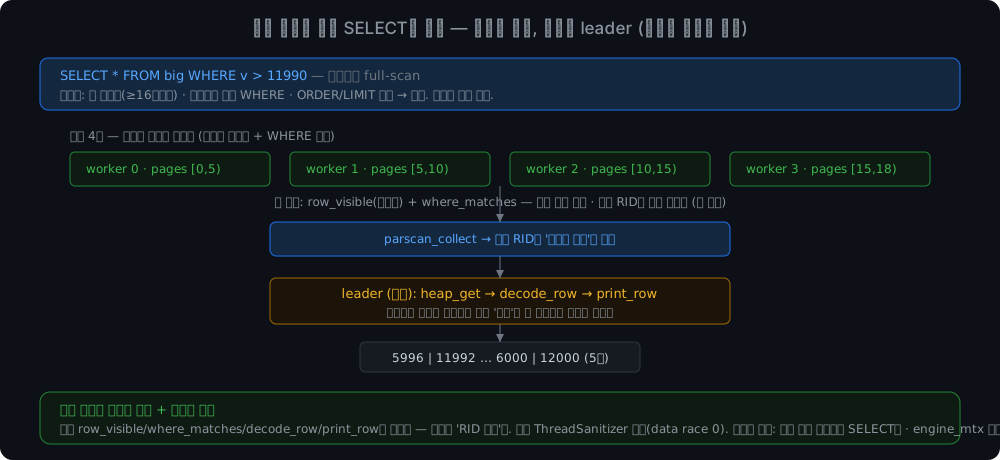
병렬 SELECT: 워커가 가시성+WHERE를 병렬 판정해 RID 수집, leader가 페이지 순서로 직렬 출력(직렬과 바이트 동일)

4. 병렬 집계: 그리고 조용히 틀리던 버그

집계를 병렬화하려고 그 경로를 들여다보다 진짜 버그를 발견했습니다. 직렬 집계는 행을 고정 버퍼(4096행)까지만 모은 뒤 계산했습니다. 6000행 테이블에 SELECT COUNT(*)를 하면 4096이 나옵니다. 에러 없이, 조용히 틀린 답. 병렬화가 이 버그를 함께 고칩니다. 워커가 매칭 행을 상한 없이 모아 기존 집계 코드에 넘기니, cap이 사라지며 정답이 나옵니다.

교훈: 성능 작업이 correctness 버그를 발굴하는 일은 흔하다. “빠르게 만들려고 읽는 코드”는 “믿고 지나치던 코드”이기 때문. 검증은 직렬과의 비교가 아니라(직렬이 틀렸으니까) 수학적 정답(oracle) 과의 대조로 한다. SUM(1..n) = n(n+1)/2.

여기서 한 발 더 나아갑니다. 행을 모을 필요조차 없습니다. SUM을 구하는 데 행을 쌓을 이유가 없습니다. 진짜 부분 집계: 워커가 자기 페이지 범위를 훑으며 항목별 누산기({count, sum, min, max})만 갱신하고, leader가 부분합을 결합합니다(COUNT=Σcnt, MIN=min의 min, AVG=Σsum/Σcnt). PostgreSQL의 Partial Aggregate → Finalize Aggregate와 같은 2단계 구조입니다. 단, PG는 스레드가 아니라 프로세스 워커를 Gather 노드 아래 두고 공유 메모리 tuple queue로 결과를 모읍니다. 메모리가 O(매칭 행수)에서 O(워커수 × 항목수) 로 떨어집니다. NULL 처리가 미묘한 지점입니다. COUNT(*)는 NULL 포함 전체를, COUNT(col)/SUM은 NULL을 건너뛰므로 누산기에 total과 cnt를 따로 둡니다.
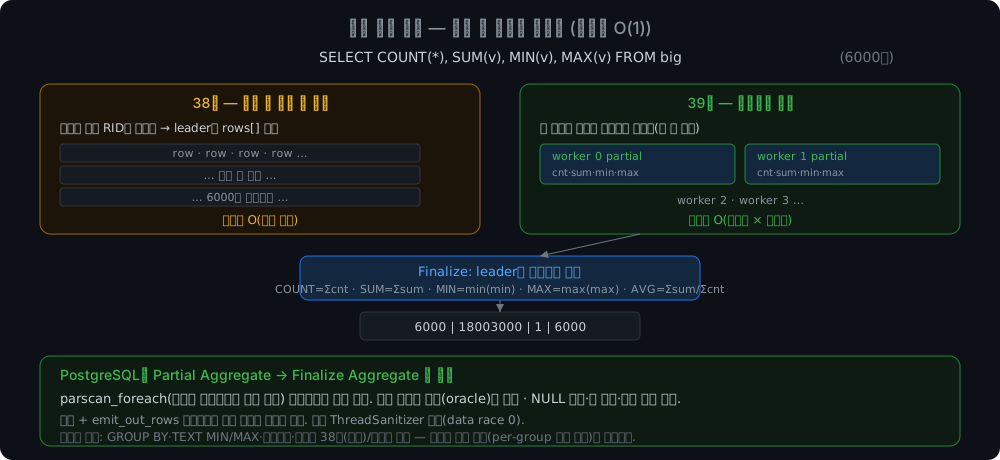
부분 집계: 워커는 부분합만 누적(행 안 모음), leader가 Finalize. 메모리 O(1)

5. 자로 재다: 천장은 CPU가 아니라 공유 latch

만들었으면 재봐야 합니다. 같은 집계 쿼리를 워커 1·2·4·8로 돌려 1워커 대비 speedup을 냅니다(12코어, 최소시간).

워밍 체제(테이블이 버퍼 풀에 상주, CPU-bound):

워크로드2워커4워커8워커
가벼운 SUM(v)1.58x1.27x0.98x
COUNT(*) + WHERE1.66x1.98x1.45x
무거운 다중 집계 + WHERE1.66x2.16x1.55x

두 패턴이 또렷합니다. per-row 작업이 클수록 speedup이 크고(병렬화가 돕는 건 행당 CPU 작업이니까), 2~4워커에서 정점 후 하락합니다. 워커 수 기준으로 공정하게 보면, 4워커에서 이상적 4배 대비 2.16배, 8워커는 오히려 떨어집니다. 어느 기준으로 봐도 선형과는 멉니다. 천장 후보가 셋입니다: ① sub-ms 쿼리라 스레드 생성 오버헤드가 큼(정황), ② 굵은 버퍼 풀 latch가 페이지 fetch를 직렬화(아래 콜드 실험과 §6의 A/B로 확증), ③ 메모리 대역폭(가설).

흔한 오해 정정: “코어를 늘리면 그만큼 빨라진다?”. Amdahl의 법칙이 막아섭니다. 전체 작업 중 직렬 분율이 s면 speedup 상한은 1/s입니다. 코어가 무한이어도 그렇습니다. 이 엔진에선 leader의 직렬 출력·Finalize 구간과 latch 임계구역이 그 s입니다. 위 표의 2~4워커 정점 후 하락이 정확히 그 반례입니다: 코어를 더 줘도 직렬 구간은 그대로인데, 스레드 생성·조정 비용만 늘어납니다.

②를 증명하는 게 콜드 체제(테이블 > 풀)입니다. 캐시 miss마다 디스크 I/O(pager_read)가 풀 latch 안에서 일어나 완전히 직렬화됩니다:

SUM(v) 콜드2워커4워커8워커
speedup1.70x1.26x0.65x ← 직렬보다 느림!

워커 여덟이 latch 앞에 줄 서서 I/O를 한 번에 하나씩 처리합니다. 코어가 12개여도 I/O는 1차선. (§5의 콜드 0.65x와 §6의 before 0.62x가 다른 건 별도 실행이라서입니다. run 간 변동 ±0.03.)
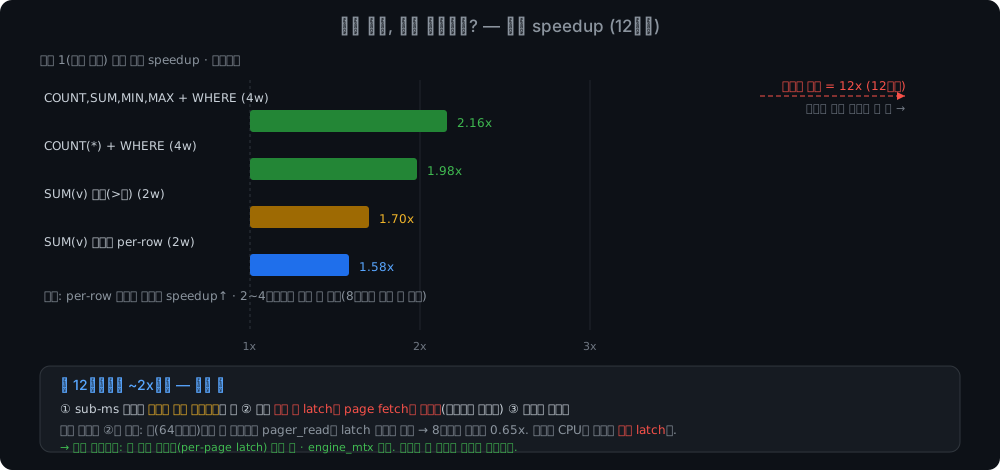
병렬 실측: 최고 2.16배, 이상적 선형(12배)과 큰 격차. 천장은 공유 latch

6. 병목을 고치다: read-in-progress, 그리고 A/B 확증

측정이 가리킨 곳을 팝니다. 사실 이 병목은 버퍼 풀 코드의 주석이 스스로 지목해 둔 프론티어였습니다. “진짜 DB는 read-in-progress 상태로 I/O를 latch 밖으로 뺀다”(1편 6절의 그 갈림길).

원리: miss가 나면 victim 프레임을 io_pending + pin으로 예약하고(로딩 중 축출 금지), latch를 놓고 pager_read를 밖에서 한 뒤, 다시 잡아 io_pending을 지우고 broadcast합니다. 같은 페이지를 동시에 miss한 다른 스레드는 io_pending을 보고 조건변수에서 기다렸다가 깨어나 hit로 잡습니다. 중복 로드 없음. 워커들이 서로 다른 페이지를 읽으면 I/O가 진짜로 겹칩니다. 이 상태 기계는 실제 시스템에도 같은 모양으로 있습니다. PostgreSQL 버퍼 매니저의 BM_IO_IN_PROGRESS 플래그(bufmgr README), InnoDB buf_page_tio_fix가 정확히 이 역할입니다.

검증이 이 절의 백미입니다. 스위치 하나로 I/O를 latch 안/밖으로 토글해 같은 프로세스·같은 워밍 상태에서 A/B를 쟀습니다. 변수가 정확히 하나뿐인 실험입니다:

콜드 SUM(v)4워커8워커
before (I/O를 latch 안)1.08x0.62x
after (I/O를 latch 밖)2.39x1.36x

I/O 직렬화가 콜드 병목이었다는 인과가 확증됩니다. 정확성은 콜드 7만 행을 8워커로 동시 로딩해 수학 oracle과 대조 + A/B 두 경로의 결과 바이트 동일 + 축출 폭풍 TSan 클린으로 못박았습니다.
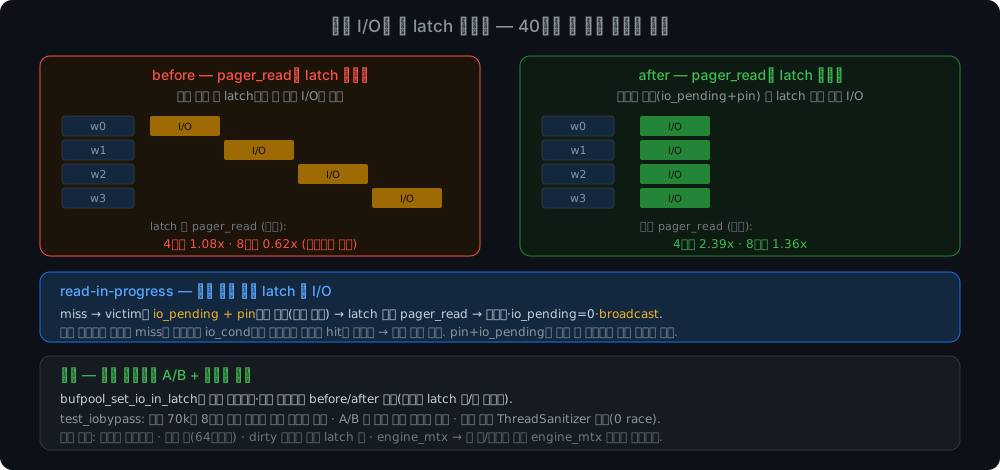
read-in-progress: before는 latch 안 I/O(직렬), after는 예약 후 latch 밖 병렬 I/O

7. 정리: 남은 천장까지 정직하게

  • 논리적 동시성(MVCC) ≠ 물리적 동시성: 굵은 latch 하나가 멀티코어를 1코어로 만든다. 걷어내되, 계층별로.
  • latch crabbing: 노드별 rwlock, “자식이 안전하면 조상 해제”. 트리를 여럿이 동시에 탄다.
  • 병렬 스캔의 3조건: 자명한 분할 + 공유 가변 상태 없음 + 스레드 안전한 바닥(버퍼 풀 latch/pin). 워커별 지역 결과로 락 자체를 없앤다.
  • 역할 분담: 워커는 읽기 전용 판정, leader는 출력/Finalize. 직렬과 바이트 동일 or 수학 oracle로 검증. 성능 작업이 silent 버그(cap 절단)까지 발굴했다.
  • 부분 집계: Partial→Finalize, 메모리 O(1). NULL은 total/cnt 분리로.
  • 재보니 천장은 공유 latch: 워밍 최고 2.16배(선형 아님), 콜드는 latch가 I/O를 직렬화해 0.62배. read-in-progress로 빼자 2.39배. 같은 프로세스 A/B로 인과 확증.
  • 남은 천장 (정직하게): 스레드 생성 오버헤드(sub-ms 쿼리), 작은 풀의 thrash, dirty 쓰기 I/O는 아직 latch 안, 그리고 서로 다른 트랜잭션의 동시 실행(inter-query)은 여전히 엔진 latch가 막는다. 이 마지막이 진짜 최종 보스다.

실무/면접 포인트: “MVCC면 동시성은 해결된 것 아니냐”는 질문엔 층을 갈라 답하는 게 정확합니다. MVCC는 논리적 동시성(가시성)이고, 물리적 병렬 실행은 별개의 층이다. 그리고 병렬의 천장은 보통 코어 수가 아니라 공유 자원(latch·메모리 대역폭)과 직렬 구간(Amdahl) 이다.

다음 편은 방향을 바꿔 단일 노드를 벗어납니다. 복제, 그리고 “복구의 redo를 스트림으로” 보내는 발상.

참고 (1차 자료 우선)

0. Introduction — Logical Concurrency ≠ Physical Concurrency

Part 4’s MVCC gave us “readers don’t block writers,” and Part 5’s server gave each connection a thread. But honestly — execution itself was serialized under one global engine latch. MVCC is logical concurrency (not blocked, by visibility); it is not physical concurrency (two queries actually running at once). A 12-core machine runs like one core.

This part is the journey of peeling that coarse latch off layer by layer. The discipline throughout: measure every step with ThreadSanitizer (“the test passed” is weak evidence for concurrent code — Part 1 §6), and at the end measure with a ruler to find the next bottleneck. Spoiler: the cold-cache ceiling was the shared latch (confirmed by the A/B in §5–6); the warm-regime ceiling has three candidates — thread-spawn overhead and the latch (circumstantial), memory bandwidth (hypothesis). Measuring showed exactly where to dig.

Lock vs latch: a transaction lock protects logical objects (rows, tables) for the duration of a transaction and comes with deadlock detection. A latch is a physical mutex protecting a critical section over an in-memory structure for microseconds, with no deadlock detection (Graefe 2010’s distinction). Everything peeled off in this part is the latter — a different layer from the logical concurrency Part 4’s MVCC dealt with.

1. B+Tree Latch Crabbing — Climbing the Tree Concurrently

First layer: the index. One lock over the whole tree serializes every lookup, so give each node (page) an rwlock and descend crab-like, grabbing and releasing:

  • Search (read crabbing): grab the child → release the parent. At most two nodes held at once; readers traverse different branches simultaneously.
  • Insert (write crabbing): hold ancestors’ write locks going down, but when the child is “safe” (roomy enough that no split can propagate) release all held ancestors. Only the path a split could climb stays locked.
  • Root splits: the moment the root itself changes is tricky — introduce a dummy parent (header) node pointing at the root, making “the root someone’s child,” and the same crabbing rules apply.

Concurrent-insert (split-storm) plus mixed read/write stress under TSan: zero data races — though TSan’s “zero” speaks for the interleavings observed, not a proof of absence. This is the textbook technique as catalogued by Graefe (2010). Real systems each picked their own variant — InnoDB mixes an index-wide rw-latch (S/SX/X) with optimistic descent, and PostgreSQL’s nbtree avoids coupling during descent altogether with Lehman-Yao B-link trees (right-sibling pointers + high keys). (Honest boundary: proven as a standalone module — wiring into the engine’s on-disk B+Tree belongs to the day the coarse latch comes off.)

2. Parallel Sequential Scan — the Buffer-Pool Latch Is the Foothold

Next layer: the scan. A read-only sequential scan is unusually easy to parallelize:

  1. Trivially partitioned — split pages [0, N) into contiguous per-worker blocks.
  2. No shared mutable state — read-only; snapshot, schema, and WHERE are immutable.
  3. The floor is already thread-safePart 1’s buffer-pool latch + pin protocol.

The third is the key justification: fetch/unpin manage pin counts under the latch and eviction skips pinned frames, so N read-only workers fetching/unpinning on the same pool concurrently is safe. The same reason PostgreSQL began its parallel query work with the parallel sequential scan.

The heart of the implementation is designing the lock away — each worker collects matching RIDs into its own local result (no shared writes), and the leader merges in worker order (= page order). At 1–16 workers the result is identical to serial down to RID set and order; TSan clean.

3. Wiring into Real SELECTs — Workers Judge, the Leader Prints

Time to plug the standalone proof into the executor. Per row, a serial full scan does four things — ① visibility gate, ② row decode, ③ WHERE evaluation, ④ output. ①②③ are read-only and parallel-safe; ④ writes a shared FILE* and must not be concurrent. So divide the labor:

Workers (parallel): bundle ①②③ into a predicate, collect only matching RIDs — the hot CPU work. Leader (serial): take the RIDs in page order and do only ④. → Results byte-identical to serial.

One trap — a WHERE containing a subquery makes the predicate re-enter the executor (which isn’t thread-safe): not parallelizable. Hence a gate: parallel only for large tables with subquery-free WHERE; everything else falls back to serial. Ineligible queries quietly take the correct path, so the whole existing test suite stays green.

Real PostgreSQL’s gate is far more elaborate. Worker count is capped by max_parallel_workers_per_gather, whose default is 2 — and when §5 shows my measured peak sitting at 2–4 workers, that conservative default suddenly makes visceral sense. Tables smaller than min_parallel_table_scan_size (default 8MB) aren’t even considered, and workers scale logarithmically — one more worker per tripling of table size. Every function carries a PARALLEL SAFE/RESTRICTED/UNSAFE marking, and one UNSAFE forces serial. And the PG docs spell out the exclusion — a query can’t be parallel if “the query writes any data or locks any database rows” — write queries are out of parallel planning entirely. My “large table + subquery-free WHERE” gate is a sketch of that system.

The skeleton of parallel execution itself also differs per system:

SystemUnit of parallelismDefault behavior
PostgreSQLprocess workers + Gather node, shared-memory tuple queuesmax_parallel_workers_per_gather defaults to 2
MySQLeffectively no parallel query execution as of 8.0 — InnoDB parallel scan is limited to CHECK TABLE, clustered-index count paths, and the like
SQL ServerthreadsMAXDOP + cost threshold for parallelism
db-hobbythreadspage-range partitioning; large tables + subquery-free WHERE only

“MySQL effectively has no parallel query” is also an interview staple.

Anti-pattern in practice: blindly raising max_parallel_workers_per_gather on an OLTP server. Sub-ms queries are dominated by worker setup/teardown cost, so parallelism actually loses (§5 confirms this by measurement), and a few workers per connection means workers contending for CPU with each other. Parallel query is a tool for a handful of big analytical queries.

Parallel SELECT — workers judge visibility+WHERE in parallel and collect RIDs; the leader prints serially in page order (byte-identical to serial)

4. Parallel Aggregation — and a Silently Wrong Bug

Reading the aggregate path to parallelize it exposed a real bug: serial aggregation collected rows only up to a fixed buffer (4,096) before computing — SELECT COUNT(*) on a 6,000-row table returned 4096. No error; a silently wrong answer. Parallelization fixed the bug as a side effect: workers collect matching rows without the cap and feed the existing aggregate code — cap gone, answers correct.

Lesson: performance work routinely unearths correctness bugs — the code you read to make fast is the code you’d been trusting blindly. Verification must be against math oracles (SUM(1..n) = n(n+1)/2), not against serial — serial was wrong.

One step further — there’s no need to collect rows at all to compute SUM. True partial aggregation: workers sweep their page ranges updating only per-item accumulators ({count, sum, min, max}); the leader combines the partials (COUNT=Σcnt, MIN=min of mins, AVG=Σsum/Σcnt). The same two-phase structure as PostgreSQL’s Partial Aggregate → Finalize Aggregate — except PG runs process workers under a Gather node and collects results through shared-memory tuple queues, not threads. Memory drops from O(matching rows) to O(workers × items). The subtle spot is NULL: COUNT(*) counts everything, COUNT(col)/SUM skip NULLs — hence separate total and cnt accumulators.

Partial aggregation — workers accumulate partials only (no rows collected); the leader finalizes. O(1) memory

5. Measuring — the Ceiling Is the Shared Latch, Not the CPU

Built it? Measure it. The same aggregate query at 1/2/4/8 workers, speedup vs 1 worker (12 cores, min-time).

Warm regime (table resident in the buffer pool, CPU-bound):

Workload2 workers48
light SUM(v)1.58×1.27×0.98×
COUNT(*) + WHERE1.66×1.98×1.45×
heavy multi-aggregate + WHERE1.66×2.16×1.55×

Two clear patterns — more per-row work, more speedup (parallelism helps the per-row CPU), and a peak at 2–4 workers, then decline. Judged fairly against the worker count: 2.16× at 4 workers versus an ideal 4×, and 8 workers actually drop. Far from linear by any yardstick. Three ceiling candidates: ① thread-spawn overhead dominates sub-ms queries (circumstantial); ② the coarse buffer-pool latch serializes page fetches (confirmed by the cold experiment below and §6’s A/B); ③ memory bandwidth (hypothesis).

Common misconception, corrected: “Add cores, get proportionally faster?” — Amdahl’s law stands in the way. If the serial fraction of the work is s, the speedup ceiling is 1/s — even with infinite cores. In this engine, the leader’s serial output/Finalize phase and the latch critical sections are that s. The 2–4 worker peak followed by decline in the table above is exactly the counterexample: more cores leave the serial fraction untouched while adding spawn and coordination cost.

The cold regime (table > pool) proves ②: every miss does disk I/O (pager_read) inside the pool latch, fully serialized:

cold SUM(v)2 workers48
speedup1.70×1.26×0.65× ← slower than serial!

Eight workers queue at the latch doing I/O one at a time — twelve cores, single-lane I/O. (§5’s cold 0.65× and §6’s before 0.62× differ because they’re separate runs — run-to-run variance ±0.03.)

Parallel benchmark — peak 2.16×, far from ideal linear (12×). The ceiling is the shared latch

6. Fixing the Bottleneck — read-in-progress, Confirmed by A/B

Dig where the measurement points. This bottleneck was in fact a frontier the buffer-pool code’s own comment had named — “a real DB moves I/O out of the latch with a read-in-progress state” (the fork noted in Part 1 §6).

The principle: on a miss, reserve the victim frame as io_pending + pinned (no eviction mid-load), release the latch, do pager_read outside, then re-acquire, clear io_pending, and broadcast. Another thread missing the same page sees io_pending, waits on a condition variable, and wakes to take it as a hit — no duplicate loads. Workers reading different pages genuinely overlap their I/O. The same state machine exists in real systems — PostgreSQL’s buffer manager has the BM_IO_IN_PROGRESS flag (bufmgr README), and InnoDB’s buf_page_t has io_fix, playing exactly this role.

The verification is the highlight: a switch toggles I/O in/out of the latch, measured as an A/B in the same process with the same warm-up — an experiment with exactly one variable:

cold SUM(v)4 workers8 workers
before (I/O inside the latch)1.08×0.62×
after (I/O outside the latch)2.39×1.36×

Causality confirmed: I/O serialization was the cold ceiling. Correctness pinned by 8-worker concurrent loading of a cold 70k-row table against math oracles, byte-identical A/B results, and a TSan-clean eviction storm.

read-in-progress — before: I/O inside the latch (serial); after: reserve, then parallel I/O outside the latch

7. Wrap-up — Honest About the Remaining Ceilings

  • Logical (MVCC) ≠ physical concurrency — one coarse latch turns multicore into one core. Peel it — layer by layer.
  • Latch crabbing — per-node rwlocks; “release ancestors when the child is safe.” Many climbers, one tree.
  • Three conditions for parallel scans — trivial partitioning + no shared mutable state + a thread-safe floor (pool latch/pin). Per-worker local results design the lock away.
  • Division of labor — workers do read-only judging; the leader prints/finalizes. Verified byte-identical to serial or against math oracles. The performance work even unearthed a silent bug (cap truncation).
  • Partial aggregation — Partial→Finalize, O(1) memory; NULLs via separate total/cnt.
  • Measured: the ceiling is the shared latch — 2.16× warm peak (not linear); cold drops to 0.62× as the latch serializes I/O. read-in-progress lifts it to 2.39× — causality confirmed by a same-process A/B.
  • Remaining ceilings (honestly): thread-spawn overhead on sub-ms queries, small-pool thrash, dirty write I/O still inside the latch, and concurrent execution of different transactions (inter-query) still blocked by the engine latch — that last one is the true final boss.

Practice/interview point: to “doesn’t MVCC solve concurrency?”, the precise answer splits the layers — MVCC is logical concurrency (visibility); physical parallel execution is a separate layer. And the parallel ceiling is usually not the core count but shared resources (latches, memory bandwidth) and the serial fraction (Amdahl).

Next, a change of direction — beyond the single node: replication, and the idea of “streaming recovery’s redo.”

References (primary sources first)

Author
작성자 @범수

오늘의 노력이 내일의 전문성을 만든다고 믿습니다.

댓글

댓글 수정/삭제는 GitHub Discussions에서 가능합니다.