검색엔진이 시스템을 마비시킨 과정과 대응
목차
나무위키(57만 건) + 한국어 위키백과(74만 건) + 영어 위키백과(714만 건) + 뉴스(16만 건) + 웹 콘텐츠(354만 건), 총 약 1,215만 건의 데이터를 MySQL에 적재하고 검색 기능을 구현하는 프로젝트입니다.
기술 스택: Java 25, Spring Boot 4.0, MySQL 8.0, HikariCP
검색은 가장 단순한 방식인 LIKE '%keyword%'로 시작했습니다.
각 단계에서 병목을 직접 측정하고, 해당 기술의 한계가 드러나는 지점에서 다음 기술로 전환하는 방식으로 진행합니다.
단계마다 성능, 구현 복잡도, 운영 비용의 트레이드오프를 비교하여 최적의 전환 시점을 판단하는 것이 이 프로젝트의 핵심입니다.
1. 정상 상태
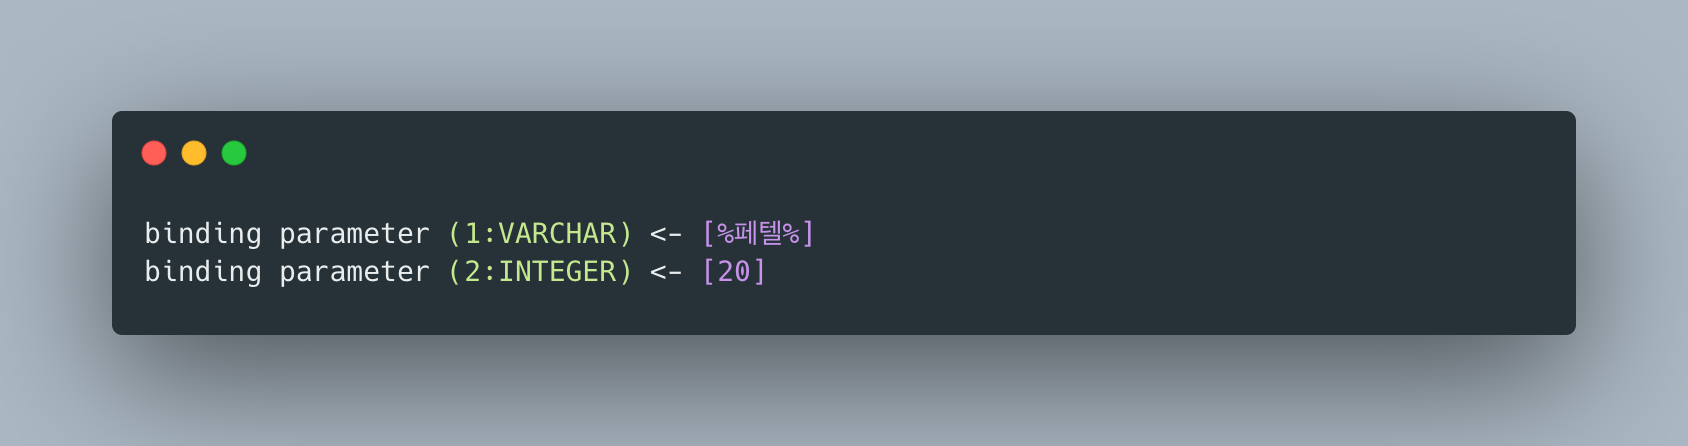
검색 API는 제목(title)과 본문(content)에 대해 LIKE '%keyword%' 패턴으로 검색합니다.
SELECT * FROM postsWHERE title LIKE '%keyword%' OR content LIKE '%keyword%'ORDER BY created_at DESCLIMIT 20 OFFSET 0;이 시점에서는 인덱스가 없고, 테이블에는 약 1,215만 행이 존재합니다.
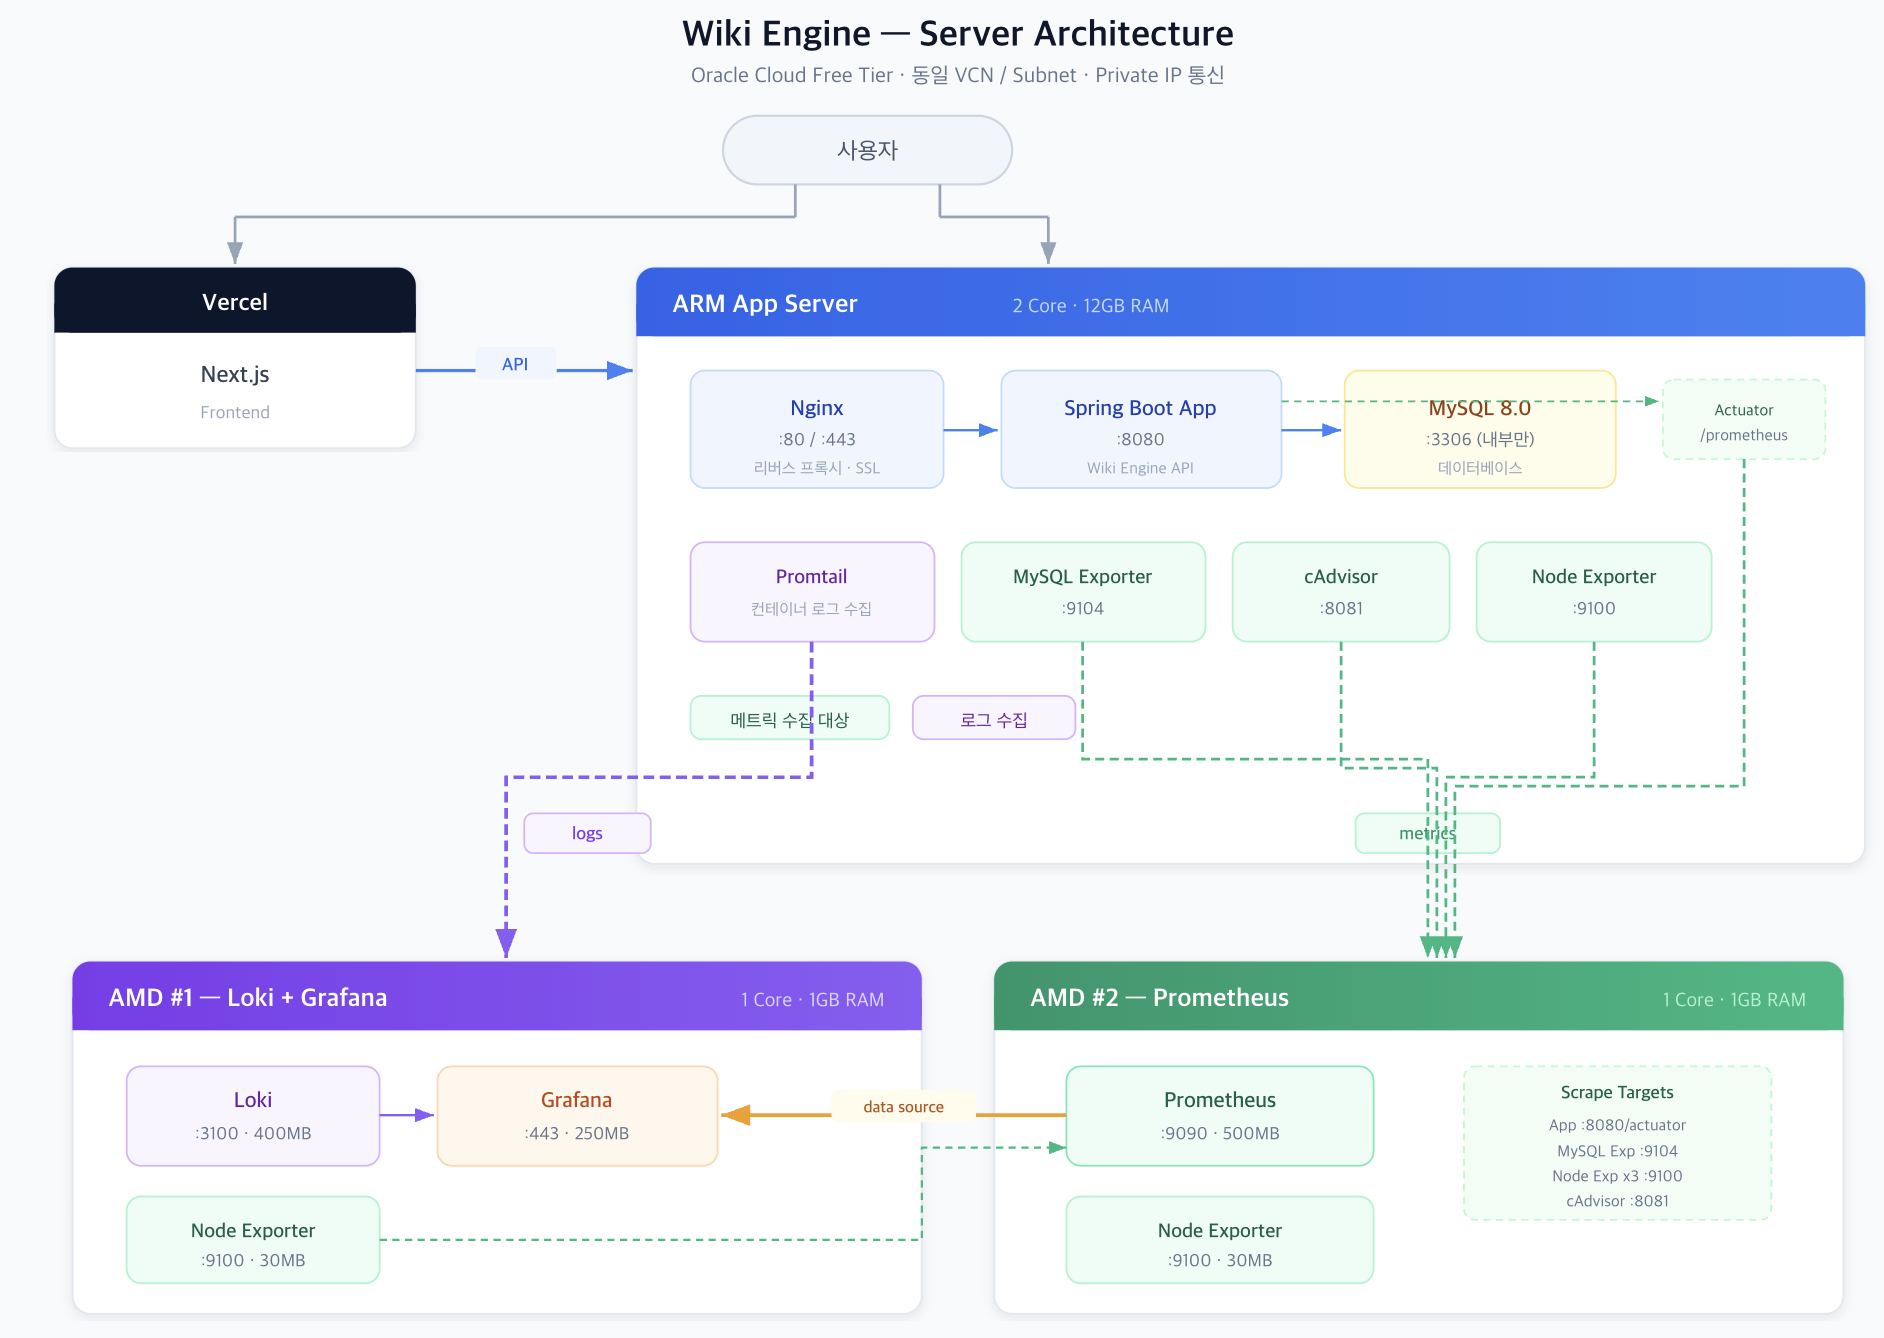
서버 현황
- App Server: ARM 2코어 / 12GB RAM
- Spring Boot: 컨테이너 2GB / JVM 힙 1GB (
-Xmx1g) - MySQL 8.0: 컨테이너 4GB / InnoDB Buffer Pool 2GB
- 나머지: Nginx(256MB), Promtail(256MB), cAdvisor(256MB), Exporter 등 → 합계 ~7GB, 나머지 ~5GB는 OS 캐시
- Spring Boot: 컨테이너 2GB / JVM 힙 1GB (
- HikariCP 기본 설정 (maximumPoolSize=10)
- 검색 외 다른 API(게시글 목록, 상세 조회 등)는 정상 동작
2. 문제 발생: 검색 한 번에 시스템 전체가 마비
검색 API를 한 번 호출하자 다음과 같은 현상이 발생했습니다:
- 검색 API 자체가 응답하지 않음 - 수십 초 이상 대기
- 다른 API까지 전부 503 응답 - 게시글 목록, 상세 조회 등 전혀 무관한 API도 실패
- 서버 전체가 사실상 다운 상태
503 응답 확인
검색과 무관한 API까지 모두 503을 반환하는 것은, 문제가 검색 쿼리 자체가 아니라 공유 리소스의 고갈임을 의미합니다.
3. 원인 분석
3-1. Full Table Scan
LIKE '%keyword%'는 와일드카드가 앞에 있어 B-Tree 인덱스를 사용할 수 없습니다.
MySQL은 1,215만 행 전체를 순차 스캔합니다.
EXPLAIN SELECT * FROM postsWHERE title LIKE '%keyword%' OR content LIKE '%keyword%';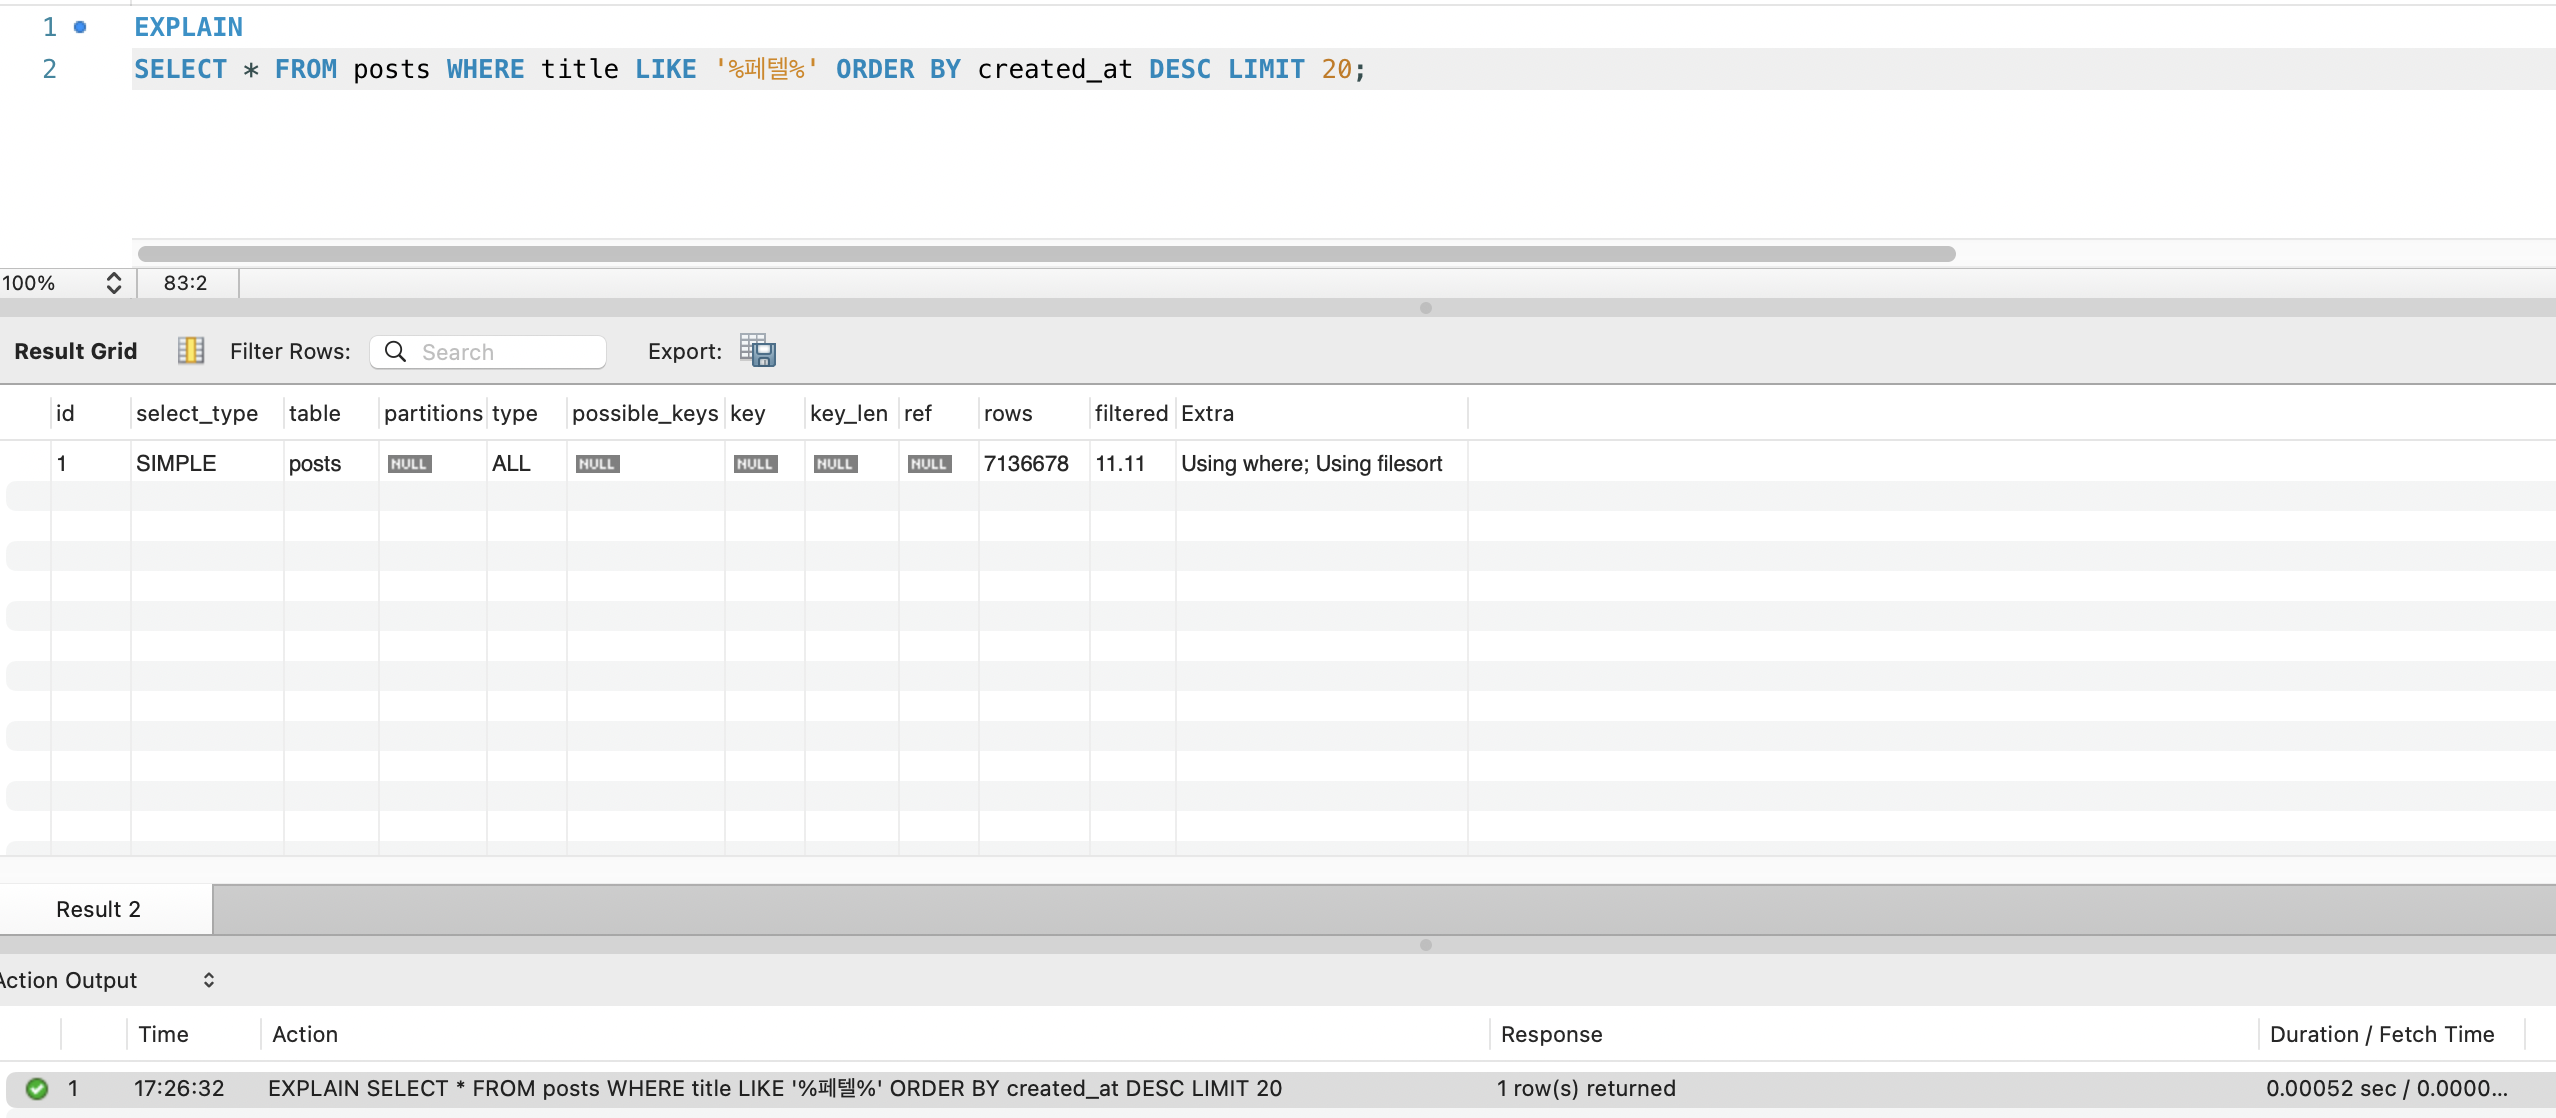
type: ALL→ Full Table Scanrows: 27,443,742→ 전체 행 스캔
content 컬럼은 LONGTEXT이므로, 각 행마다 수 KB~수십 KB의 텍스트를 메모리에 로드하여 패턴 매칭합니다.
3-2. HikariCP 커넥션 풀 고갈
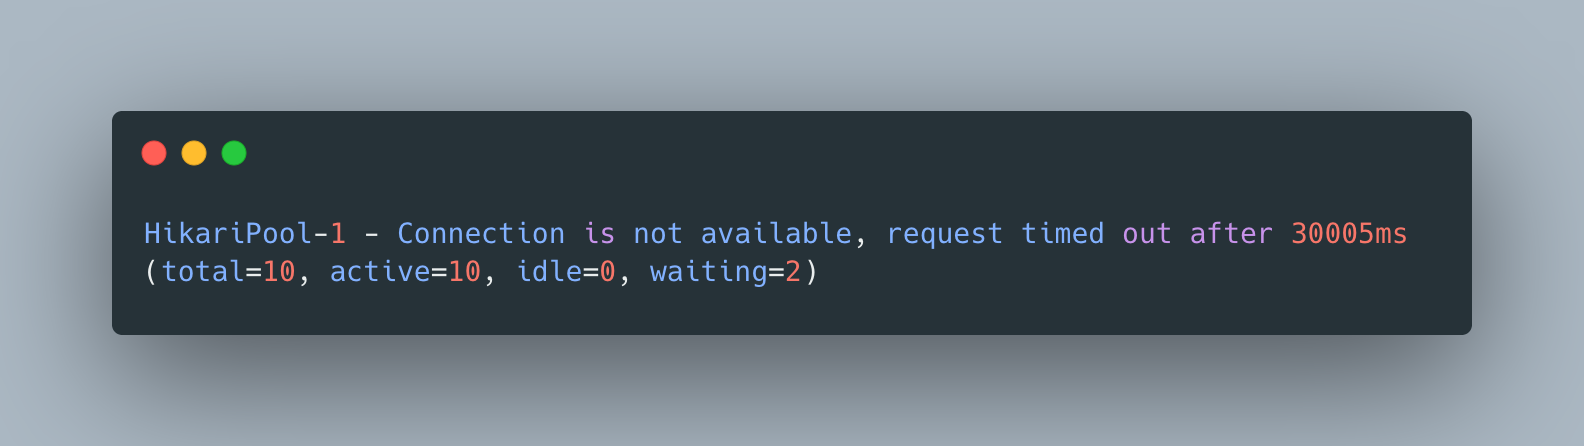
HikariPool-1 - Connection is not available, request timed out after 30000ms연쇄 장애 시나리오:
- 검색 쿼리가 커넥션 1개를 점유하고 수십 초간 반환하지 않음
- 후속 요청들이 커넥션을 기다리며 큐에 쌓임
- HikariCP의
maximumPoolSize=10이 금방 소진 - 모든 API가 커넥션을 얻지 못해 30초 후 타임아웃 → 503
핵심: 단 하나의 느린 쿼리가 커넥션 풀을 점유하면, 그 커넥션 풀을 공유하는 모든 기능이 연쇄적으로 마비됩니다.
4. 긴급 완화 조치
문제의 근본 원인은 “인덱스 없는 LIKE 검색”이지만, 당장의 시스템 안정성을 확보하기 위해 4가지 긴급 조치를 적용했습니다.
4-1. content LIKE 제거 → title만 검색
가장 큰 비용은 LONGTEXT인 content 컬럼의 LIKE 검색입니다.
-- BeforeWHERE title LIKE '%keyword%' OR content LIKE '%keyword%'
-- AfterWHERE title LIKE '%keyword%'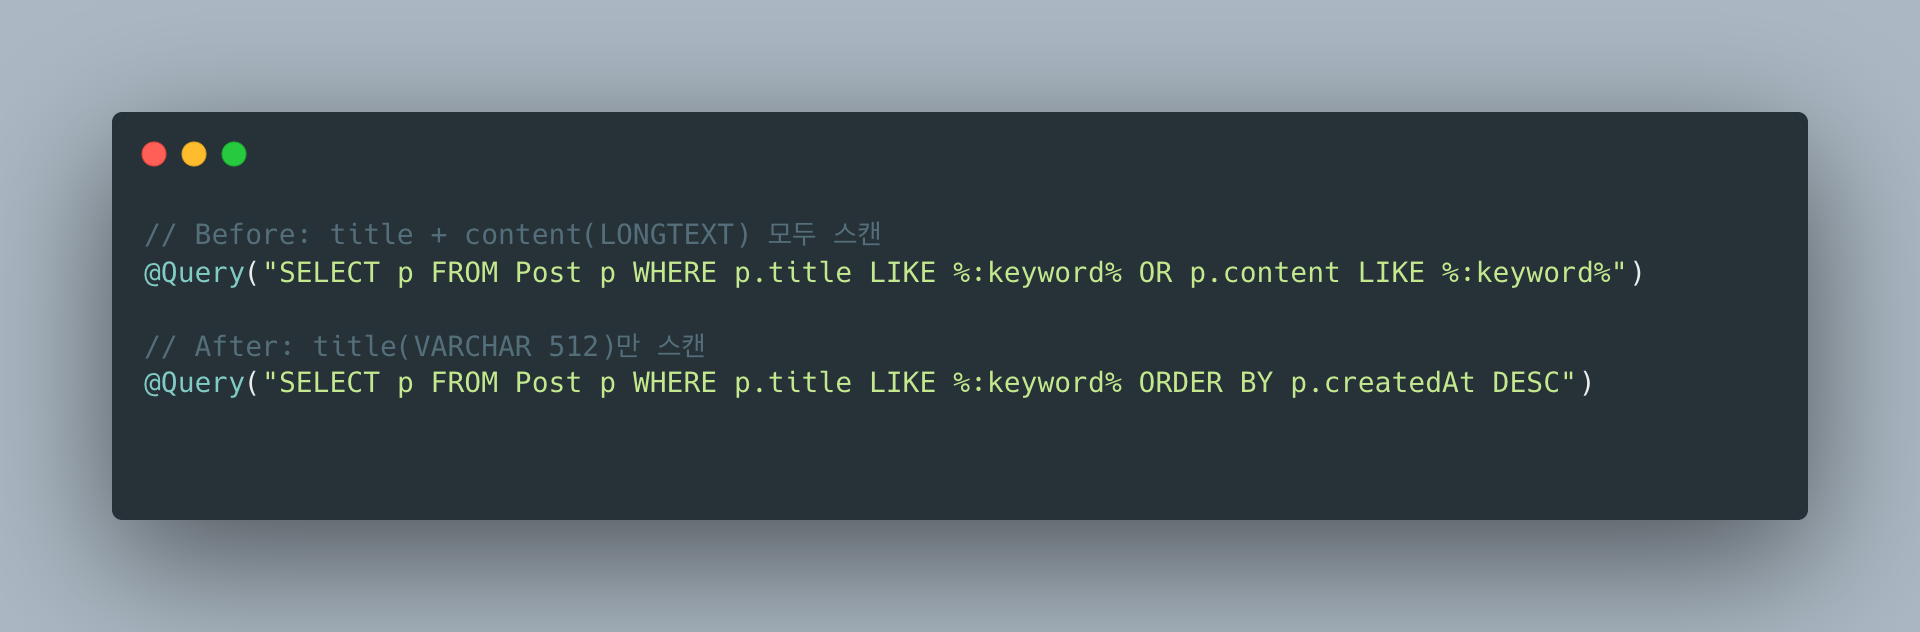
content LIKE를 제거하면 각 행에서 비교하는 데이터 크기가 수 KB → 수십 바이트로 줄어듭니다.
여전히 Full Table Scan이지만, I/O와 CPU 비용이 크게 감소합니다.
4-2. 쿼리 타임아웃 설정
@Transactional(readOnly = true, timeout = 5)public Page<PostSearchResponse> search(...) { ... }![]()
5초 이내에 완료되지 않는 쿼리는 강제 종료하여 커넥션을 반환합니다.
4-3. HikariCP fail-fast 설정
spring: datasource: hikari: connection-timeout: 3000 # 기본 30초 → 3초 maximum-pool-size: 10커넥션을 3초 이상 얻지 못하면 즉시 실패시켜, 요청이 큐에 쌓이는 것을 방지합니다.
4-4. 타임아웃 전용 예외 처리
@ExceptionHandler(QueryTimeoutException.class)public ResponseEntity<ErrorResponse> handleQueryTimeout(QueryTimeoutException e) { return ResponseEntity.status(HttpStatus.SERVICE_UNAVAILABLE) .body(new ErrorResponse("검색 시간이 초과되었습니다. 더 구체적인 키워드로 검색해주세요."));}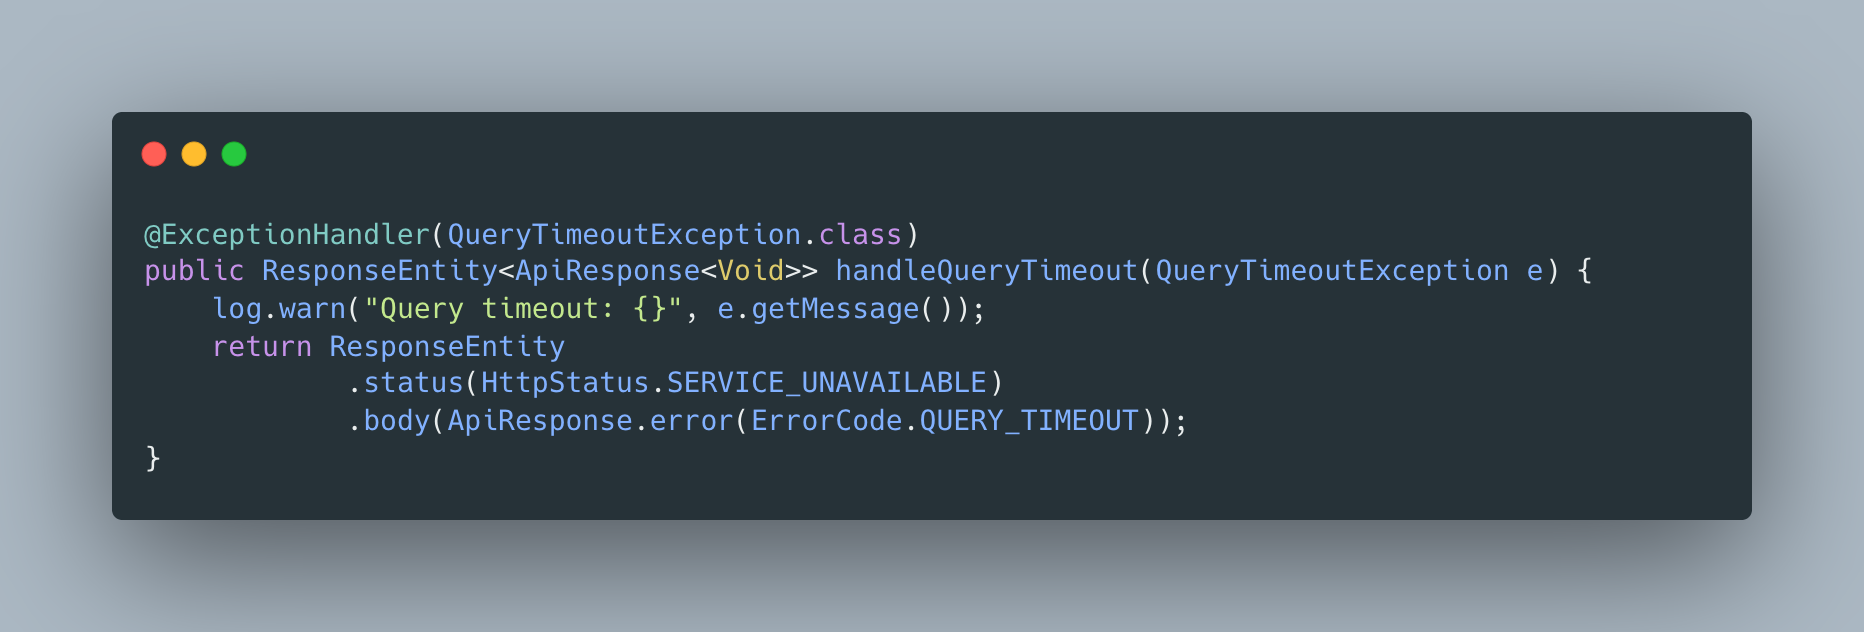
타임아웃이 발생하면 사용자에게 명확한 메시지를 반환합니다.
조치 결과
- 검색이 5초를 초과하면 타임아웃 → 커넥션 즉시 반환
- 다른 API가 영향받지 않음 → 시스템 안정성 확보
- 단, 검색 자체의 성능 문제는 여전히 미해결
5. Baseline 측정
긴급 조치 후, 현재 상태의 정확한 성능을 측정하여 개선의 기준점을 잡습니다.
EXPLAIN 결과
EXPLAIN SELECT * FROM postsWHERE title LIKE '%keyword%'ORDER BY created_at DESCLIMIT 20;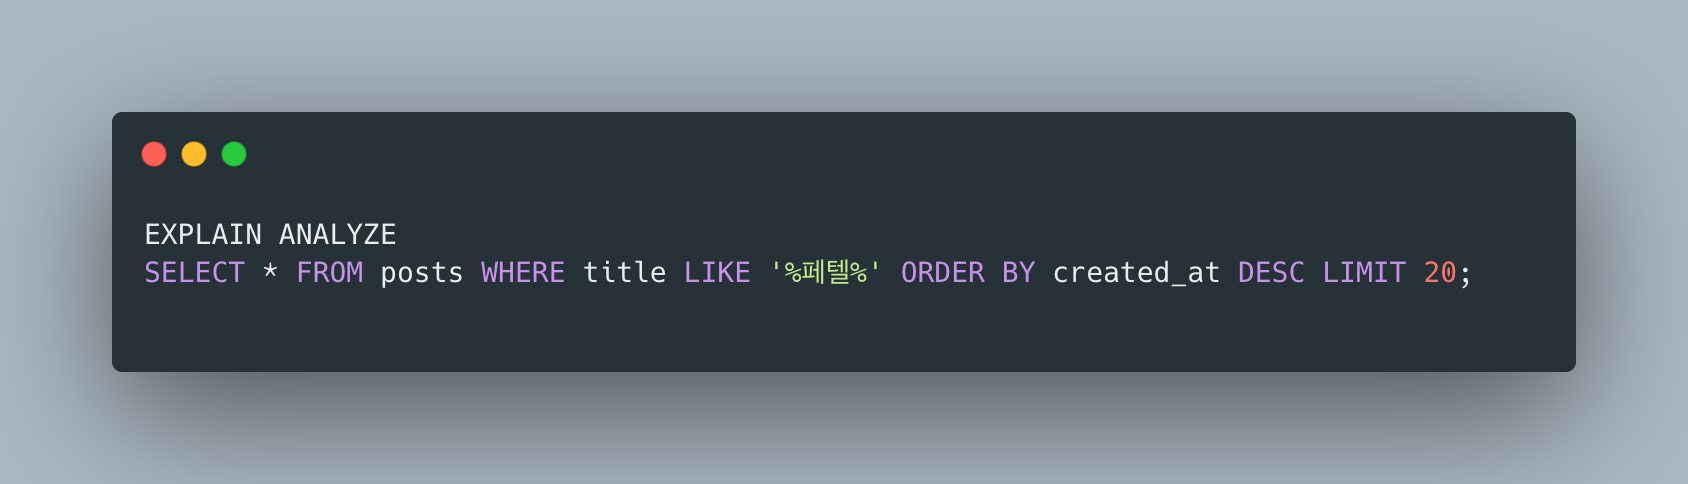
| 항목 | 값 |
|---|---|
| type | ALL (Full Table Scan) |
| rows | 27,443,742 |
| filtered | 11.11% |
| Extra | Using where; Using filesort |
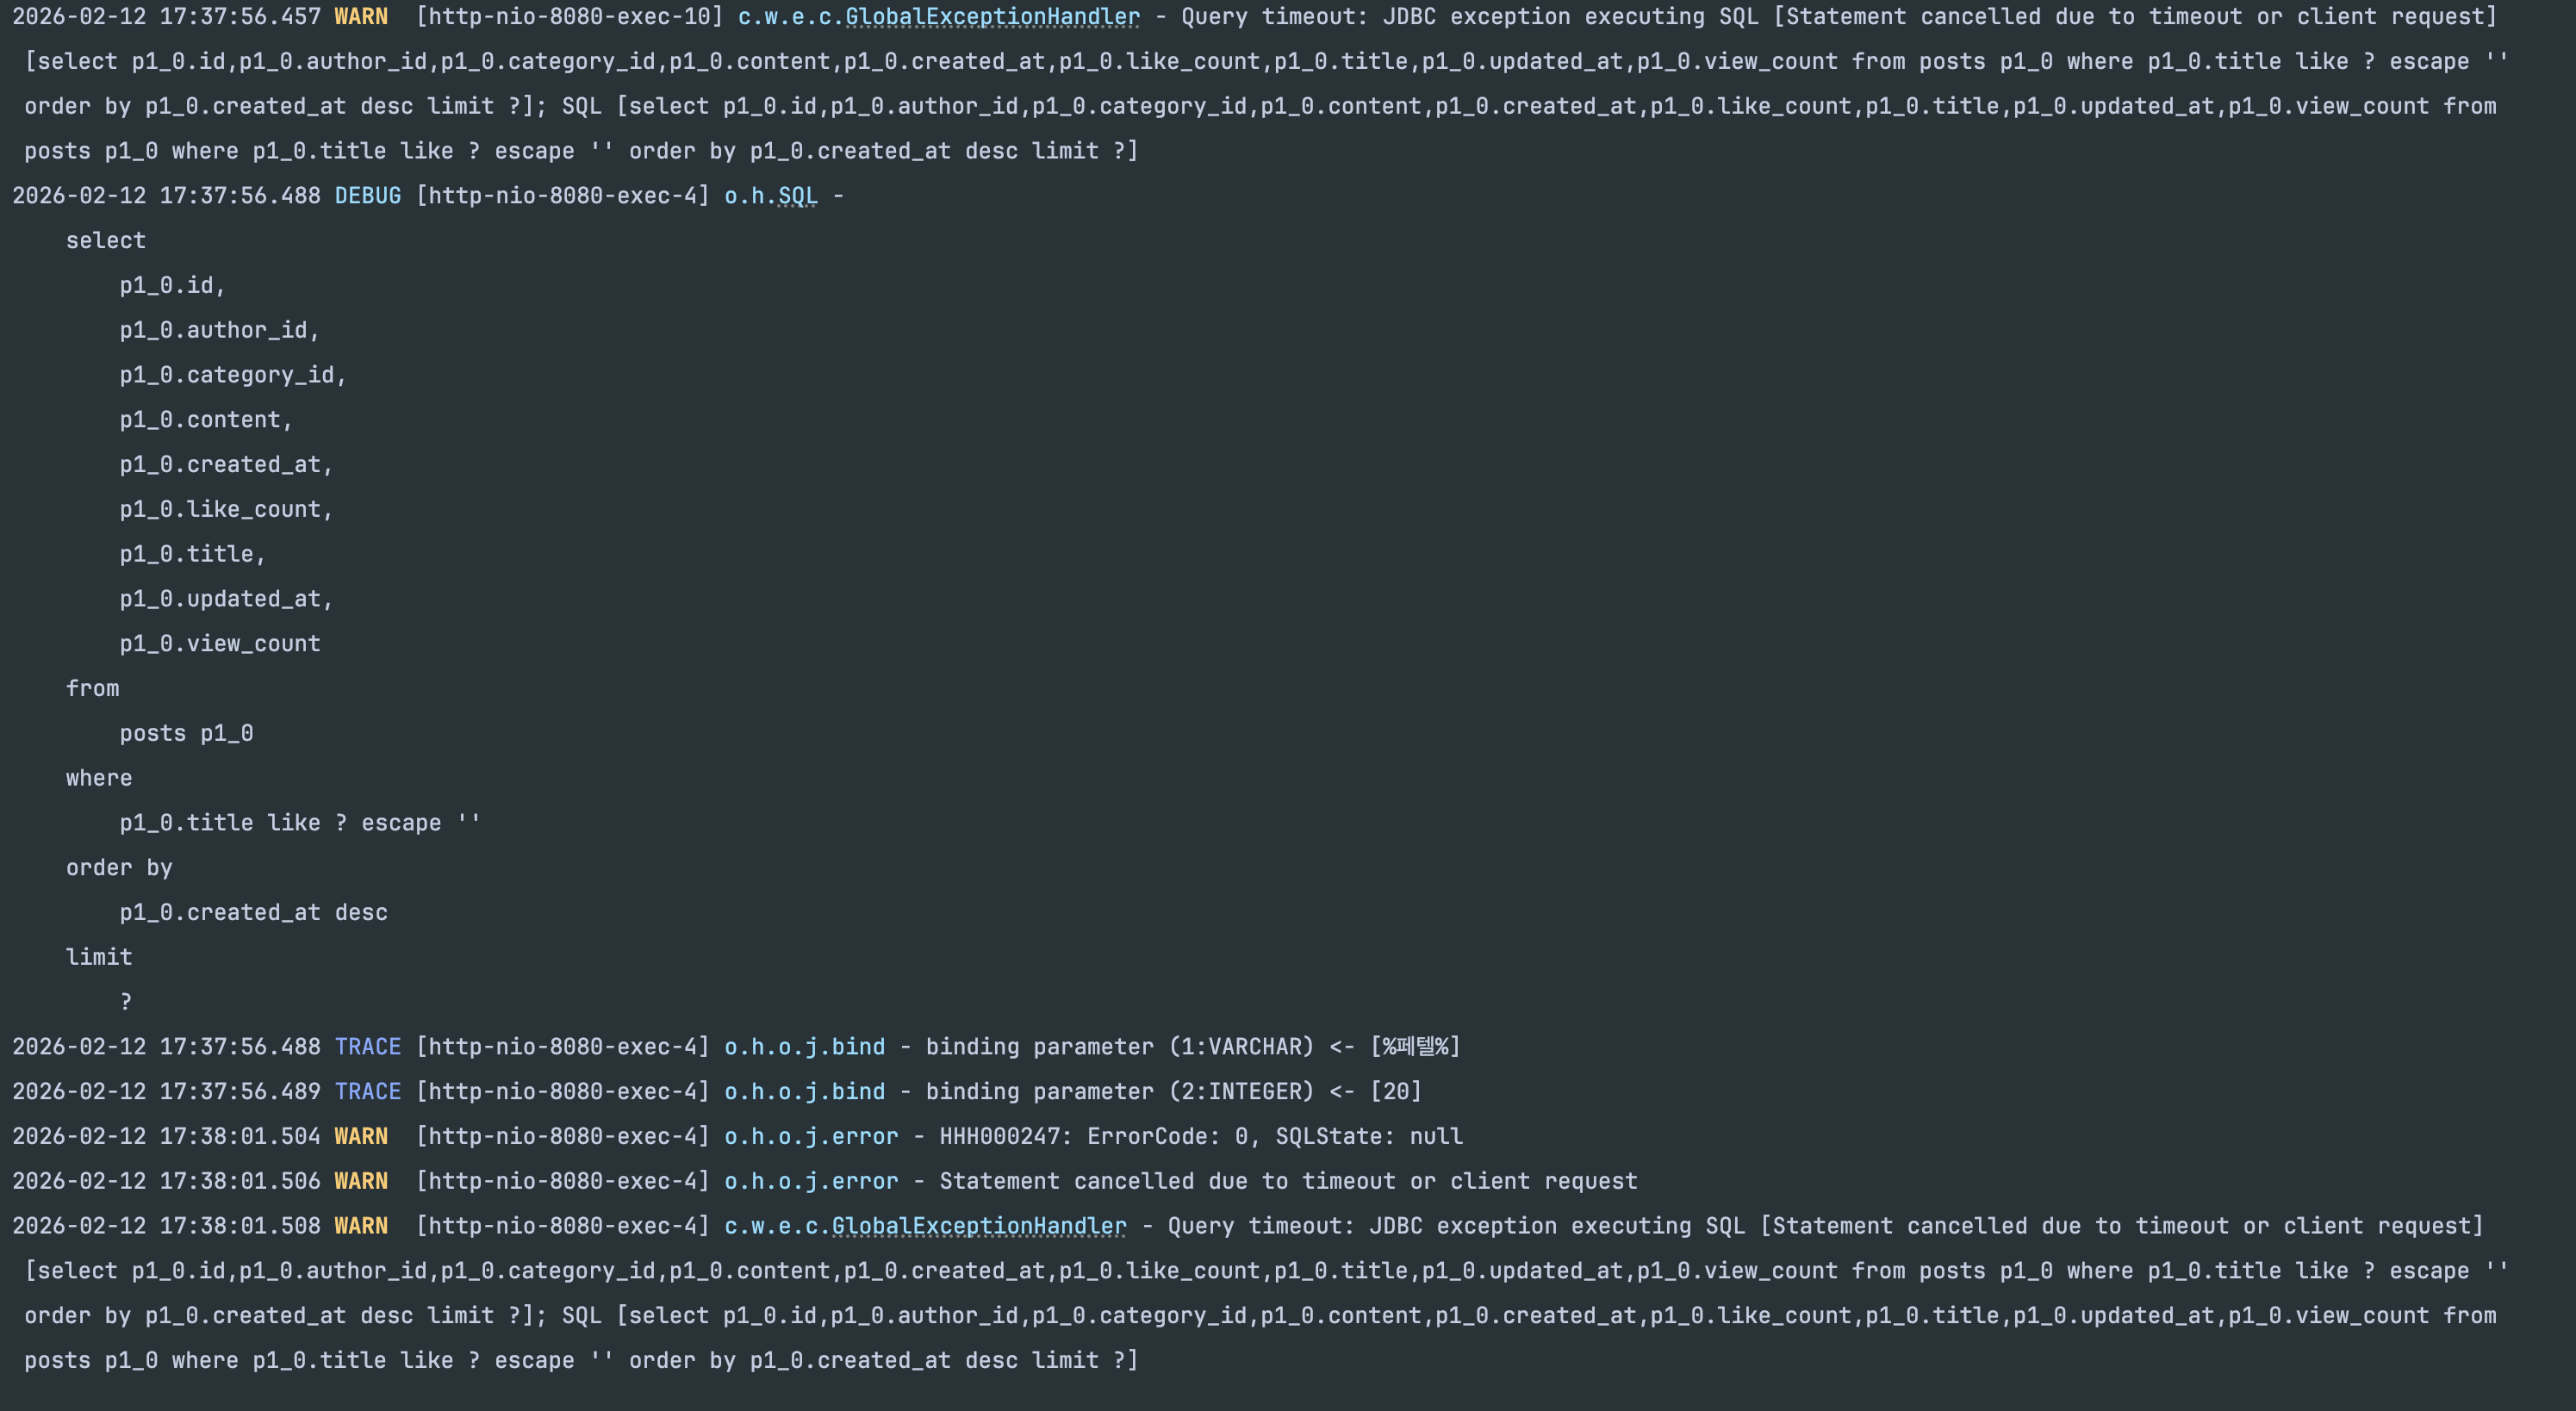
EXPLAIN ANALYZE 시도
EXPLAIN ANALYZE SELECT * FROM postsWHERE title LIKE '%keyword%'ORDER BY created_at DESCLIMIT 20;
EXPLAIN ANALYZE는 실제로 쿼리를 실행하므로, 1,215만 행 Full Table Scan + filesort를 수행합니다.
5초 타임아웃에 의해 중단되어 실제 실행 시간은 측정할 수 없었습니다.
6. 현재 위치
서버 현황
| 서버 | 스펙 | 역할 |
|---|---|---|
| App Server | ARM 2코어 / 12GB RAM | Nginx + Spring Boot + MySQL |
| Monitoring #1 | AMD 1GB + Swap 1GB | Loki + Grafana + Nginx (HTTPS) |
| Monitoring #2 | AMD 1GB + Swap 1GB | Prometheus |
App Server 12GB 내부 배분: Spring Boot 2GB(JVM 힙 1GB) + MySQL 4GB(InnoDB BP 2GB) + 모니터링 에이전트 ~1GB = 합계 ~7GB. 나머지 ~5GB는 OS 페이지 캐시.
검색 상태
| 항목 | 현재 상태 |
|---|---|
| 검색 방식 | LIKE '%keyword%' (title만) |
| 스캔 방식 | Full Table Scan (27,443,742 rows) |
| 인덱스 | 없음 |
| 정렬 | filesort (created_at DESC) |
| 타임아웃 | 5초 (@Transactional timeout) |
| 커넥션 풀 | HikariCP 10개, fail-fast 3초 |
긴급 조치로 시스템 안정성은 확보했지만, 검색 성능 자체는 최악의 상태입니다.
다음 단계에서는 MySQL의 인덱스를 활용하여 Full Table Scan을 제거하는 것을 목표로 합니다.
This is a project to load Namuwiki (~1M documents) + Korean Wikipedia (~2.16M documents) + English Wikipedia (~25.28M documents), totaling approximately 27.44M wiki dump records into MySQL and implement search functionality.
Tech Stack: Java 25, Spring Boot 4.0, MySQL 8.0, HikariCP
Search started with the simplest approach: LIKE '%keyword%'.
At each stage, we directly measure bottlenecks and transition to the next technology when the current one’s limitations become apparent.
Comparing trade-offs of performance, implementation complexity, and operational cost at each stage to determine the optimal transition point is the core of this project.
1. Normal State
The search API searches title and content using LIKE '%keyword%' pattern.
SELECT * FROM postsWHERE title LIKE '%keyword%' OR content LIKE '%keyword%'ORDER BY created_at DESCLIMIT 20 OFFSET 0;At this point, there are no indexes and the table contains approximately 27.44M rows.
Server Status
- App Server: ARM 2 cores / 12GB RAM
- Spring Boot: container 2GB / JVM heap 1GB (
-Xmx1g) - MySQL 8.0: container 4GB / InnoDB Buffer Pool 2GB
- Rest: Nginx(256MB), Promtail(256MB), cAdvisor(256MB), Exporters, etc. → total ~7GB, remaining ~5GB for OS page cache
- Spring Boot: container 2GB / JVM heap 1GB (
- HikariCP default settings (maximumPoolSize=10)
- Other APIs (post list, detail view, etc.) working normally
2. Problem: A Single Search Crashes the Entire System
After calling the search API once, the following occurred:
- Search API itself stops responding - waiting for dozens of seconds
- All other APIs return 503 - completely unrelated APIs like post list and detail view also fail
- The entire server is effectively down
503 Response Confirmed
The fact that APIs unrelated to search also return 503 indicates that the problem is not the search query itself, but exhaustion of a shared resource.
3. Root Cause Analysis
3-1. Full Table Scan
LIKE '%keyword%' has a leading wildcard, making it impossible to use B-Tree indexes.
MySQL sequentially scans all 27.44M rows.
EXPLAIN SELECT * FROM postsWHERE title LIKE '%keyword%' OR content LIKE '%keyword%';
type: ALL→ Full Table Scanrows: 27,443,742→ Scanning all rows
The content column is LONGTEXT, so each row loads several KB to tens of KB of text into memory for pattern matching.
3-2. HikariCP Connection Pool Exhaustion
HikariPool-1 - Connection is not available, request timed out after 30000msCascading failure scenario:
- Search query occupies one connection and doesn’t return it for dozens of seconds
- Subsequent requests queue up waiting for connections
- HikariCP’s
maximumPoolSize=10is quickly exhausted - All APIs fail to acquire connections and timeout after 30 seconds → 503
Key insight: When a single slow query holds a connection, all features sharing that connection pool are cascadingly paralyzed.
4. Emergency Mitigation
The root cause is “LIKE search without indexes,” but to secure immediate system stability, four emergency measures were applied.
4-1. Remove content LIKE → Search title only
The biggest cost is the LIKE search on the LONGTEXT content column.
-- BeforeWHERE title LIKE '%keyword%' OR content LIKE '%keyword%'
-- AfterWHERE title LIKE '%keyword%'
Removing content LIKE reduces the data compared per row from several KB to tens of bytes.
It’s still a Full Table Scan, but I/O and CPU costs are significantly reduced.
4-2. Query Timeout Setting
@Transactional(readOnly = true, timeout = 5)public Page<PostSearchResponse> search(...) { ... }![]()
Queries not completing within 5 seconds are forcefully terminated to return the connection.
4-3. HikariCP Fail-Fast Configuration
spring: datasource: hikari: connection-timeout: 3000 # Default 30s → 3s maximum-pool-size: 10If a connection cannot be obtained within 3 seconds, it fails immediately, preventing requests from queuing up.
4-4. Timeout-Specific Exception Handler
@ExceptionHandler(QueryTimeoutException.class)public ResponseEntity<ErrorResponse> handleQueryTimeout(QueryTimeoutException e) { return ResponseEntity.status(HttpStatus.SERVICE_UNAVAILABLE) .body(new ErrorResponse("Search timed out. Please try a more specific keyword."));}
When a timeout occurs, a clear message is returned to the user.
Mitigation Results
- Search exceeding 5 seconds triggers timeout → connection immediately returned
- Other APIs unaffected → system stability secured
- However, the search performance issue itself remains unresolved
5. Baseline Measurement
After emergency measures, we measure exact performance of the current state to establish an improvement baseline.
EXPLAIN Results
EXPLAIN SELECT * FROM postsWHERE title LIKE '%keyword%'ORDER BY created_at DESCLIMIT 20;
| Item | Value |
|---|---|
| type | ALL (Full Table Scan) |
| rows | 27,443,742 |
| filtered | 11.11% |
| Extra | Using where; Using filesort |
EXPLAIN ANALYZE Attempt
EXPLAIN ANALYZE SELECT * FROM postsWHERE title LIKE '%keyword%'ORDER BY created_at DESCLIMIT 20;
EXPLAIN ANALYZE actually executes the query, performing a Full Table Scan + filesort on 27.44M rows.
It was interrupted by the 5-second timeout, so the actual execution time could not be measured.
6. Current Status
Server Status
| Server | Specs | Role |
|---|---|---|
| App Server | ARM 2 cores / 12GB RAM | Nginx + Spring Boot + MySQL |
| Monitoring #1 | AMD 1GB + 1GB Swap | Loki + Grafana + Nginx (HTTPS) |
| Monitoring #2 | AMD 1GB + 1GB Swap | Prometheus |
App Server 12GB breakdown: Spring Boot 2GB (JVM heap 1GB) + MySQL 4GB (InnoDB BP 2GB) + monitoring agents ~1GB = total ~7GB. Remaining ~5GB for OS page cache.
Search Status
| Item | Current State |
|---|---|
| Search method | LIKE '%keyword%' (title only) |
| Scan type | Full Table Scan (27,443,742 rows) |
| Index | None |
| Sorting | filesort (created_at DESC) |
| Timeout | 5 seconds (@Transactional timeout) |
| Connection pool | HikariCP 10, fail-fast 3 seconds |
Emergency measures secured system stability, but search performance itself remains at its worst.
The next step aims to eliminate Full Table Scan by utilizing MySQL indexes.

댓글
댓글 수정/삭제는 GitHub Discussions에서 가능합니다.