오락가락 - 음성 분석 파이프라인과 모니터링의 세계

목차
프로젝트 소개
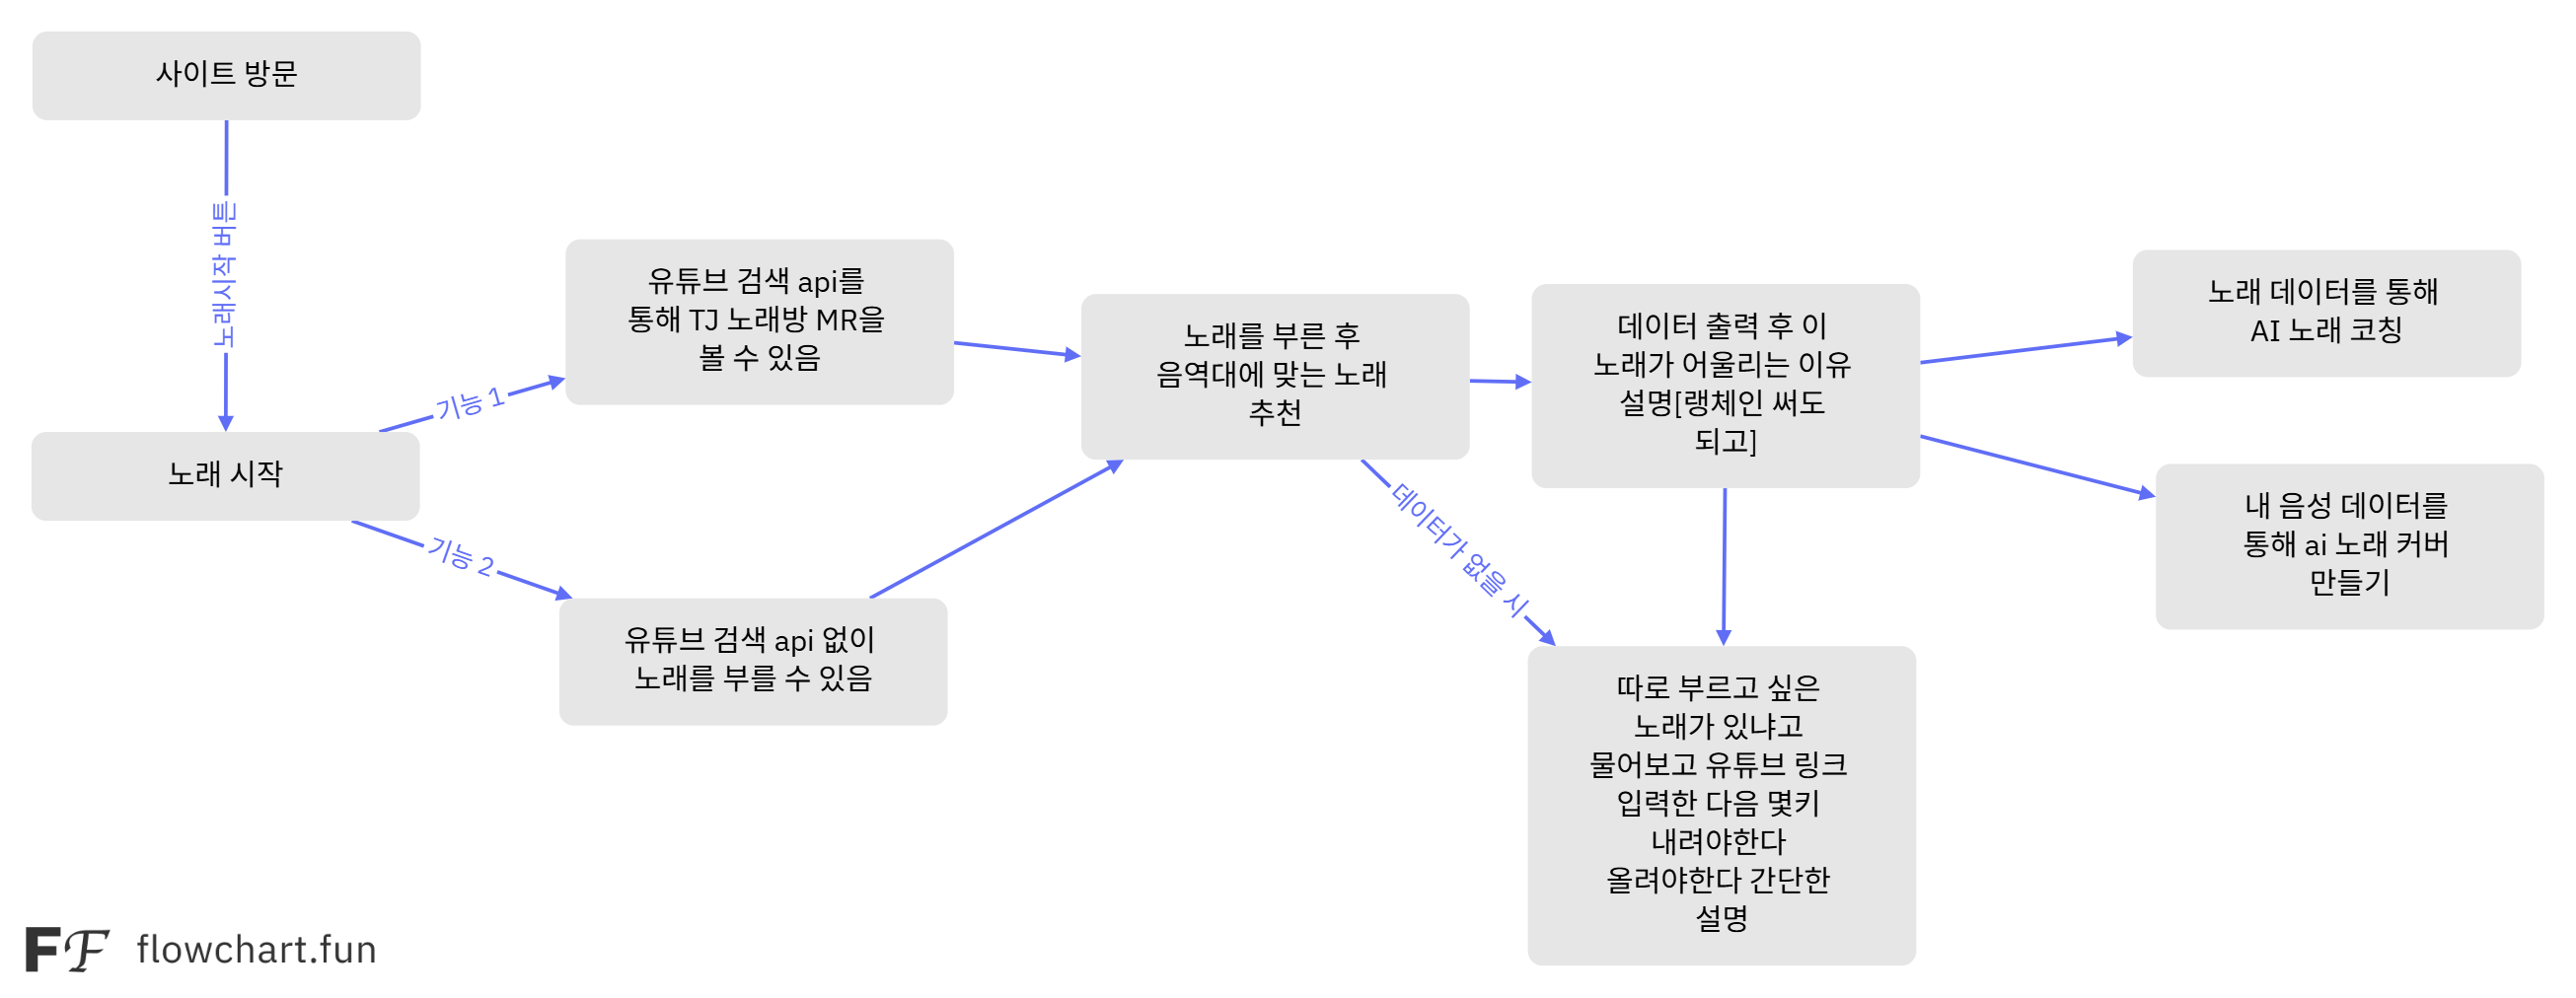
오락가락은 내 목소리 데이터를 기반으로 노래를 추천해주는 플랫폼입니다.
노래방에서 “뭐 부르지?” 고민하는 상황, 팀원 6명 중 5명이 비슷한 경험이 있었습니다.
일반적인 음악 추천은 “청취 기록” 기반이지만, 내가 좋아하는 노래와 내가 잘 부를 수 있는 노래는 다릅니다.
사용자가 노래를 부르면 AI가 음역대와 음색을 분석해서, 비슷한 음역대의 인기 곡을 추천해줍니다.
기간: 2025.08.26 - 2025.09.30 (5주)
팀 구성: 6명 (프론트엔드 2명, 백엔드 3명, AI 1명)
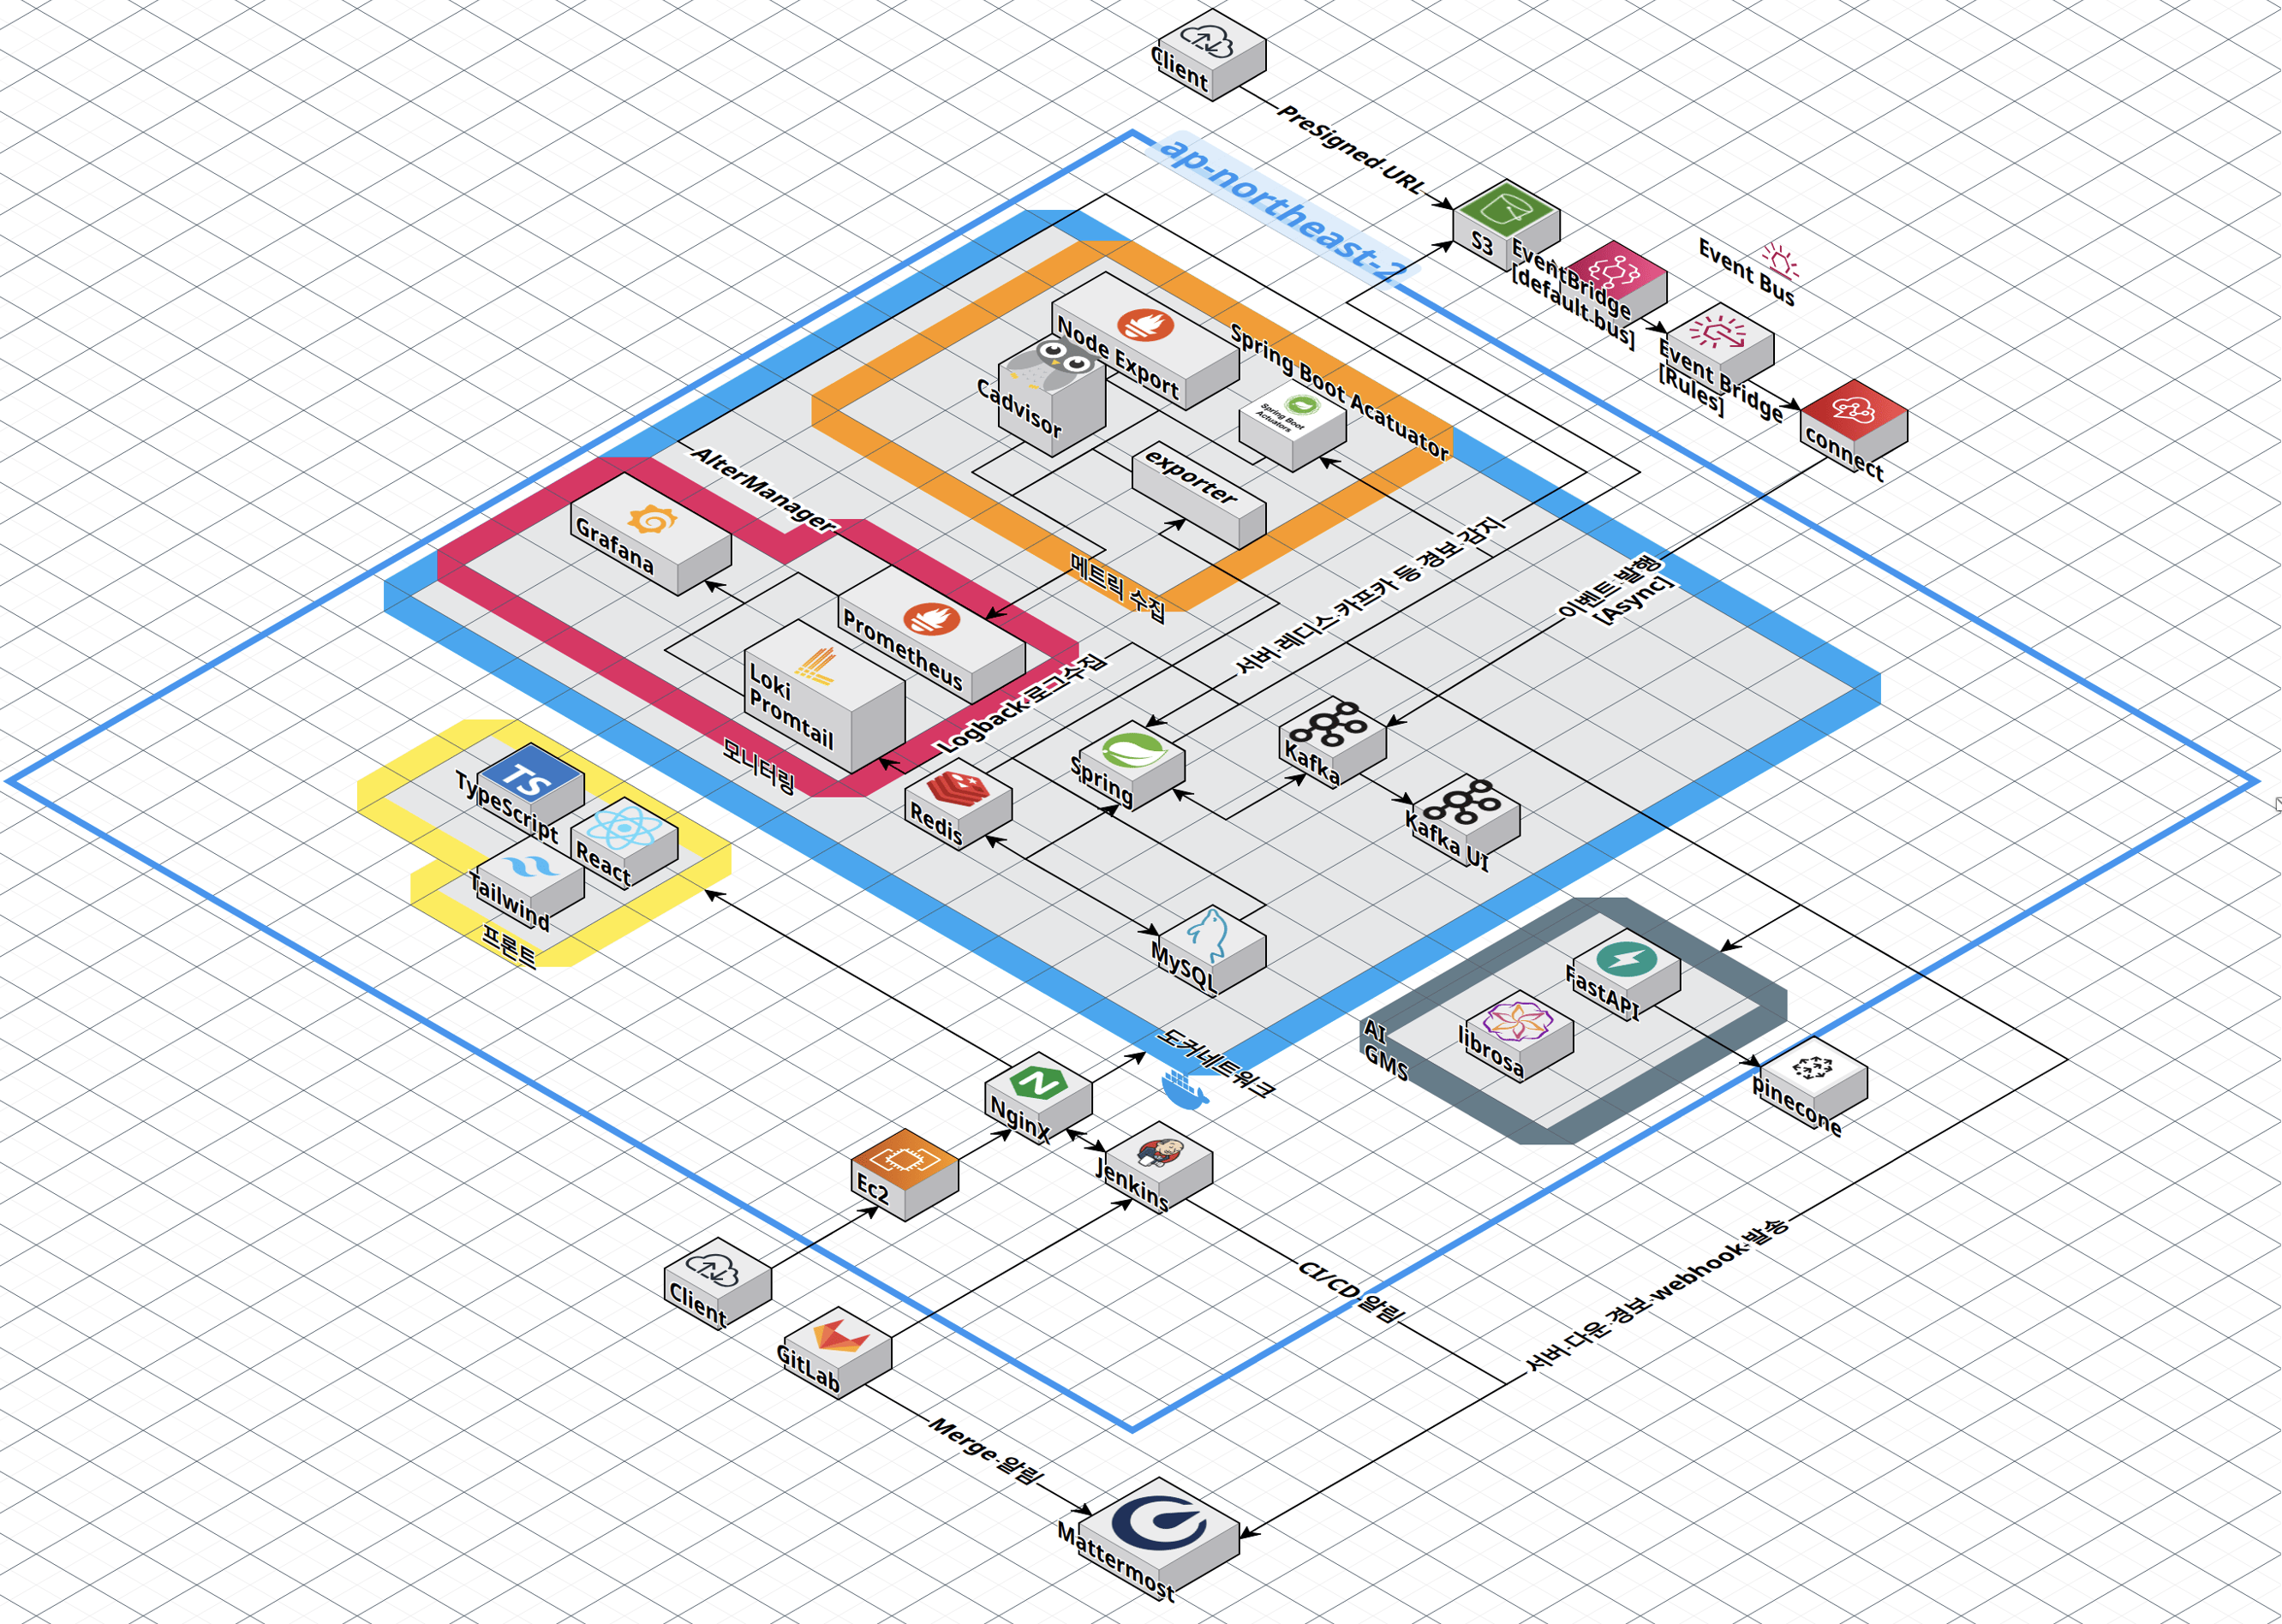
기술 스택: Java, Spring Boot, Kafka, AWS S3, Prometheus, Grafana, Loki, Docker
내 역할
백엔드(33%) + 인프라(50%)를 담당했습니다.
파일 업로드 시스템, 앨범/녹음 관리, 그리고 모니터링 인프라 전체를 맡았습니다.
이 프로젝트에서 처음으로 이벤트 드리븐 아키텍처와 모니터링 시스템을 실무 수준으로 구축해봤습니다.
주요 구현
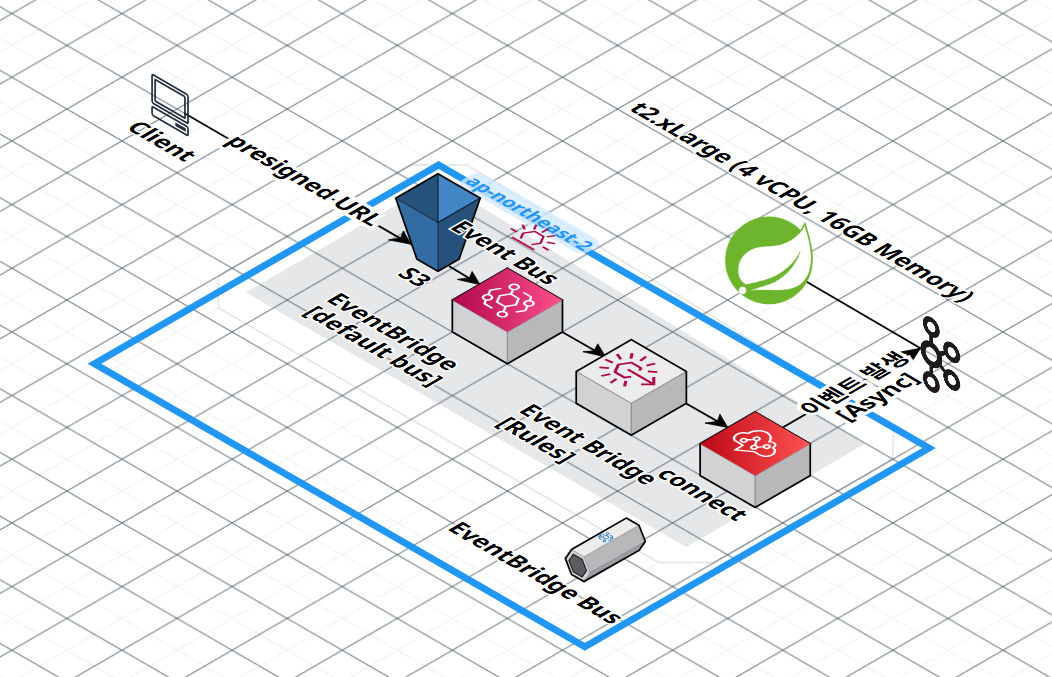
파일 업로드 시스템 (Presigned URL + EventBridge)
서버를 경유해서 파일을 올리면 100MB 파일 기준으로 서버 메모리를 점유하고 대역폭을 2배 소모합니다.
Presigned URL로 클라이언트가 S3에 직접 업로드하게 해서 서버 부하를 제거했습니다.
S3 이벤트를 EventBridge를 통해 Kafka로 전달하는 이벤트 드리븐 파이프라인을 설계했고, 12단계 상태 머신으로 파일이 어디서 실패했는지 즉시 파악할 수 있게 했습니다.
상세 분석: Presigned URL + EventBridge 업로드 · Kafka 이벤트 드리븐 파이프라인
GPU OOM 3단계 방어 전략
음성 분석 모델 하나당 GPU 메모리 2-3GB를 사용하는데, 8GB GPU에서 3개 이상 동시 실행하면 OOM이 발생합니다.
3중 방어를 적용했습니다:
- Kafka 큐로 요청 버퍼링 (AI 서버가 pull 방식으로 처리)
Semaphore(permits=2)로 동시 실행 제한- 파일 100MB 제한으로 단일 요청 메모리 상한
3주 운영 기간 동안(일 평균 약 30-50건 업로드 처리 기준) OOM 0회를 달성했습니다.
상세 분석: GPU OOM 방어 전략
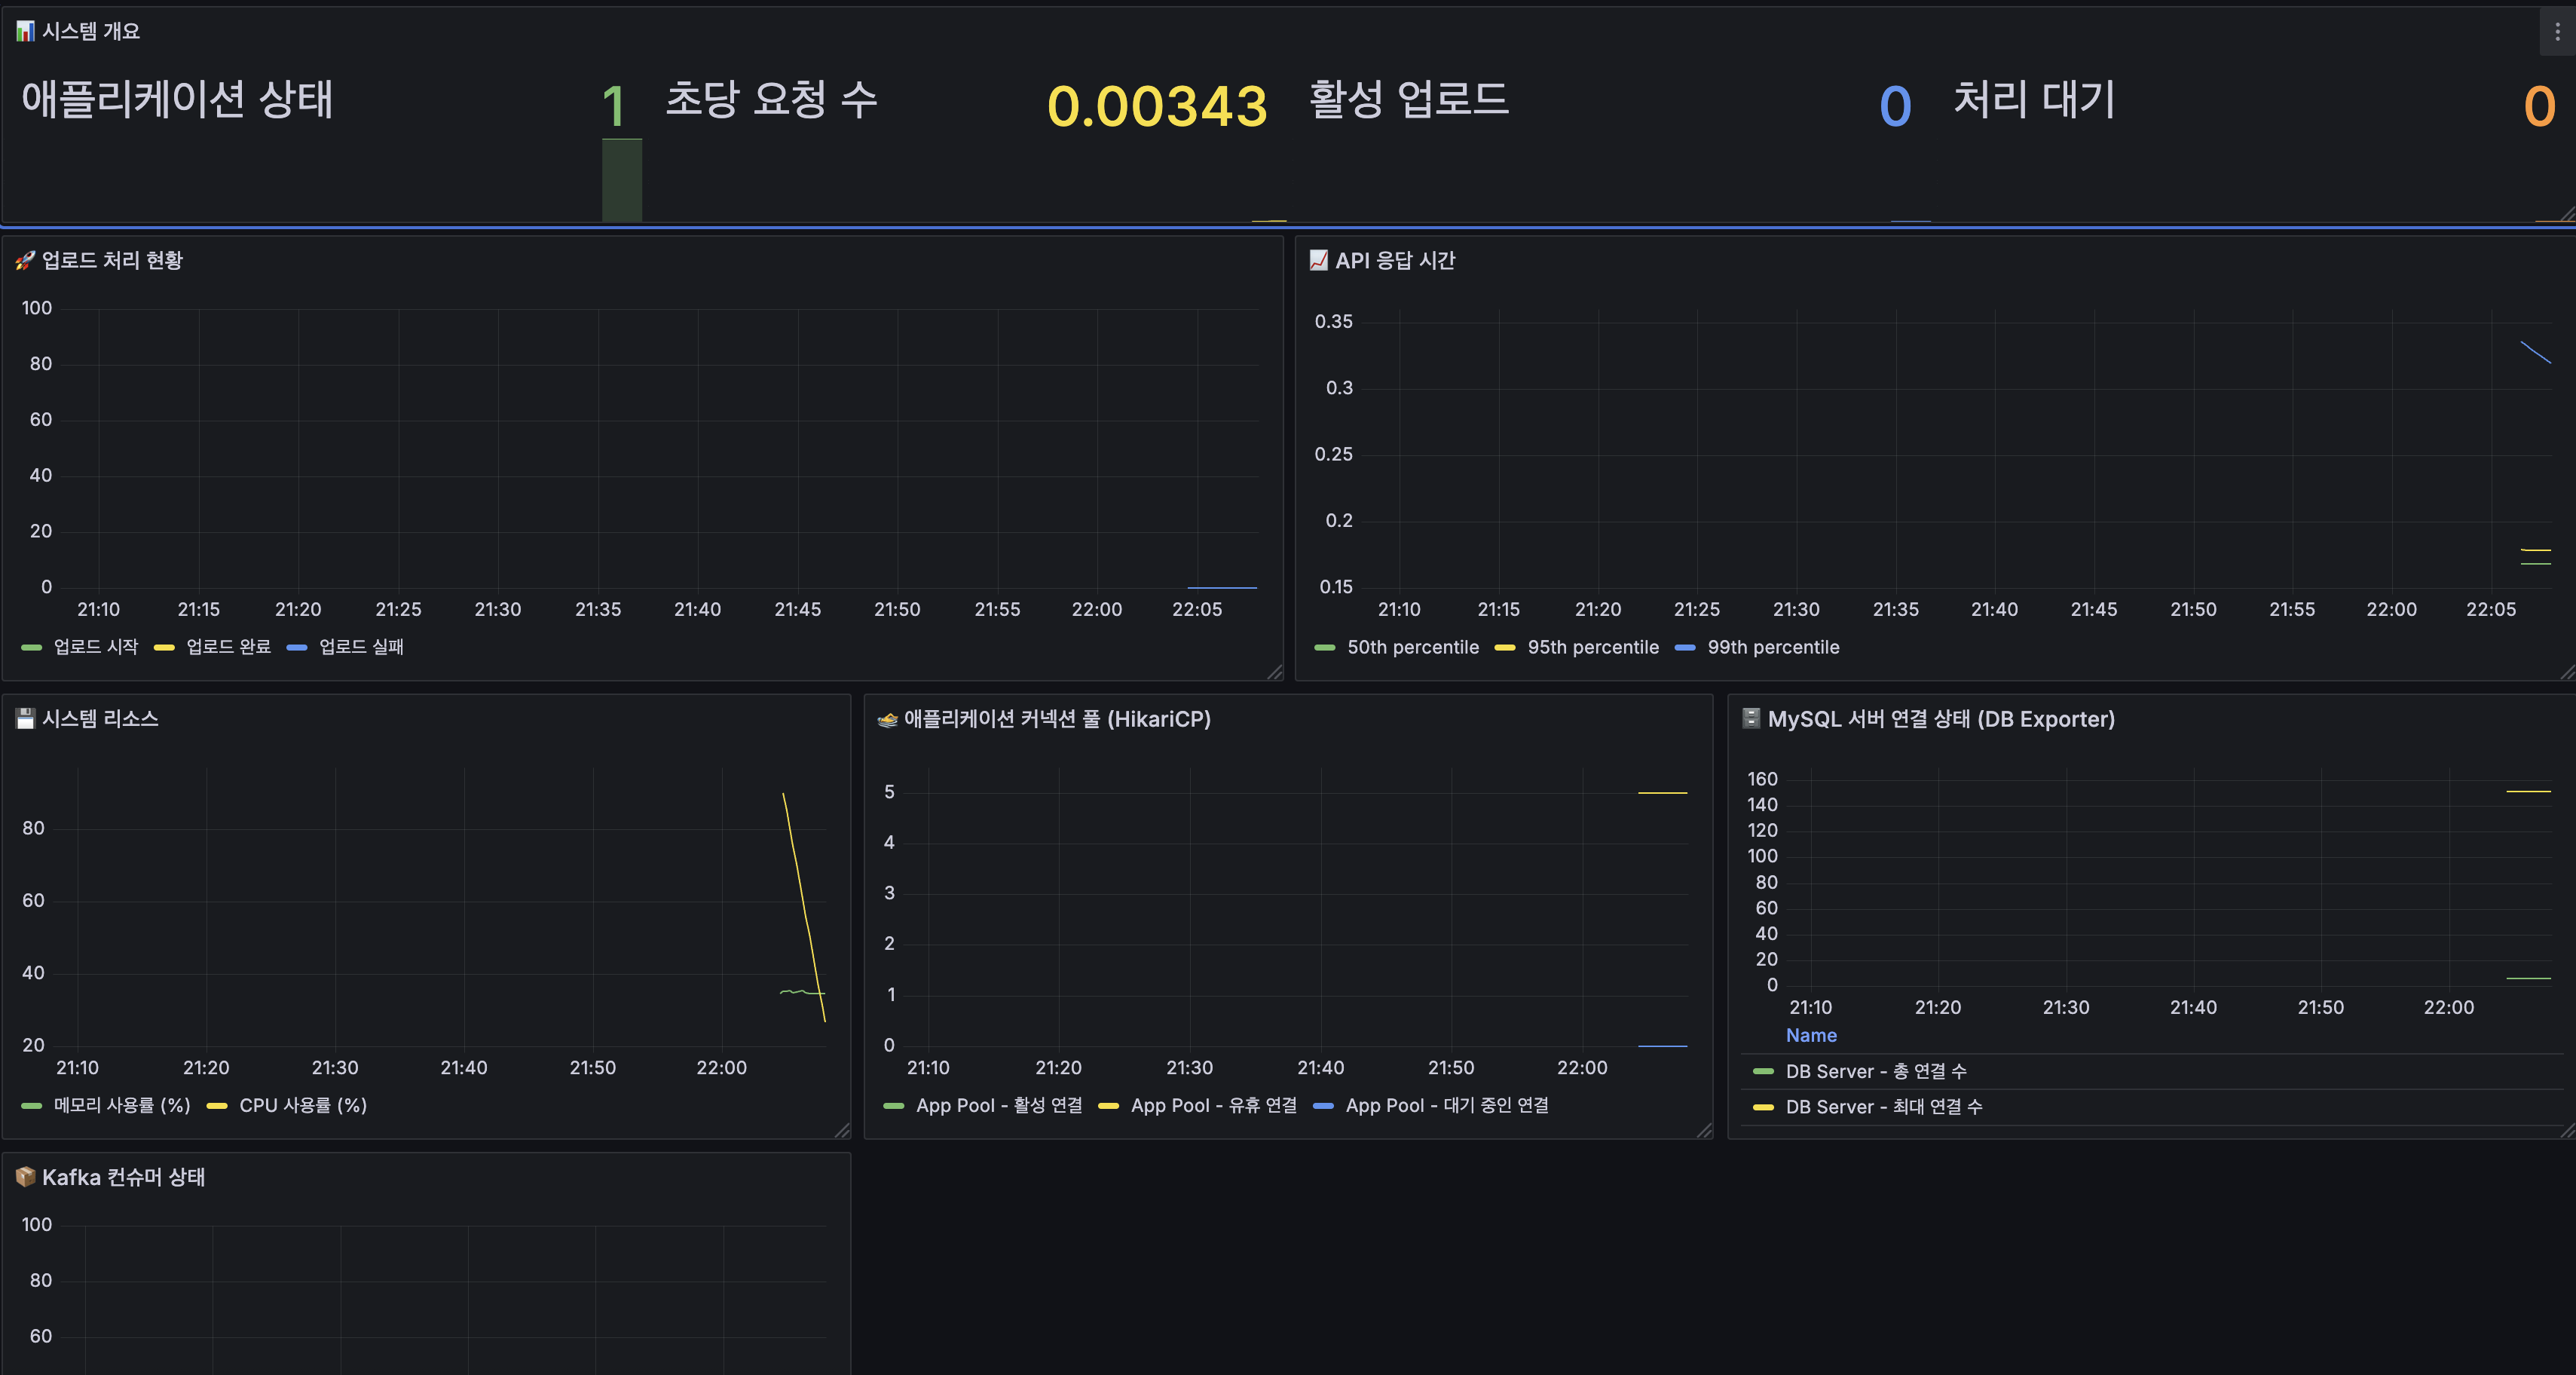
모니터링 인프라 (Prometheus + Grafana + Loki)
장애가 발생한 후 로그를 grep하면 MTTR(복구 시간)이 길어집니다.
선제적 모니터링으로 장애 징후를 미리 감지하고 싶었습니다.
Prometheus 6개 Exporter, Grafana 대시보드, Loki JSON 로그, 29개 Alert 규칙을 구축했습니다. Alertmanager의 for절(Critical 1분, Warning 5분) + group_wait(Critical 10초) 기반으로, Critical 장애 발생 후 ~85초 이내(scrape 15s + for 1m + group_wait 10s)에 Mattermost로 알림이 도달하는 구조를 만들었습니다. 수동 확인(수분~수시간)에서 자동 감지로 전환한 것이 핵심입니다.
상세 분석: Prometheus+Grafana+Loki 모니터링
기억에 남는 트러블슈팅
Prometheus 알림 폭풍
서버를 재시작하면 메트릭이 일시적으로 0이 되면서 수백 건의 Mattermost 알림이 동시에 쏟아졌습니다.
진짜 장애와 일시적 스파이크를 구분할 수 없으니 알림 피로(Alert Fatigue)가 심각했습니다.
for절로 지속 시간 필터링(Critical 1분, Warning 5분)을 적용하고, inhibit_rules로 상위 알림 발생 시 하위 알림을 억제했습니다.
알림 노이즈가 일 50건에서 5건으로 90% 감소했습니다.
상세 분석: 알림 폭풍 해결
Loki 스택트레이스 파싱 실패
Promtail이 줄 단위로 로그를 파싱해서 Exception 스택트레이스가 10~20개 별도 로그로 분리되는 문제가 있었습니다.
Grafana에서 “NullPointerException”을 검색해도 첫 줄만 나오고 원인 코드는 찾을 수 없었습니다.
Log4j2 JSON 포맷으로 변경해서 스택트레이스를 단일 필드에 포함시키고, traceId로 요청 추적이 가능하게 만들었습니다.
상세 분석: Loki 스택트레이스 파싱
Kafka 파티션 불균형
userId 기반 파티셔닝을 적용했더니 헤비 유저의 이벤트가 한 파티션에 집중돼서, 3개 파티션 중 1개가 전체 메시지의 70%를 처리하고 나머지 2개는 놀고 있었습니다.
uploadId 기반 파티셔닝으로 변경하니 같은 파일의 이벤트만 같은 파티션에서 순서가 보장되고, 서로 다른 파일은 균등 분산됐습니다.
편차가 10배에서 1.2배로 개선됐습니다.
상세 분석: Kafka 파티션 불균형
느낀 점
장애는 예방보다 복구가 중요하다
파일 업로드 파이프라인에서 “Stuck 파일”(처리가 멈춘 파일)이 일 10-20건 발생했습니다. 이건 Kafka consumer 에러 로그와 DB의 PROCESSING 상태가 30분 이상 유지되는 건을 조회해서 확인한 수치입니다.
모든 예외 상황을 방어하려 했더니 방어 로직이 복잡해져서 오히려 새 버그가 생겼습니다.
12단계 상태 머신과 DLQ 패턴으로 “장애는 발생한다, 대신 빨리 복구한다”는 방향으로 전환하니 Stuck 파일이 0건이 됐습니다. (DLQ 이동 후 Mattermost 알림으로 수동 확인하는 방식이라, 30분 이상 PROCESSING 유지 건이 사라진 것입니다.)
문서화의 적정선
1주차에 Swagger로 완벽한 API 문서를 만들었지만, 개발하면서 API가 계속 바뀌면서 “문서랑 다른데요?” 피드백이 끊이지 않았습니다.
2주차부터 플로우차트로 전체 흐름만 먼저 공유하고 세부 스펙은 구현하면서 맞춰가니, “다음에 뭐 해요?” 류의 질문이 거의 사라졌습니다.
About the Project
Orakgarak is a platform that recommends songs based on your voice data. The “What should I sing?” dilemma at karaoke — 5 out of 6 team members had the same experience. Typical music recommendations are based on listening history, but the songs you like and the songs you can actually sing well are different. Users sing a song, and AI analyzes their vocal range and timbre to recommend popular songs in a similar range.
Duration: Aug 26 – Sep 30, 2025 (5 weeks)
Team: 6 members (2 Frontend, 3 Backend, 1 AI)
Tech Stack: Java, Spring Boot, Kafka, AWS S3, Prometheus, Grafana, Loki, Docker
My Role
I was responsible for backend (33%) + infrastructure (50%). I owned the file upload system, album/recording management, and the entire monitoring infrastructure.
This project was my first time building event-driven architecture and a monitoring system at a production-grade level.
Key Implementations
File Upload System (Presigned URL + EventBridge)
Routing files through the server means a 100MB file consumes server memory and doubles bandwidth usage. Using Presigned URLs, the client uploads directly to S3, eliminating server load. I designed an event-driven pipeline where S3 events flow through EventBridge to Kafka, with a 12-step state machine that makes it immediately clear where a file failed.
Detailed analysis: Presigned URL + EventBridge Upload · Kafka Event-Driven Pipeline
GPU OOM 3-Layer Defense Strategy
Each voice analysis model uses 2–3GB of GPU memory, and running 3+ concurrently on an 8GB GPU causes OOM. I applied 3 layers of defense:
- Kafka queue to buffer requests (AI server pulls at its own pace)
Semaphore(permits=2)to limit concurrent execution- 100MB file size limit to cap single-request memory
Achieved zero OOM incidents over 3 weeks of operation (averaging 30-50 uploads processed per day).
Detailed analysis: GPU OOM Defense Strategy
Monitoring Infrastructure (Prometheus + Grafana + Loki)
Grepping logs after an incident extends MTTR (Mean Time To Recovery). I wanted proactive monitoring to detect failure signals before they escalate. I built 6 Prometheus exporters, Grafana dashboards, Loki JSON logging, and 29 alert rules. With Alertmanager’s for clause (Critical 1min, Warning 5min) + group_wait (Critical 10s), Critical alerts reach Mattermost within ~85 seconds (scrape 15s + for 1m + group_wait 10s) after incident. The key improvement was transitioning from manual detection (minutes to hours) to automated alerting.
Detailed analysis: Prometheus + Grafana + Loki Monitoring
Memorable Troubleshooting
Prometheus Alert Storm
Whenever the server restarted, metrics would temporarily drop to zero, flooding hundreds of Mattermost alerts simultaneously. It was impossible to distinguish real incidents from transient spikes, causing severe alert fatigue.
I applied for clause duration filtering (Critical 1min, Warning 5min) and inhibit_rules to suppress child alerts when parent alerts fire. Alert noise dropped 90%, from 50 per day to 5.
Detailed analysis: Alert Storm Resolution
Loki Stack Trace Parsing Failure
Promtail parsed logs line by line, splitting Exception stack traces into 10–20 separate log entries. Searching “NullPointerException” in Grafana only returned the first line — you couldn’t find the root cause code.
I switched to Log4j2 JSON format to embed stack traces in a single field, and enabled request tracing via traceId.
Detailed analysis: Loki Stack Trace Parsing
Kafka Partition Imbalance
With userId-based partitioning, heavy users’ events concentrated on a single partition — 1 of 3 partitions handled 70% of all messages while the other 2 sat idle.
Switching to uploadId-based partitioning ensured only events for the same file are ordered within the same partition, while different files are evenly distributed. Partition deviation improved from 10x to 1.2x.
Detailed analysis: Kafka Partition Imbalance
Takeaways
Recovery Matters More Than Prevention
The file upload pipeline had 10–20 “stuck files” (files that stopped processing) per day — measured by querying DB records stuck in PROCESSING state for over 30 minutes, cross-referenced with Kafka consumer error logs. Trying to defend against every edge case made the defensive logic so complex that it introduced new bugs. Switching to a 12-step state machine and DLQ pattern with the philosophy “failures will happen — just recover quickly” brought stuck files down to zero. (Files beyond max retries move to DLQ with Mattermost alerts for manual review, eliminating the 30min+ PROCESSING state entirely.)
Finding the Right Level of Documentation
In week 1, I created perfect Swagger API documentation, but APIs kept changing during development, and “this doesn’t match the docs” feedback never stopped. From week 2, I shared only the overall flow via flowcharts first and aligned on detailed specs during implementation. Questions like “What do I do next?” nearly disappeared.

댓글
댓글 수정/삭제는 GitHub Discussions에서 가능합니다.