JVM과 Garbage Collection 이해하기

목차
0. 이 글의 위치
이 시리즈는 JVM 메모리를 1차 소스(Oracle JDK docs, OpenJDK JEP, Linux kernel docs) 기준으로 정리한 6편입니다. 지금 읽는 0편은 JVM 자체가 어떻게 생겼는지를 훑는 아키텍처 개론입니다. Heap 내부 구조(Young/Old/Eden), GC 알고리즘(G1/ZGC/Shenandoah), Off-heap, OS Page Cache 같은 주제는 ①~⑤편으로 각각 독립 편성했으니 여기서는 반복하지 않고 링크로만 연결하겠습니다.
따라서 이 글의 목표는 딱 이것입니다:
- JVM이
.class파일을 메모리에 어떻게 얹고(Class Loader) - 프로그램 실행 중 어떤 메모리 영역을 쓰고(Runtime Data Areas)
- 바이트코드를 어떻게 기계어로 바꿔서 돌리는지(Execution Engine, JIT)
- 객체는 Heap 안에서 어떻게 배치되는지(Object Layout)
이 전반을 “한 그림”으로 잡아두는 것입니다.
1. JVM 아키텍처 개요
JVM(Java Virtual Machine)은 Java 바이트코드를 실행하는 가상 머신입니다. “Write Once, Run Anywhere”를 가능하게 하는 핵심 컴포넌트입니다.
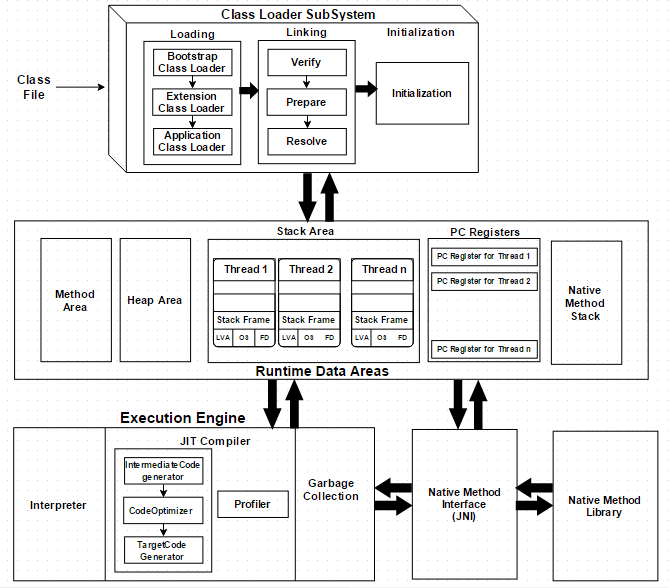
크게 세 개의 서브시스템으로 나눠서 볼 수 있습니다.
- Class Loader Subsystem:
.class파일을 읽어 메모리에 얹고 링크하는 역할 - Runtime Data Areas: 실행 중에 쓰는 메모리 (Method Area, Heap, Stack, PC Register, Native Method Stack)
- Execution Engine: 바이트코드를 해석(Interpreter)하거나 네이티브로 컴파일(JIT)해서 실행
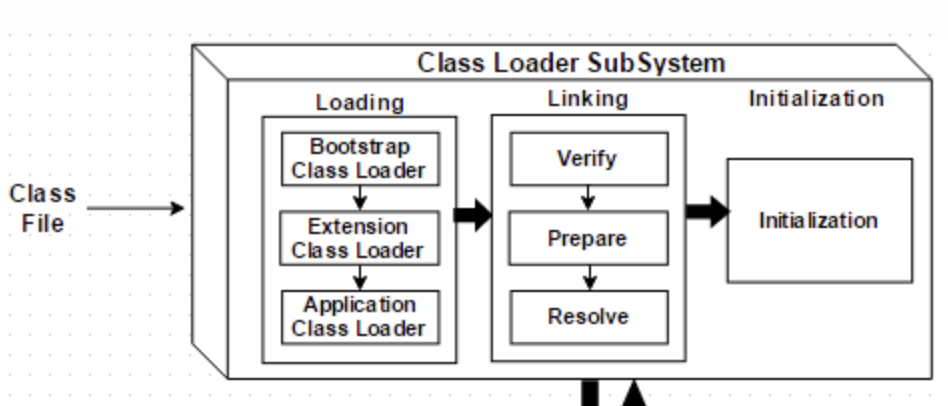
2. Class Loader Subsystem
2.1 3단계 Class Loader 계층 (JDK 9+)
Java 9 모듈 시스템 도입 이후 built-in class loader가 다음 3개로 재정의됐습니다. Extension class loader가 Platform class loader로 교체된 게 핵심 변화입니다.
| 계층 | 이름 | 역할 |
|---|---|---|
| 1 | Bootstrap | JDK 내부 핵심 클래스(java.lang.* 등) 로딩. 부모 없음 (null). |
| 2 | Platform (JDK 9+) | Java SE Platform API와 JDK 런타임 클래스 로딩 (구 Extension 대체) |
| 3 | Application (System) | 애플리케이션 classpath/모듈 path의 클래스 로딩 |
System.out.println(String.class.getClassLoader()); // null (Bootstrap)System.out.println(javax.sql.DataSource.class.getClassLoader()); // PlatformClassLoaderSystem.out.println(MyClass.class.getClassLoader()); // AppClassLoader2.2 Parent Delegation Model
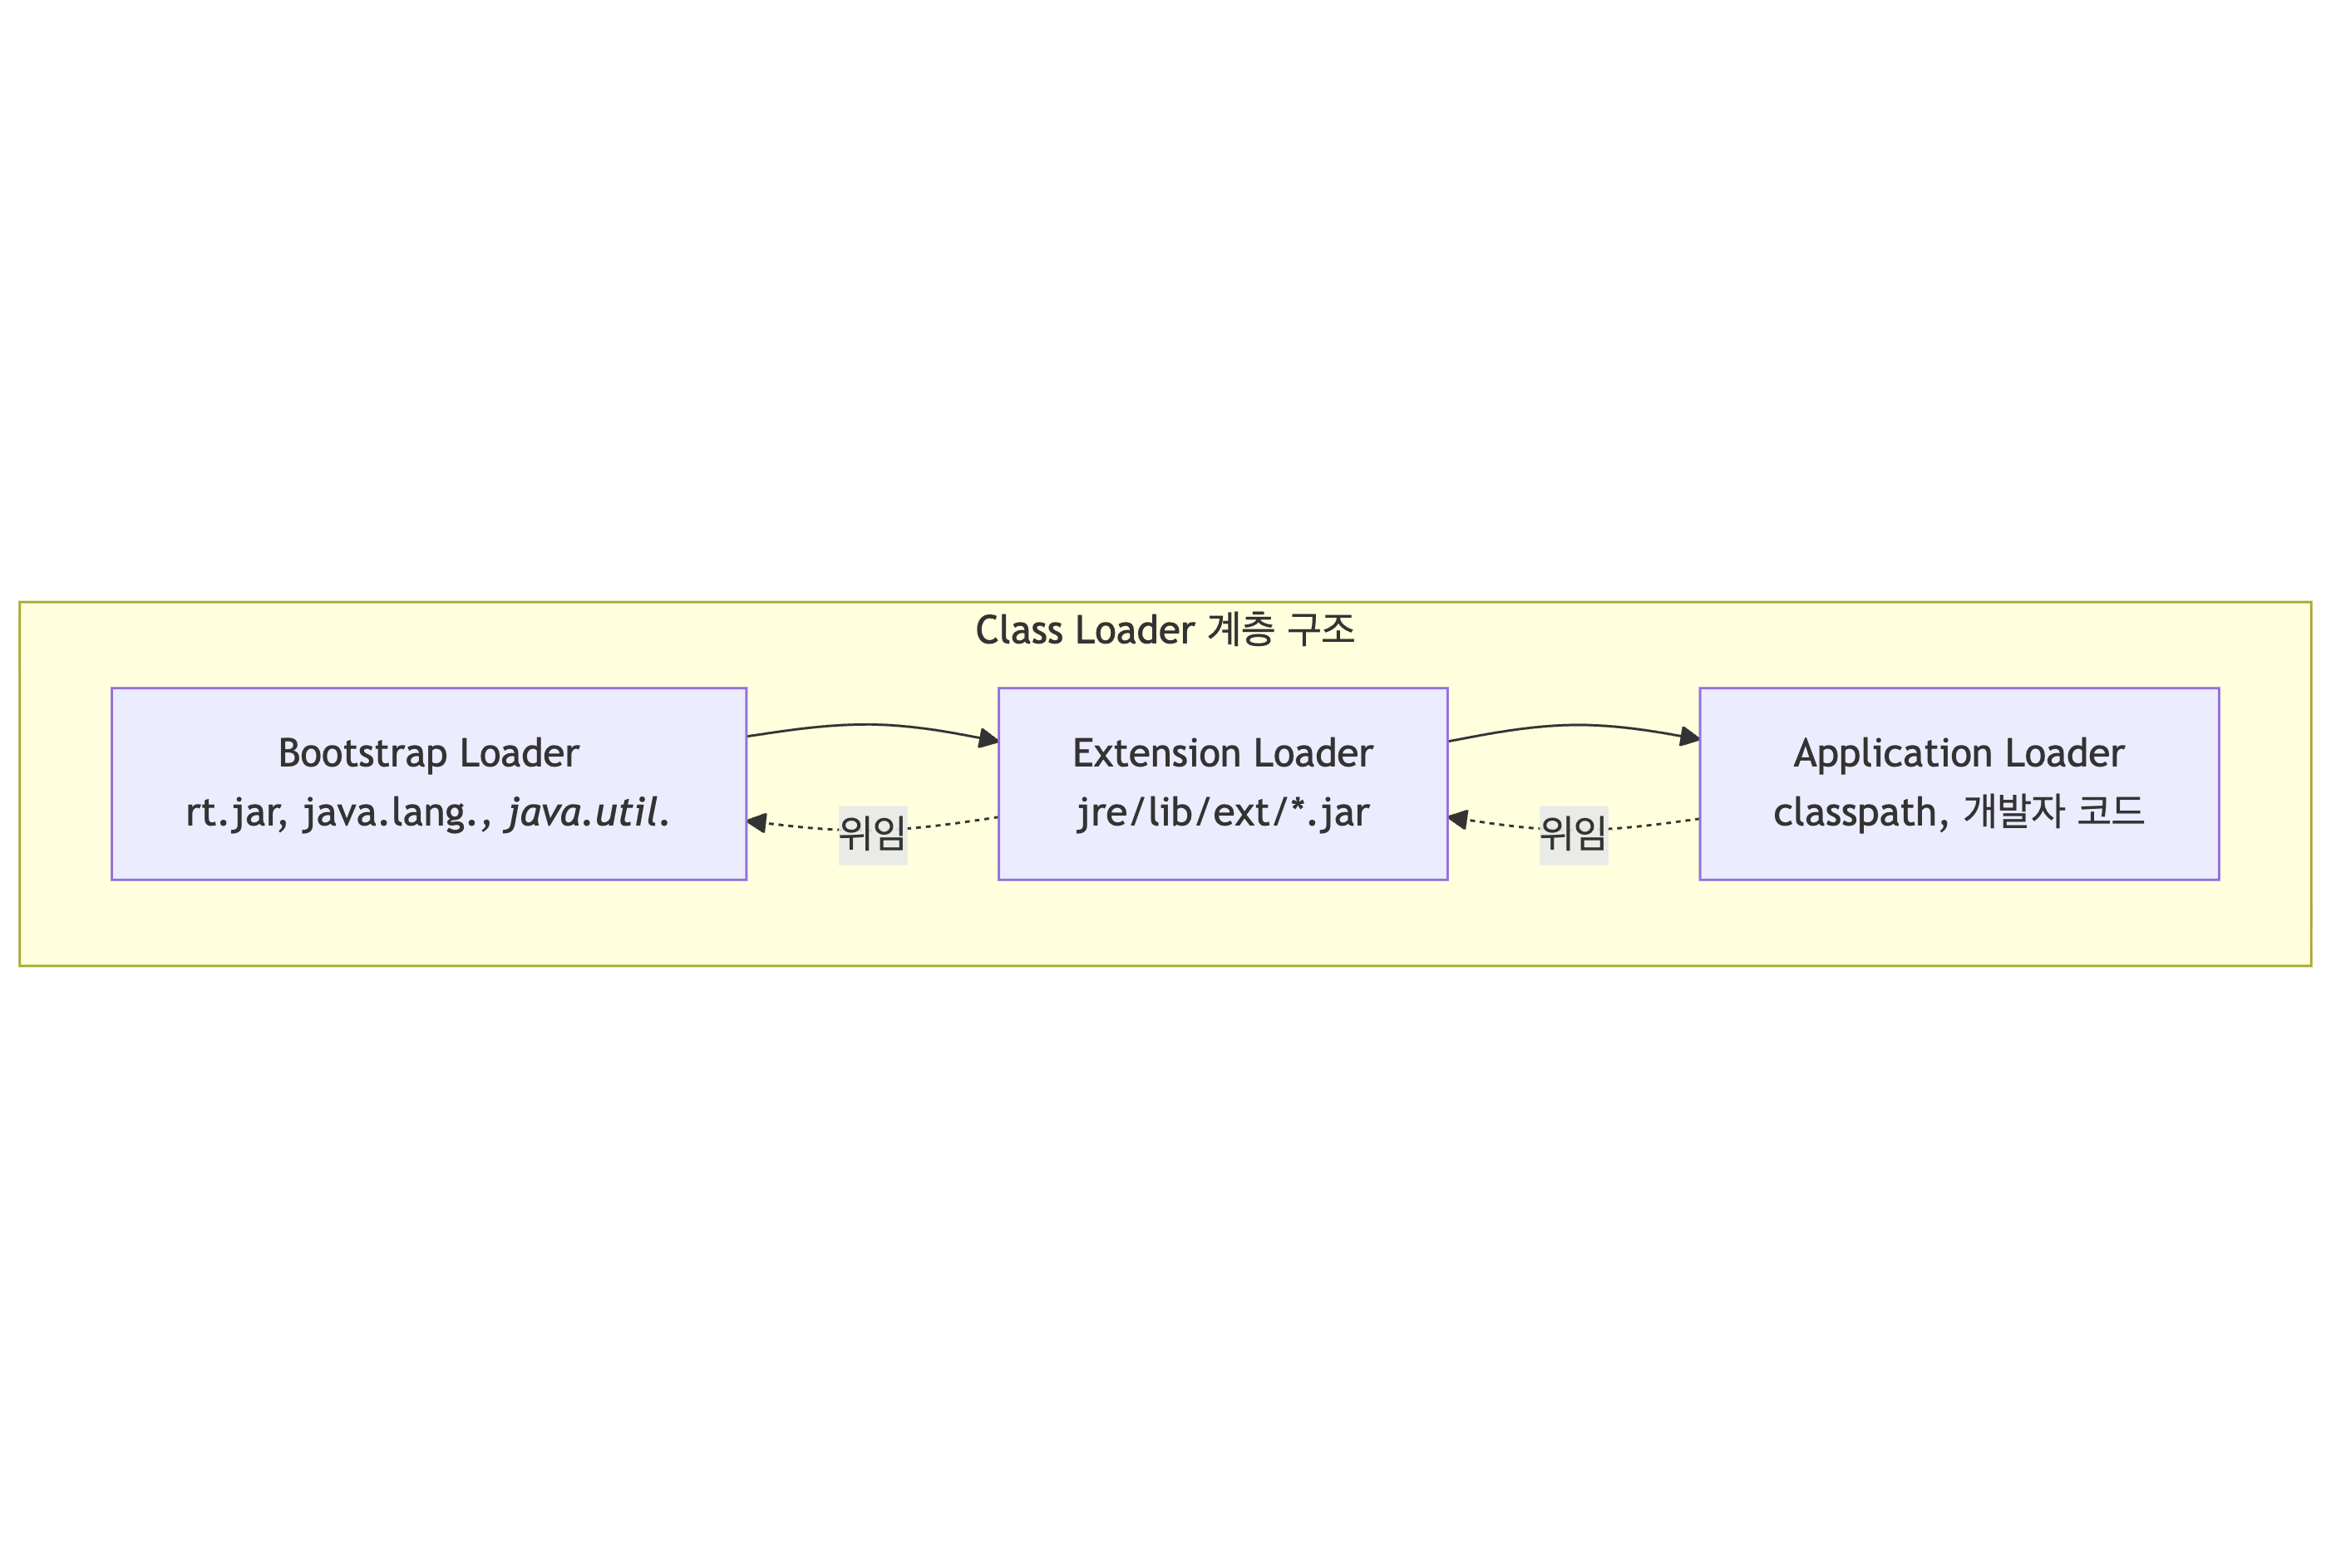
동작 방식:
- 클래스 로드 요청이 들어오면 부모에게 먼저 위임
- 부모가 찾지 못하면 자신이 로드 시도
- 어디서도 못 찾으면
ClassNotFoundException
왜 이렇게 하나?
- 보안: 악의적인
java.lang.String로드 방지 (언제나 Bootstrap이 먼저 집어감) - 일관성: 핵심 클래스는 항상 같은 버전이 쓰이도록 보장
2.3 Loading → Linking → Initialization
Loading: .class 바이트 읽어서 Method Area에 클래스 구조 생성.
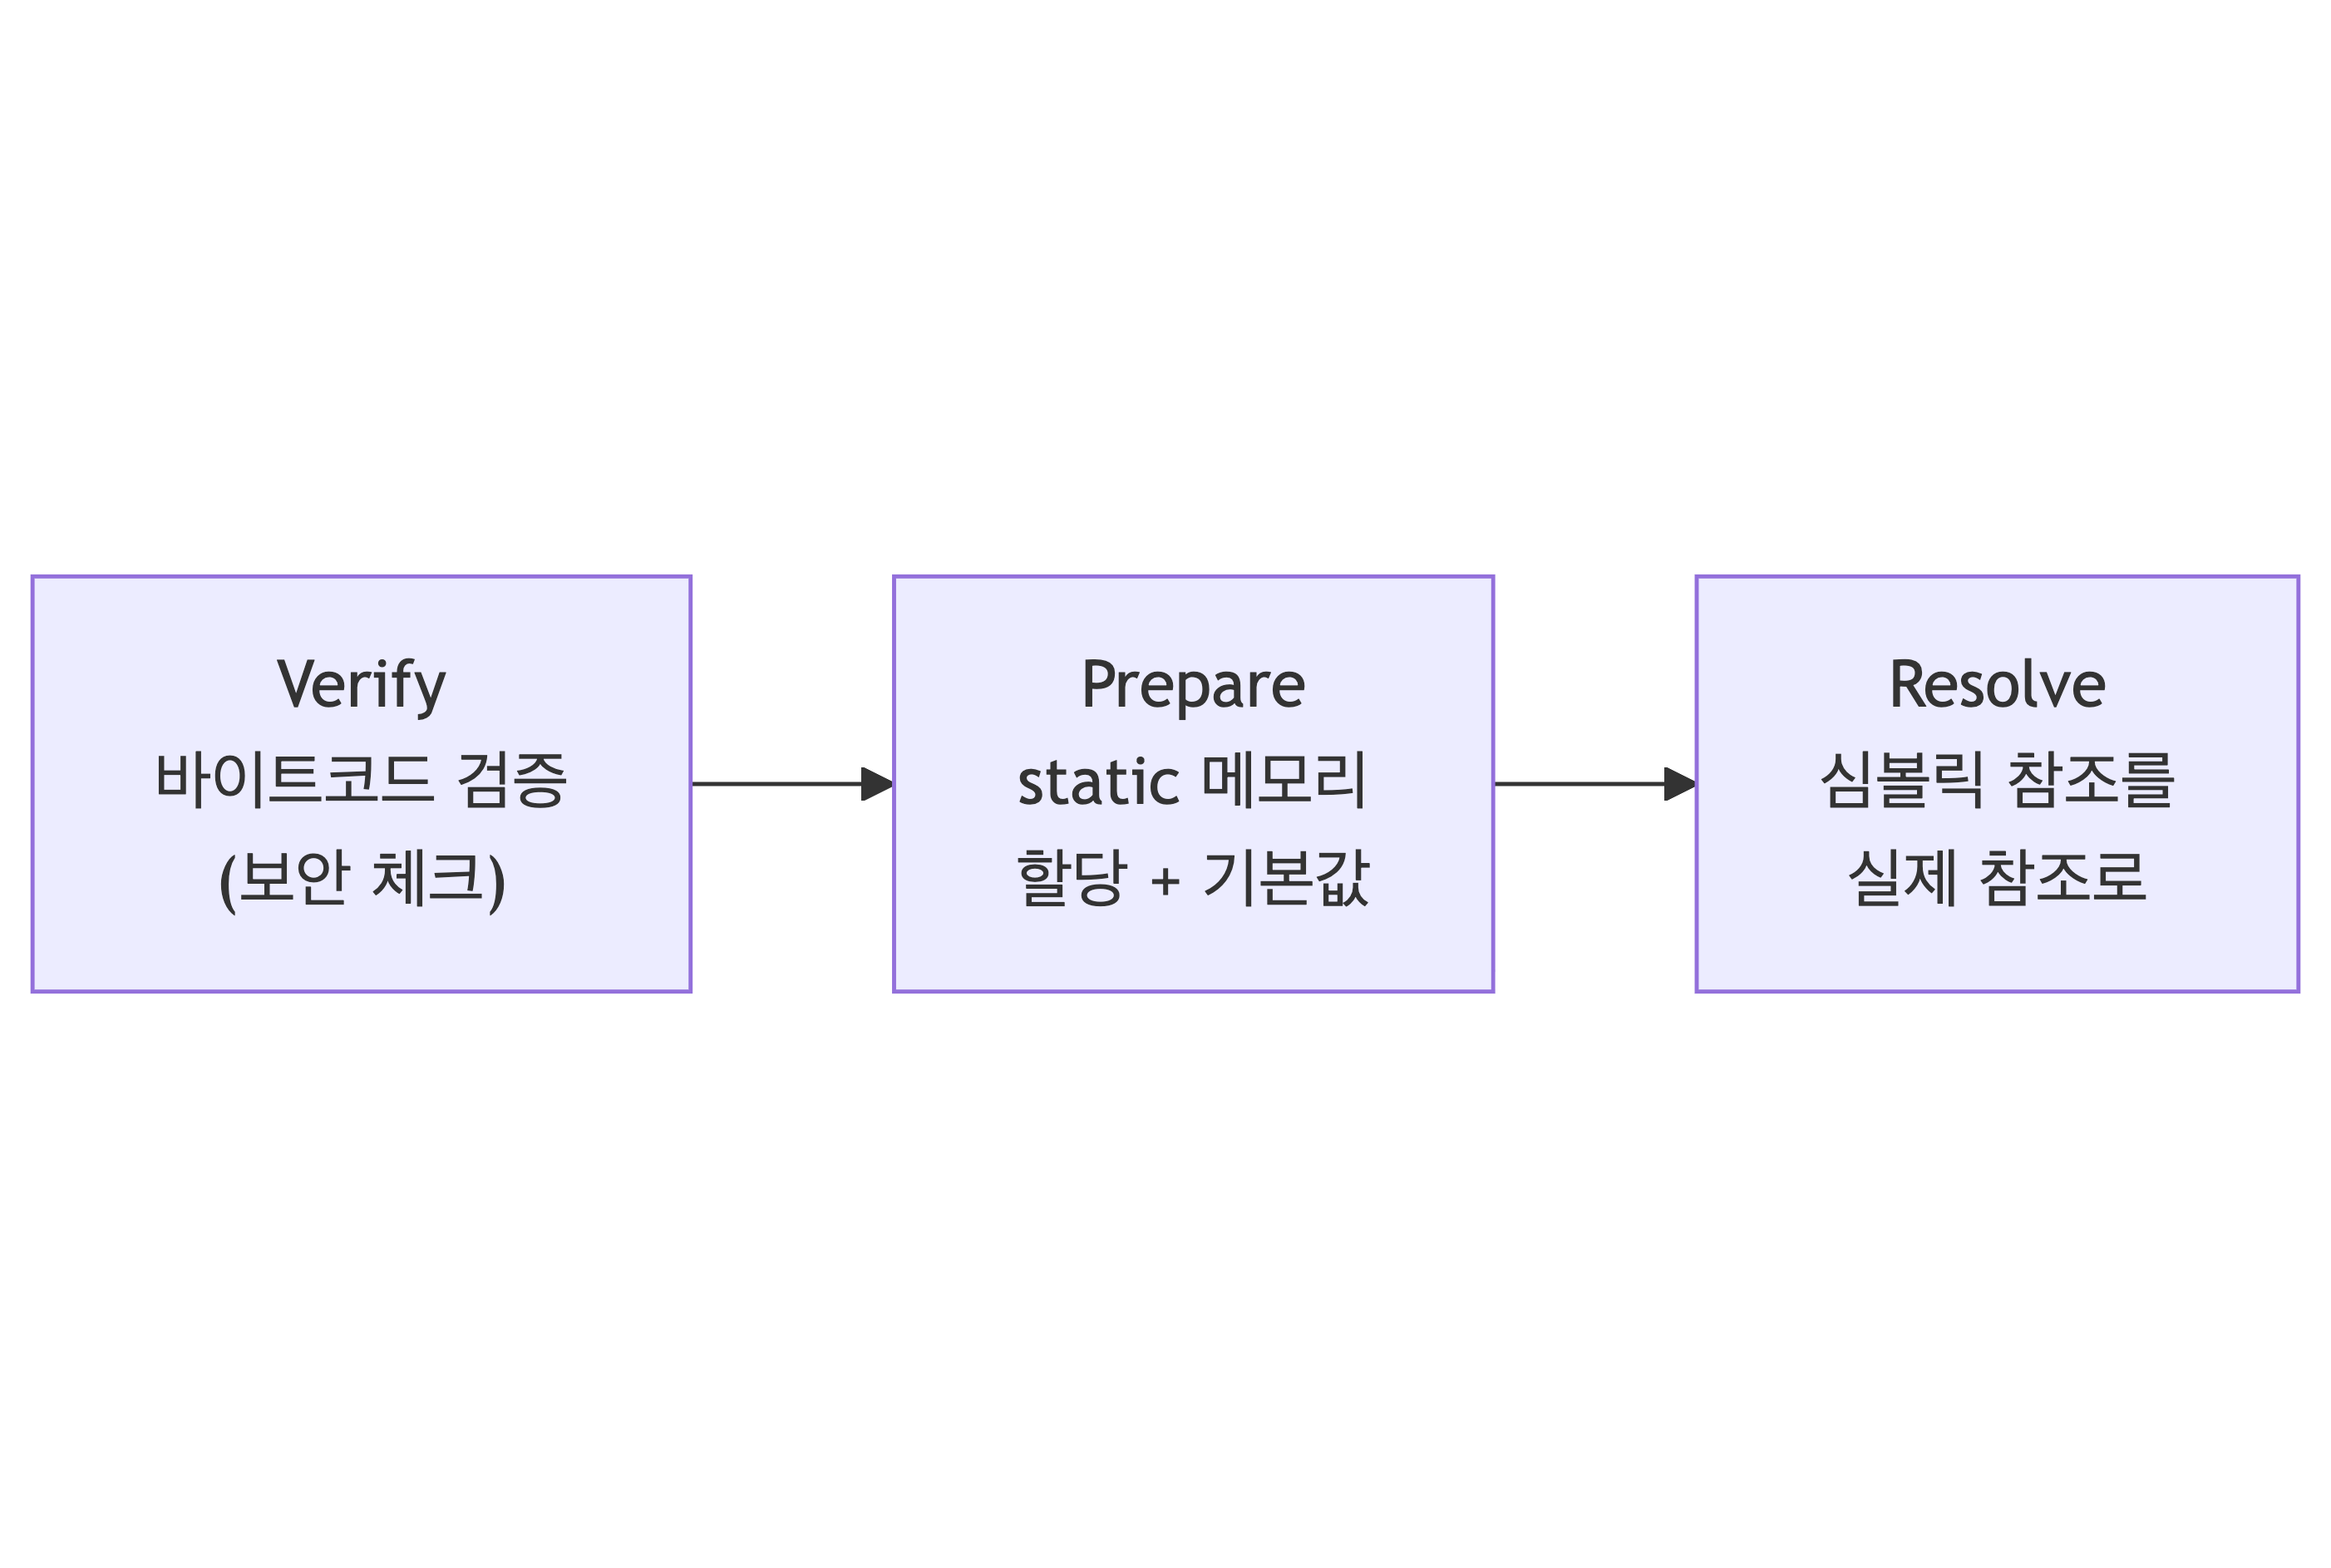
Linking (3단계)
- Verify: 바이트코드가 JVM 명세에 맞는지 검증 (보안·타입 안전성 체크)
- Prepare: static 변수 메모리 할당, 기본값 초기화 (
0,null,false등) - Resolve: 심볼릭 참조 → 실제 메모리 주소 (lazy하게 수행될 수 있음)
Initialization
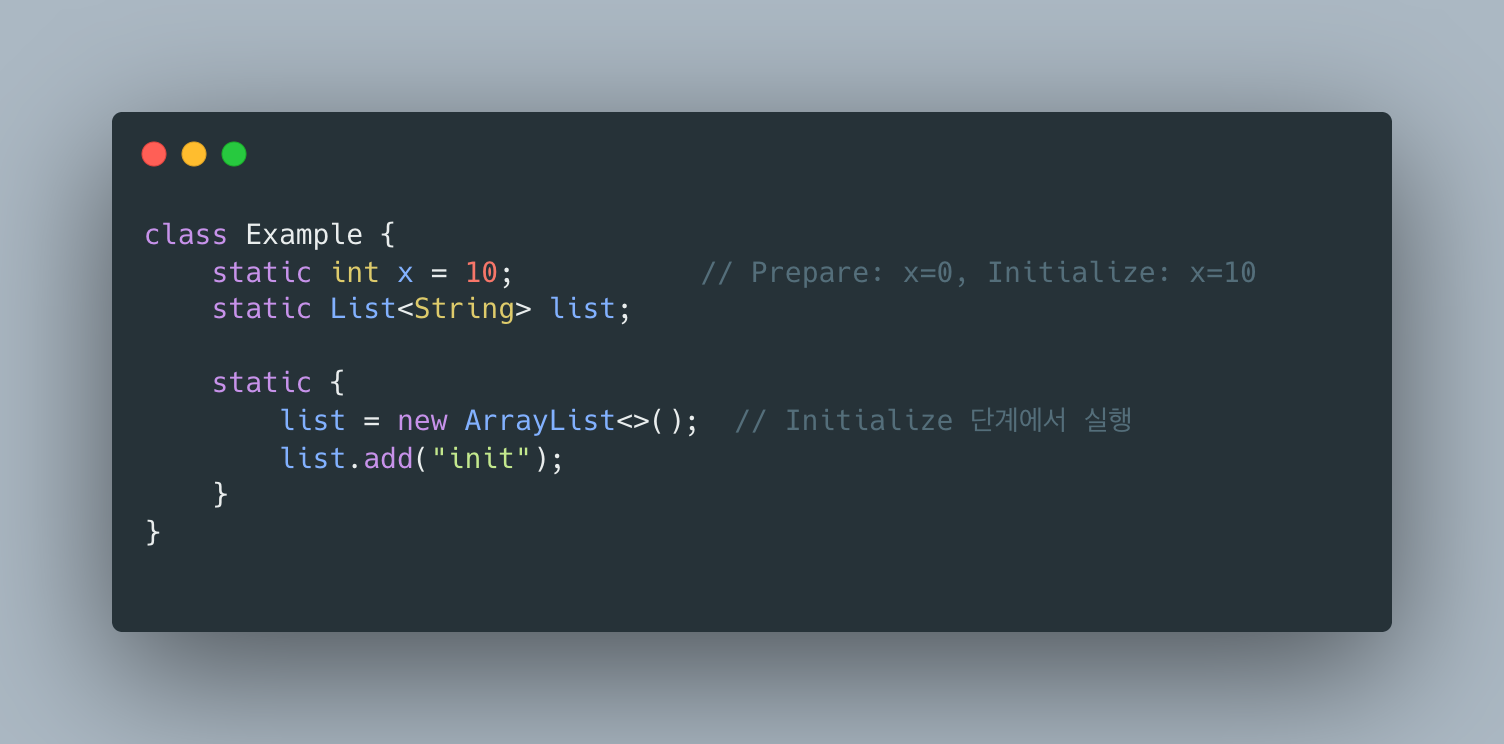
static 변수에 실제 값 할당, static {} 블록 실행. 이 시점부터 클래스가 “사용 가능” 상태가 됩니다.
3. Runtime Data Areas
JVM이 프로그램 실행 중 사용하는 메모리 영역들입니다.
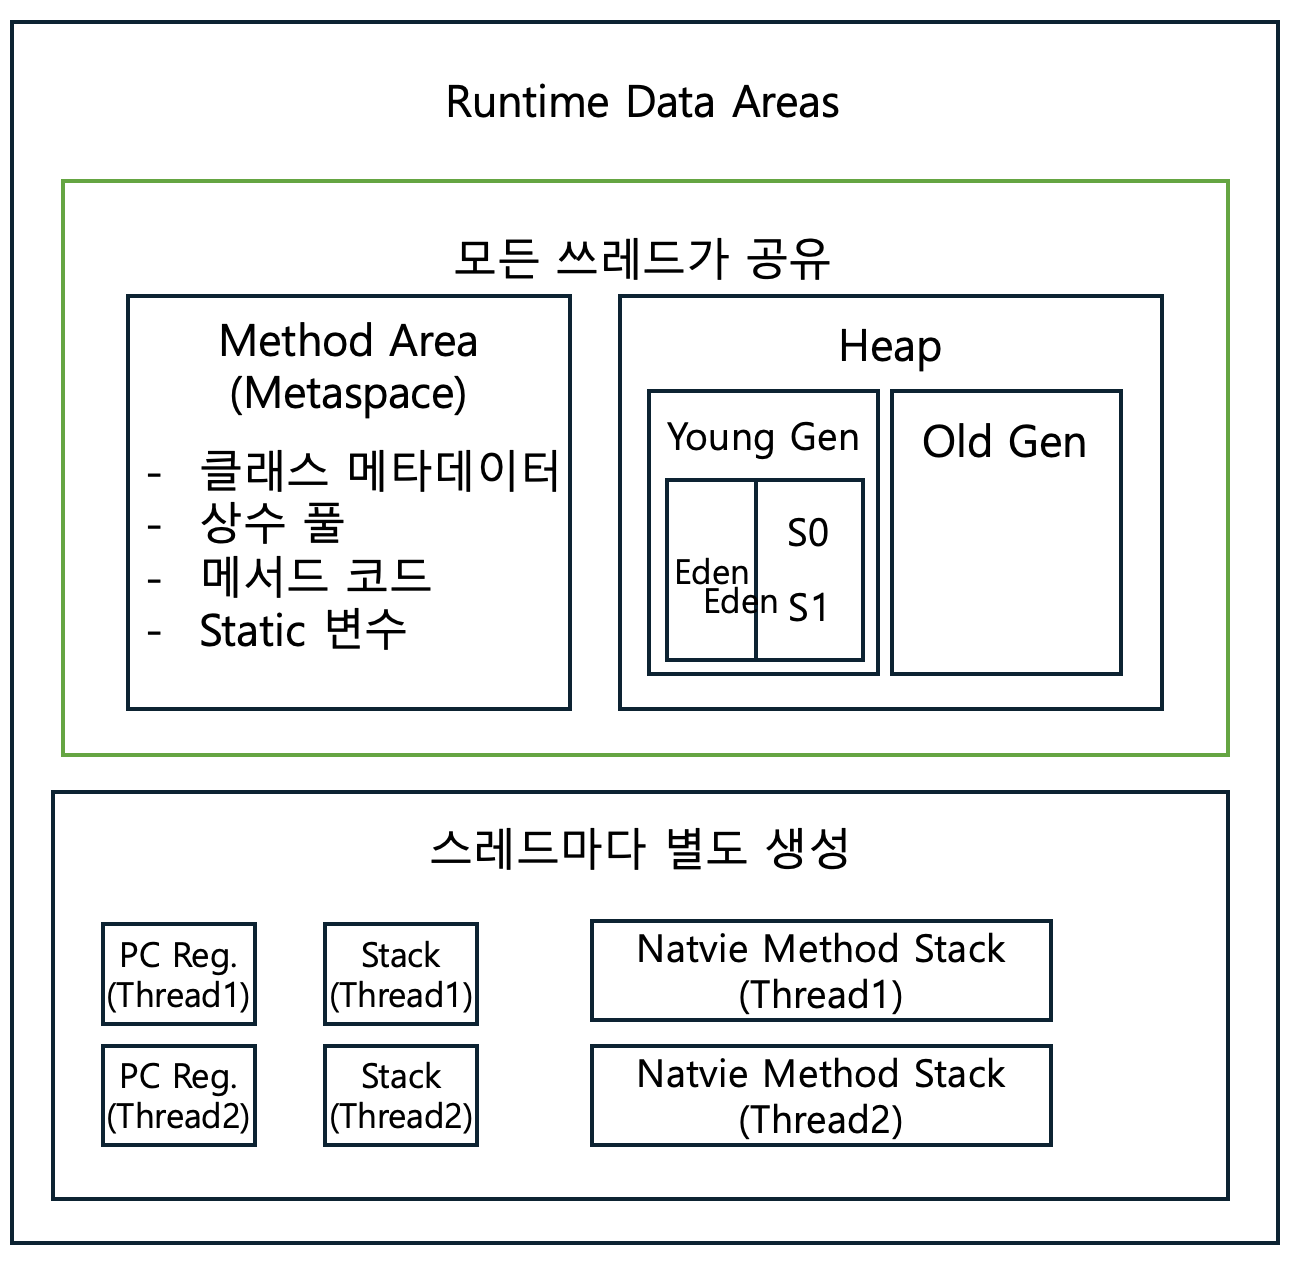
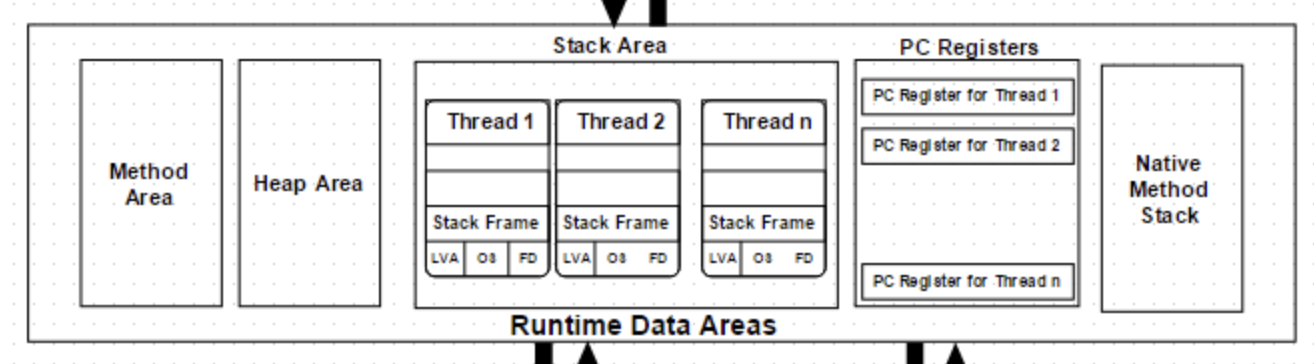
스레드 공유 영역과 스레드별 영역으로 나뉩니다.
- 모든 스레드 공유: Method Area(Metaspace), Heap
- 스레드별 생성: JVM Stack, PC Register, Native Method Stack
3.1 Method Area (Metaspace)
- Java 8 이전: PermGen (Permanent Generation)
- Java 8 이후: Metaspace (Native Memory 사용)
저장 내용:
- 클래스 구조 (필드/메서드 정보)
- Runtime Constant Pool
- 메서드 바이트코드
- static 변수
# Metaspace 크기 설정 (Java 8+)-XX:MetaspaceSize=128m # 초기 크기-XX:MaxMetaspaceSize=256m # 최대 크기 (기본: 무제한)PermGen → Metaspace 변경 이유
- PermGen은 Heap의 일부로 관리됐고 크기 제한 때문에
OutOfMemoryError: PermGen space가 자주 발생했습니다. - Metaspace는 Native Memory를 써서 자동으로 확장 가능합니다.
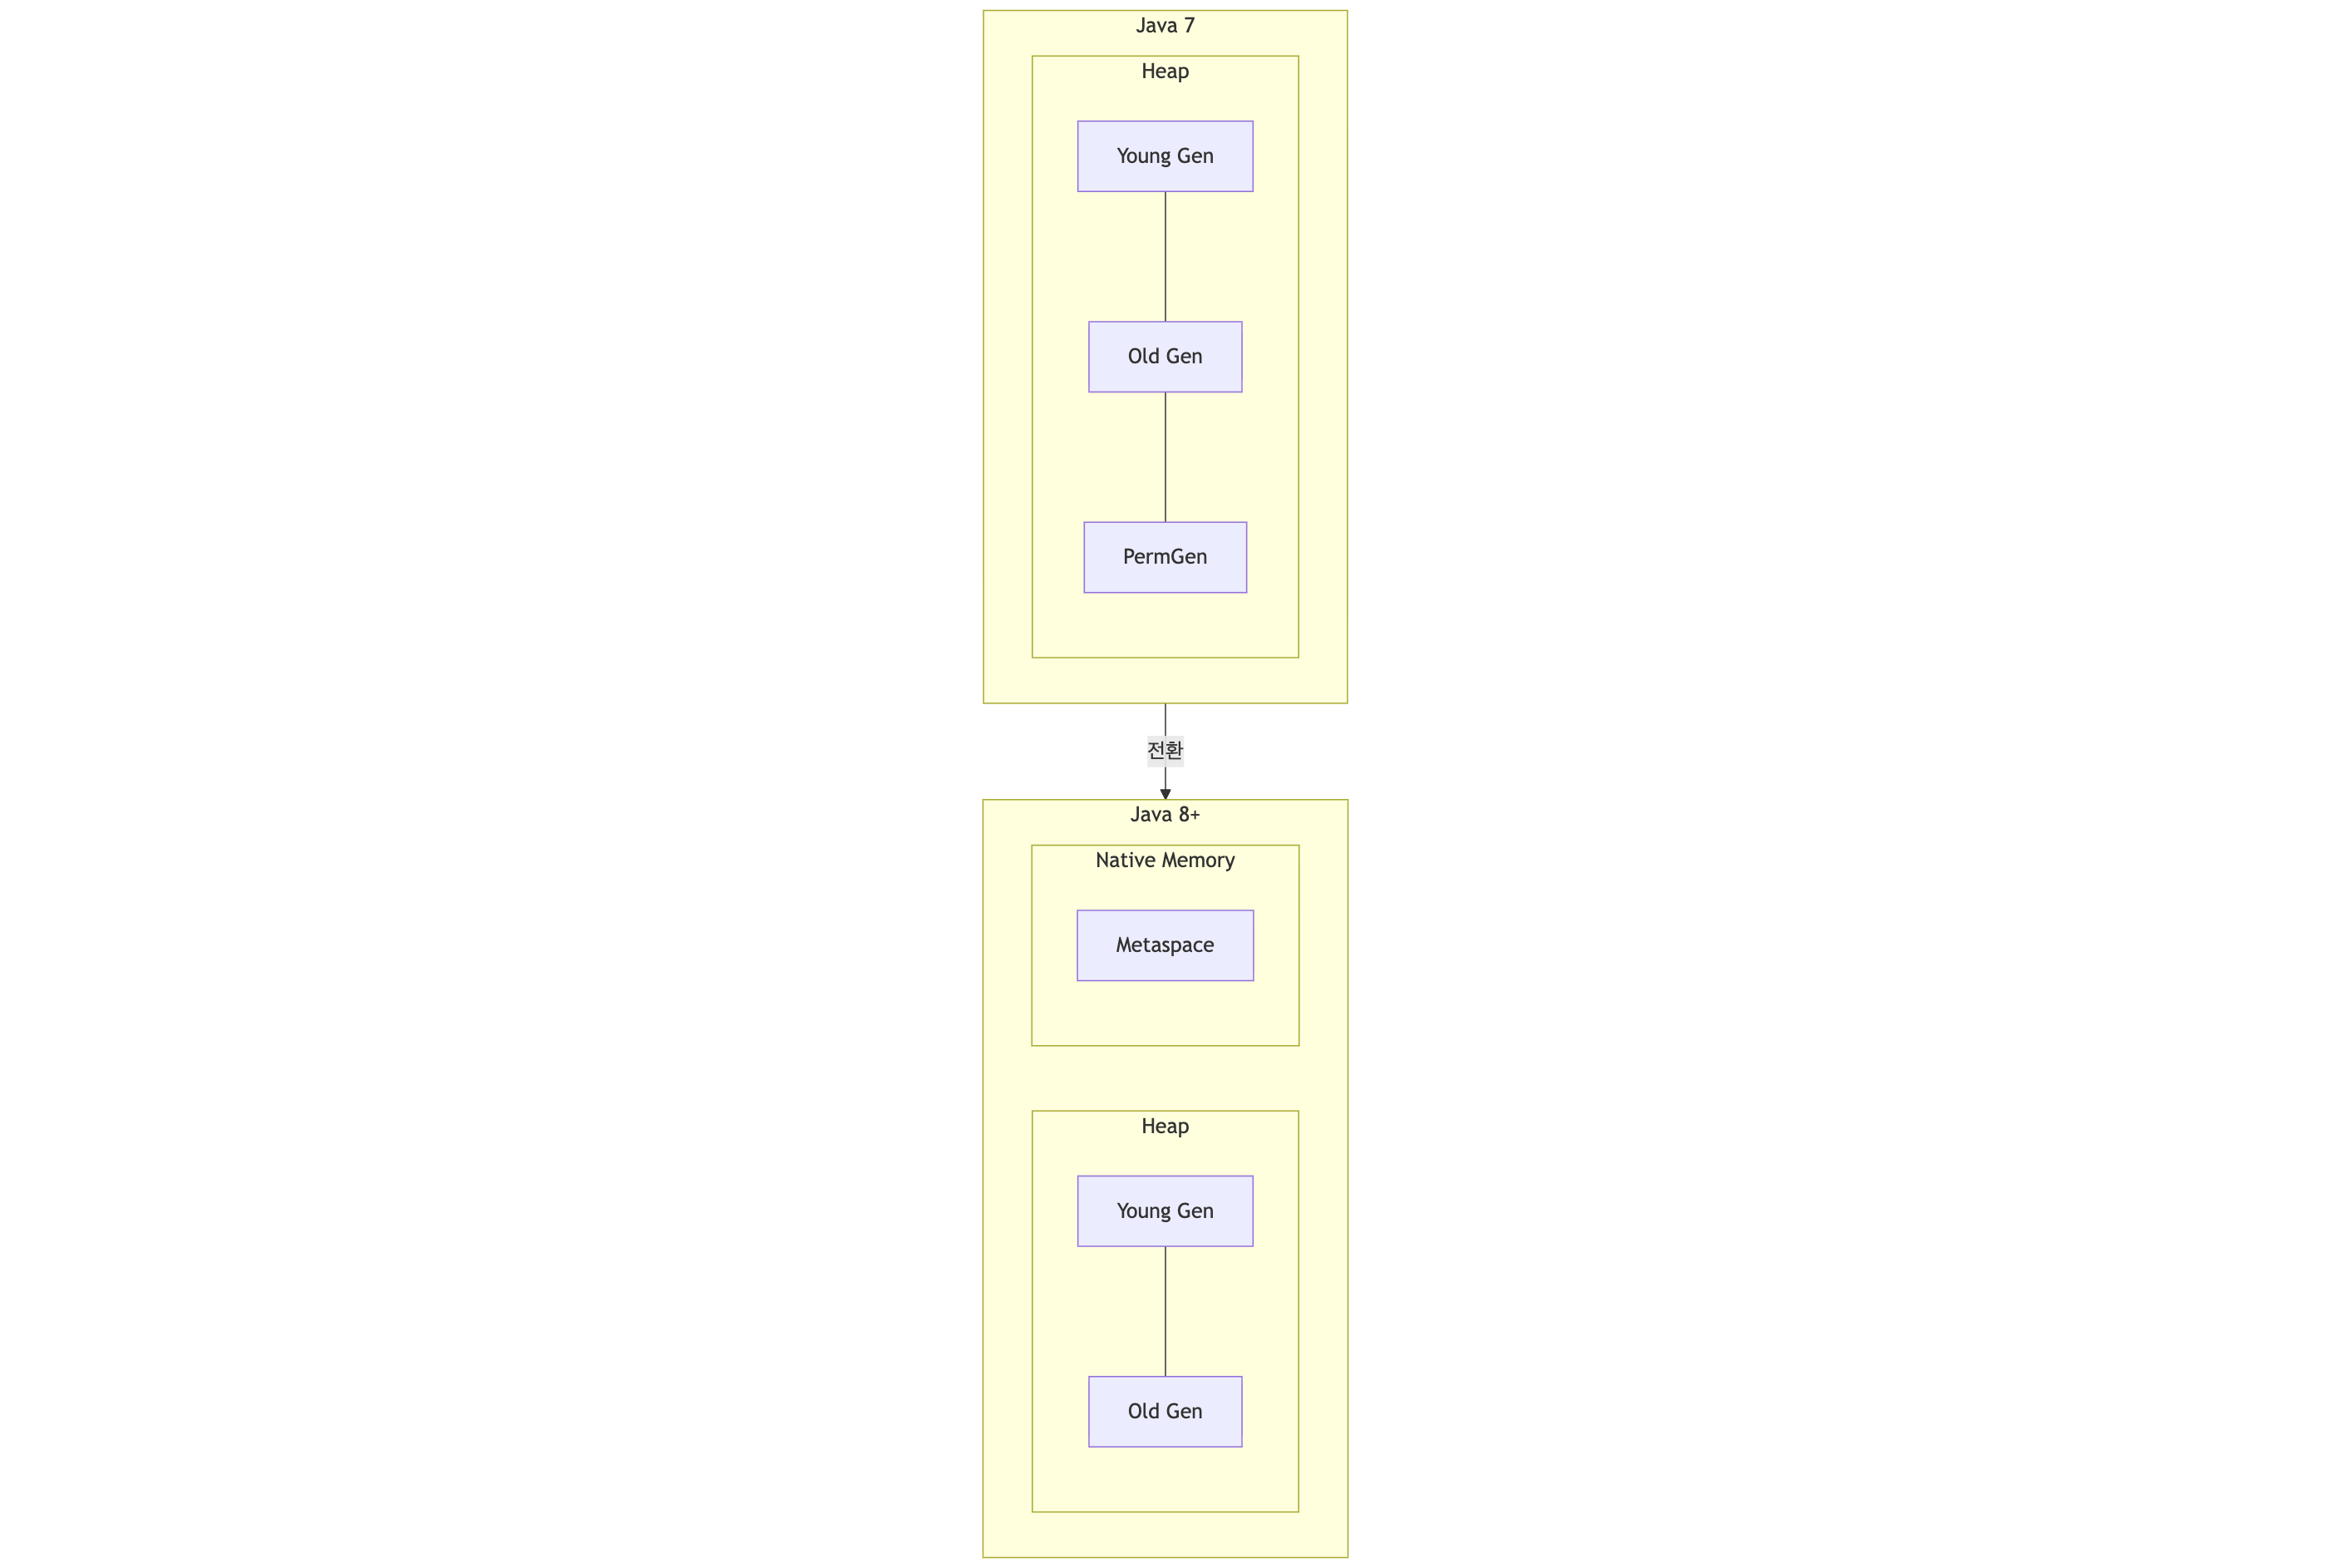
참고: Java 7부터 static 변수의 참조는 Heap으로 이동했습니다. Metaspace에는 클래스 메타데이터만 남아 있습니다.
출처: About G1 Garbage Collector, Permanent Generation, and Metaspace - Oracle
3.2 Heap
모든 객체와 배열이 할당되는 영역이며, GC의 주요 대상입니다.
User user = new User(); // Heap에 생성int[] arr = new int[10]; // 배열도 Heap에 생성Heap의 세대별 구조(Young/Old/Eden/Survivor), Minor GC → Promotion → Full GC 흐름, NewRatio/SurvivorRatio 같은 튜닝 파라미터는 이 시리즈의 ①편에서 1차 소스 기준으로 자세히 다뤘습니다.
3.3 JVM Stack (스레드별)
각 스레드마다 별도로 생성되며 Stack Frame들의 집합입니다.
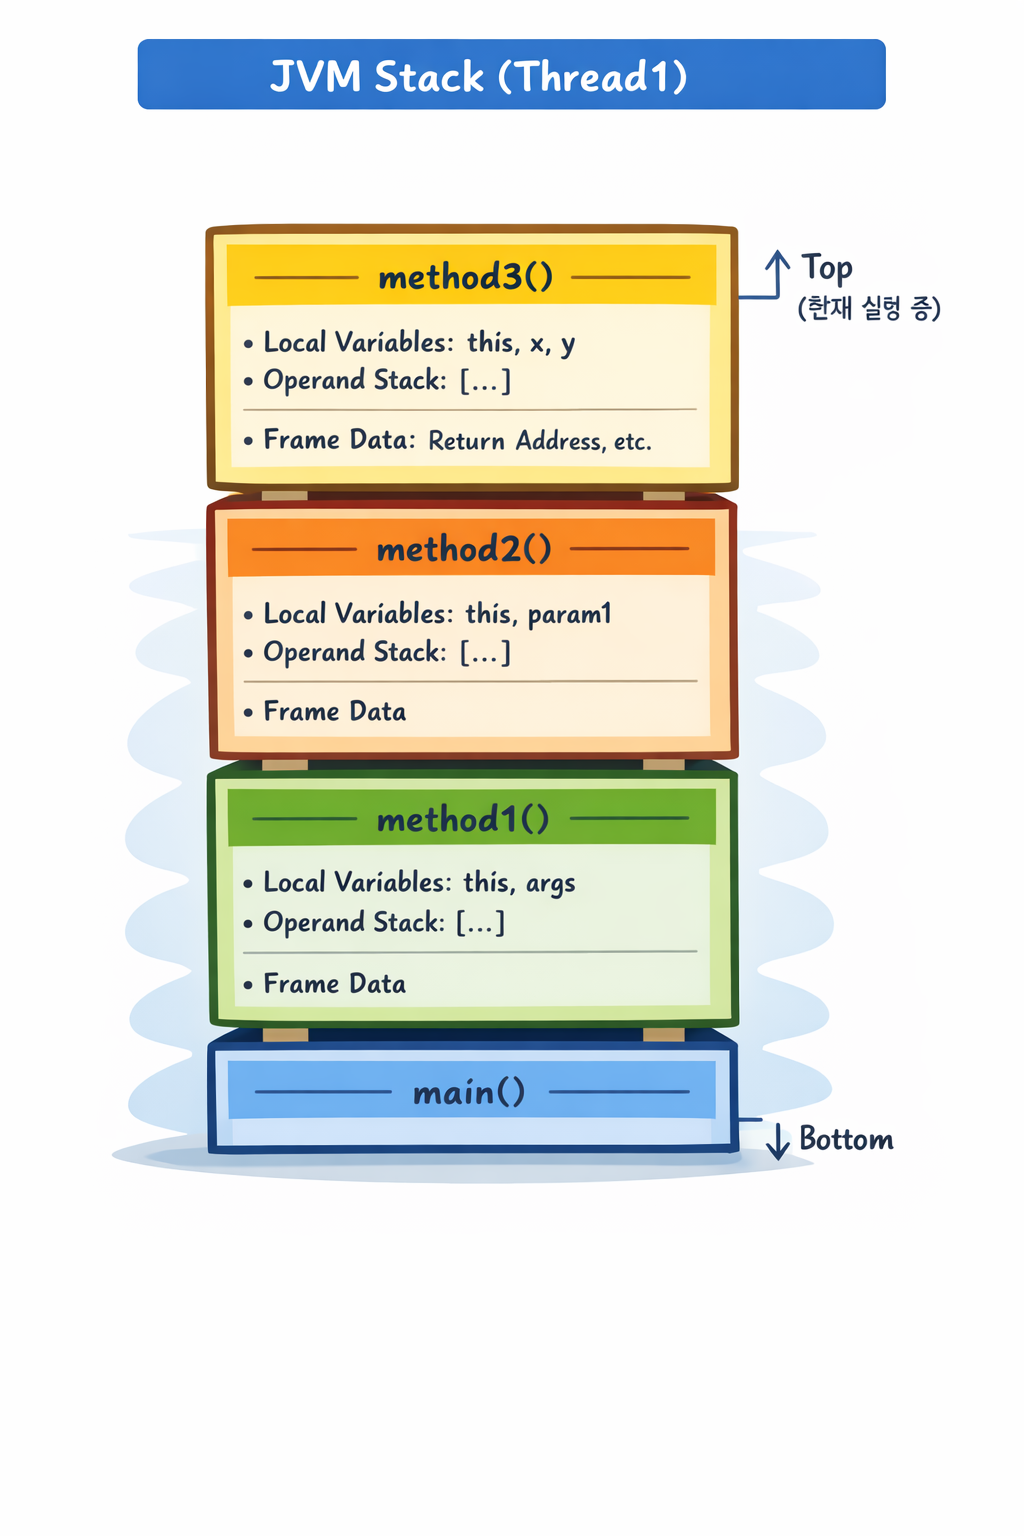
Stack Frame 구성요소:
- Local Variables Array: 지역 변수, 메서드 파라미터
- Operand Stack: 연산 중간값
- Frame Data: 리턴 주소, 예외 테이블 참조 등
public int calculate(int a, int b) { int sum = a + b; // Local Variables: [this, a, b, sum] return sum * 2;}
// 바이트코드 (Operand Stack 사용)// iload_1 // a를 Operand Stack에 push// iload_2 // b를 Operand Stack에 push// iadd // pop 2개, 더해서 push// istore_3 // pop해서 sum(index 3)에 저장스택 크기 설정:
-Xss512k # 스레드당 스택 크기 (기본: 1MB)StackOverflowError:
void infinite() { infinite(); // 무한 재귀 → Stack Frame 계속 쌓임 → overflow}출처: The Java Virtual Machine Specification — §2.5 Run-Time Data Areas
3.4 PC Register & Native Method Stack
PC Register: 현재 실행 중인 명령어의 주소를 저장. 스레드마다 별도로 존재합니다. (Native 메서드 실행 중이면 undefined)
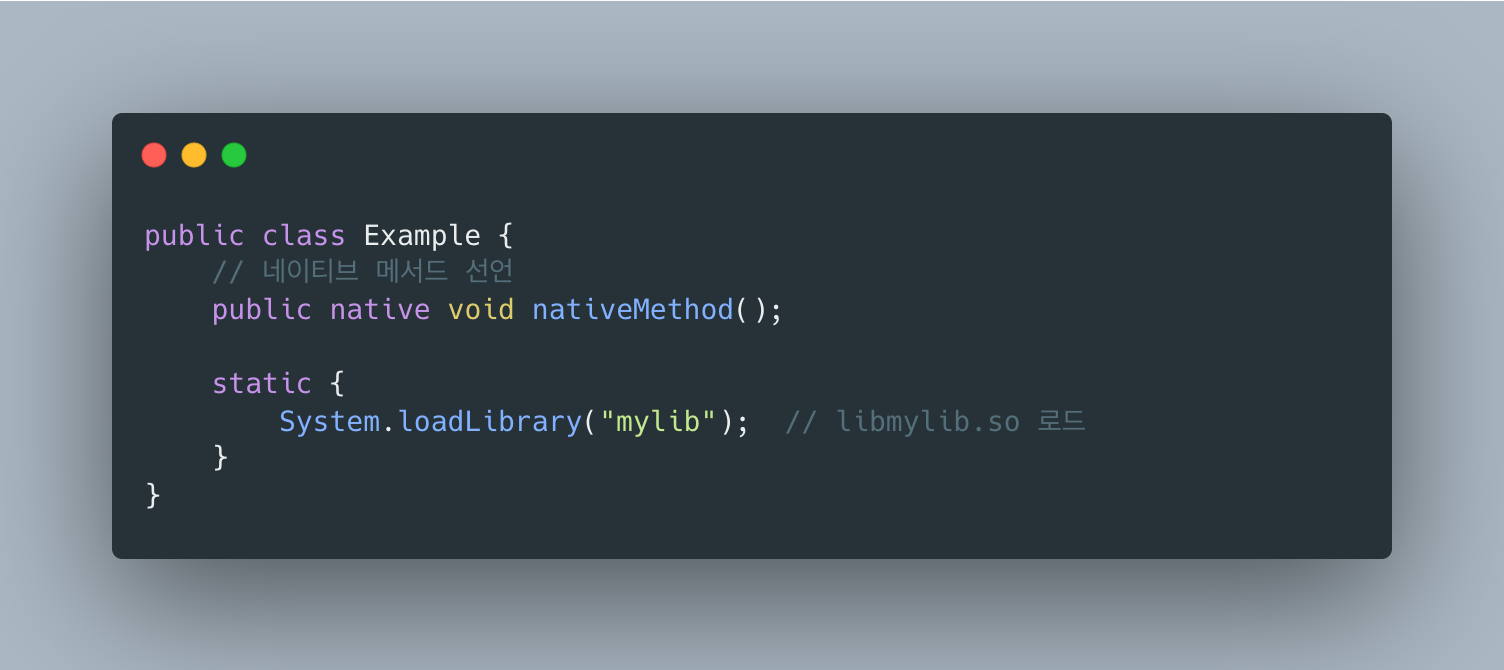
Native Method Stack: JNI(Java Native Interface)로 호출되는 네이티브 메서드(C/C++)용 스택.
4. Execution Engine
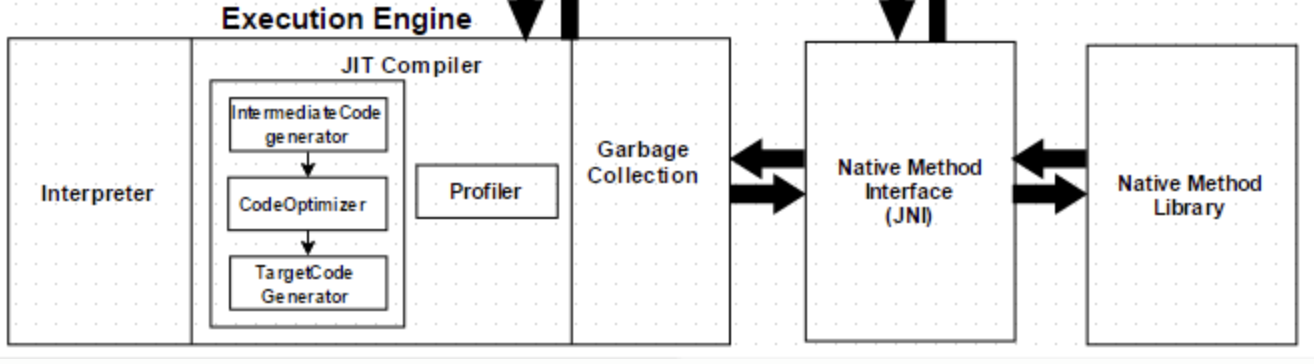
바이트코드를 실제 기계어로 변환해서 실행합니다. Interpreter + JIT Compiler 조합이 HotSpot의 핵심입니다.
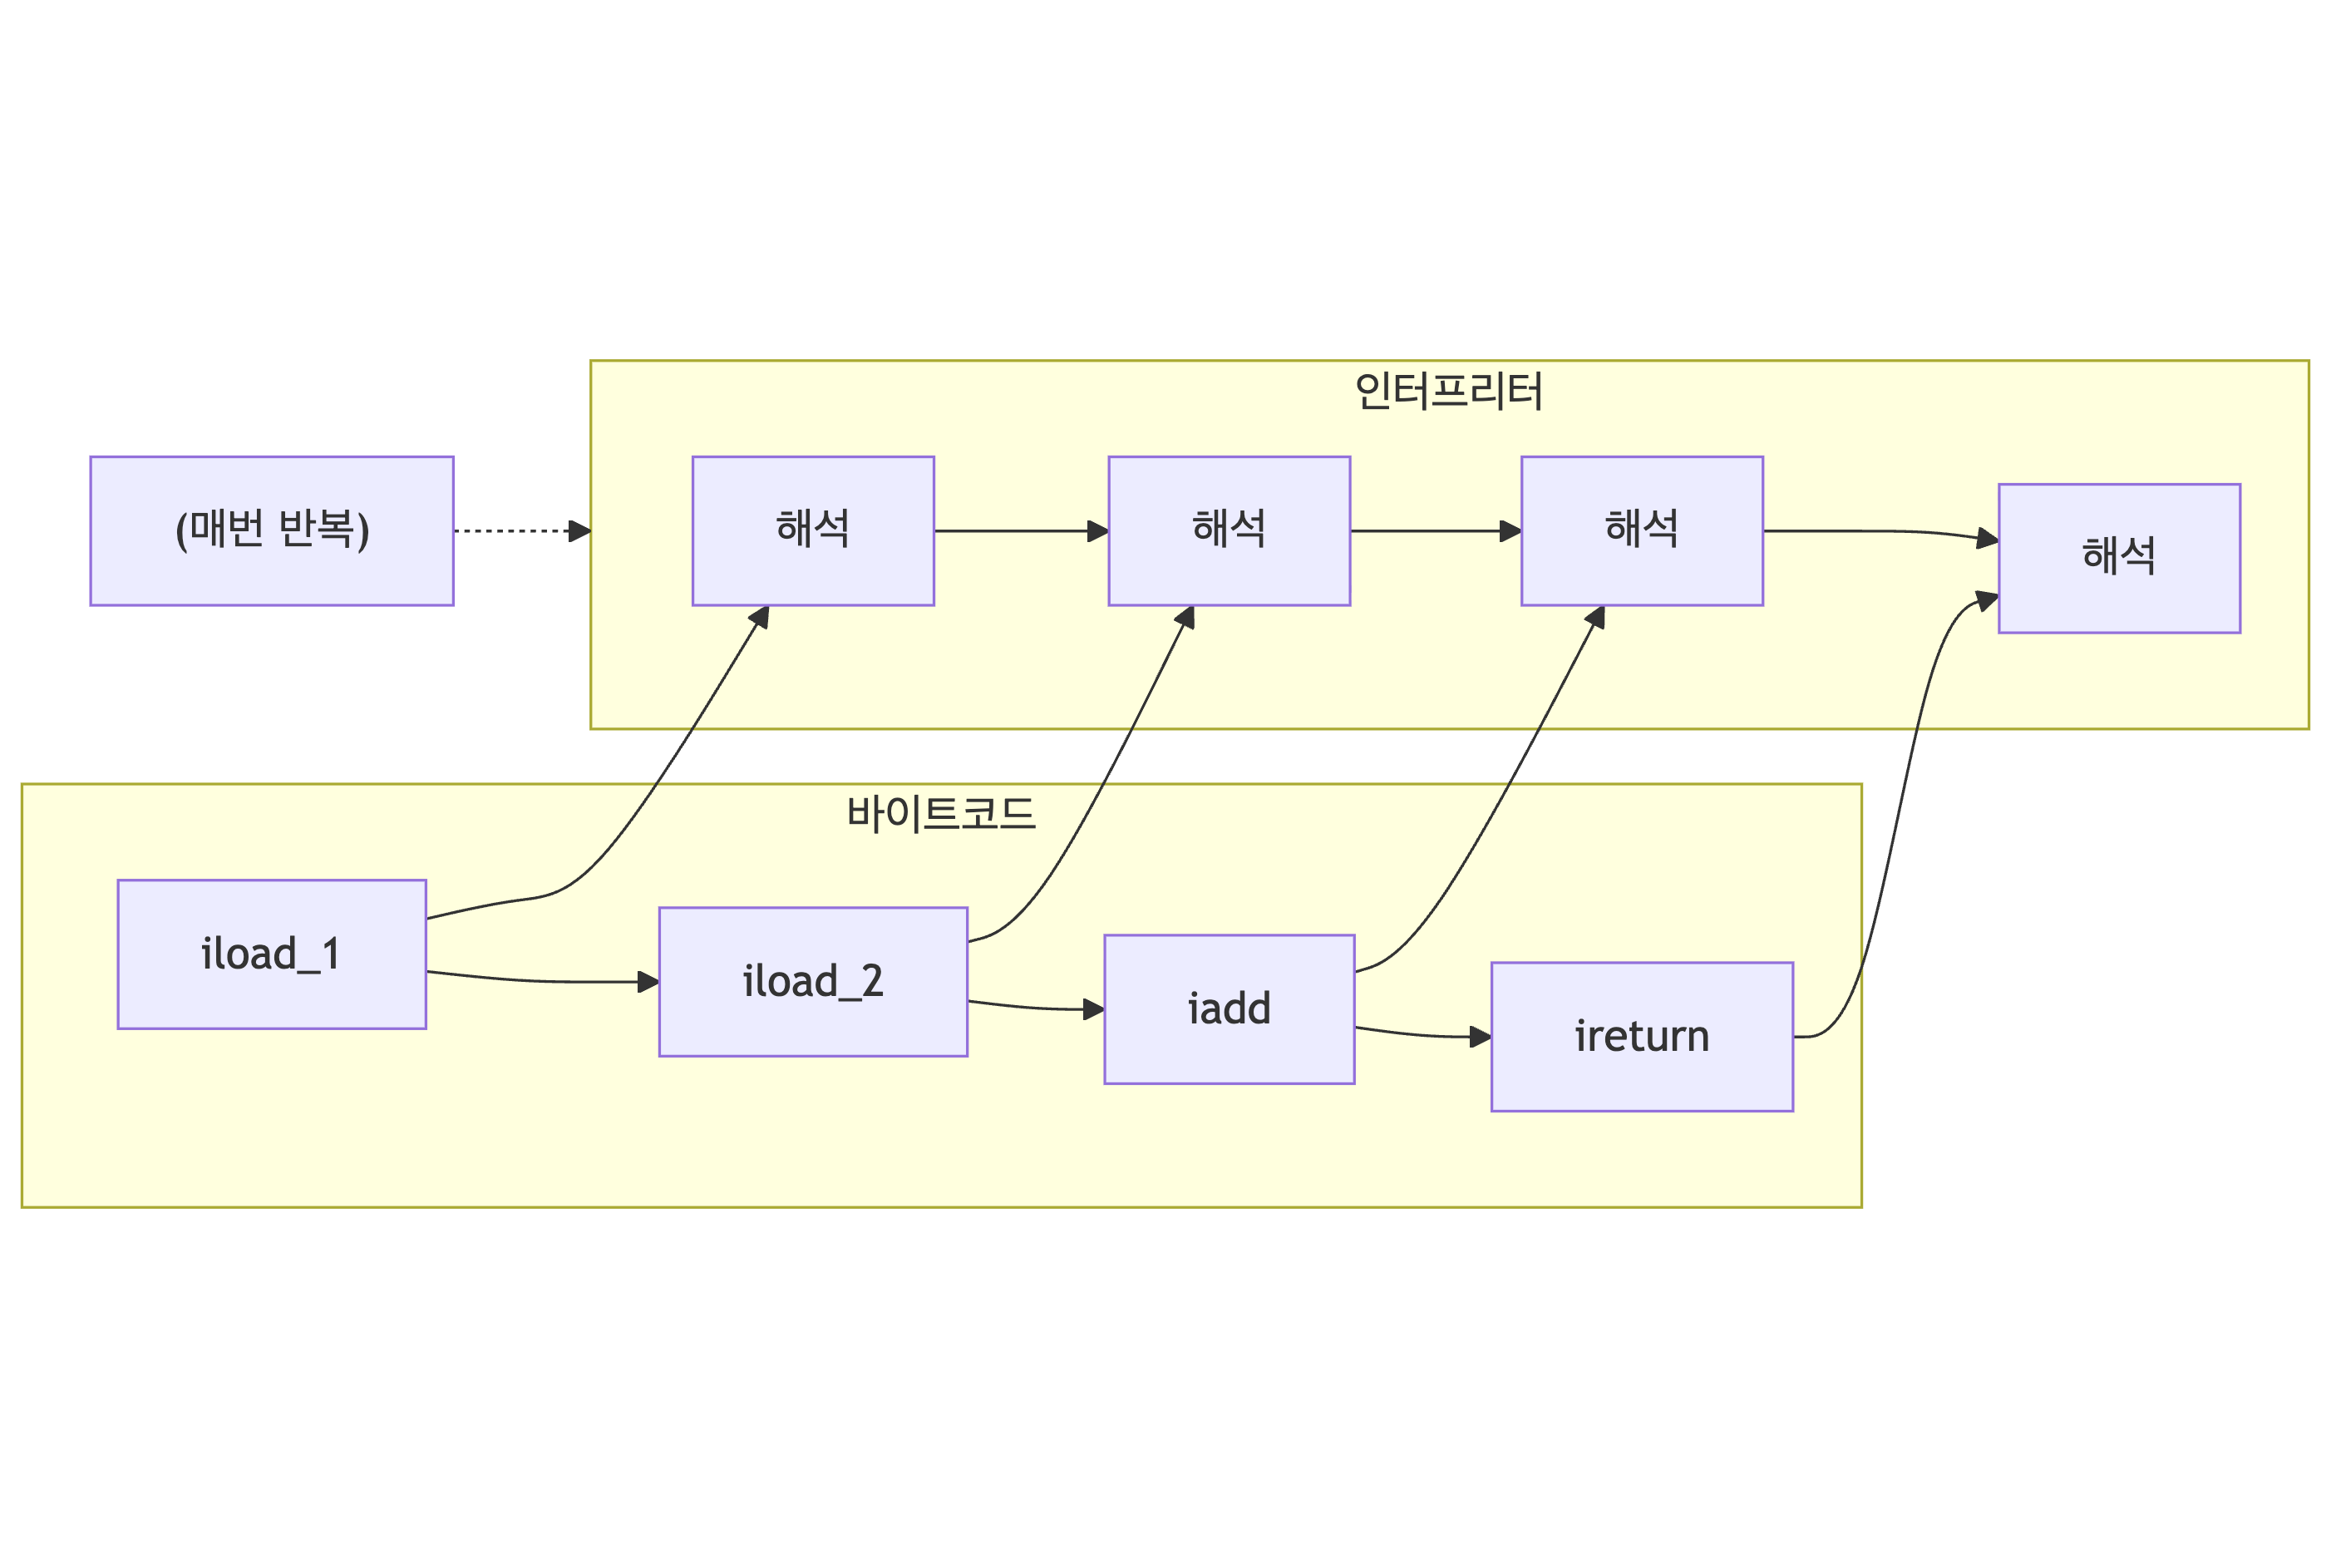
4.1 Interpreter
바이트코드를 한 줄씩 읽어서 실행합니다. 시작은 빠르지만 반복 실행 시 느립니다.
4.2 JIT Compiler (Just-In-Time)
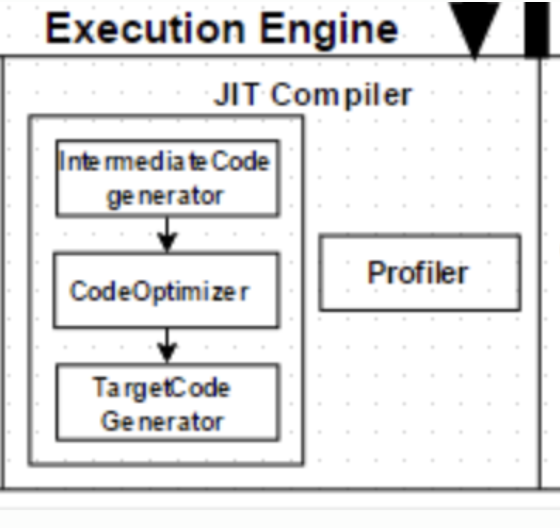
자주 실행되는 코드(Hot Spot)를 네이티브 코드로 컴파일하여 캐싱합니다.
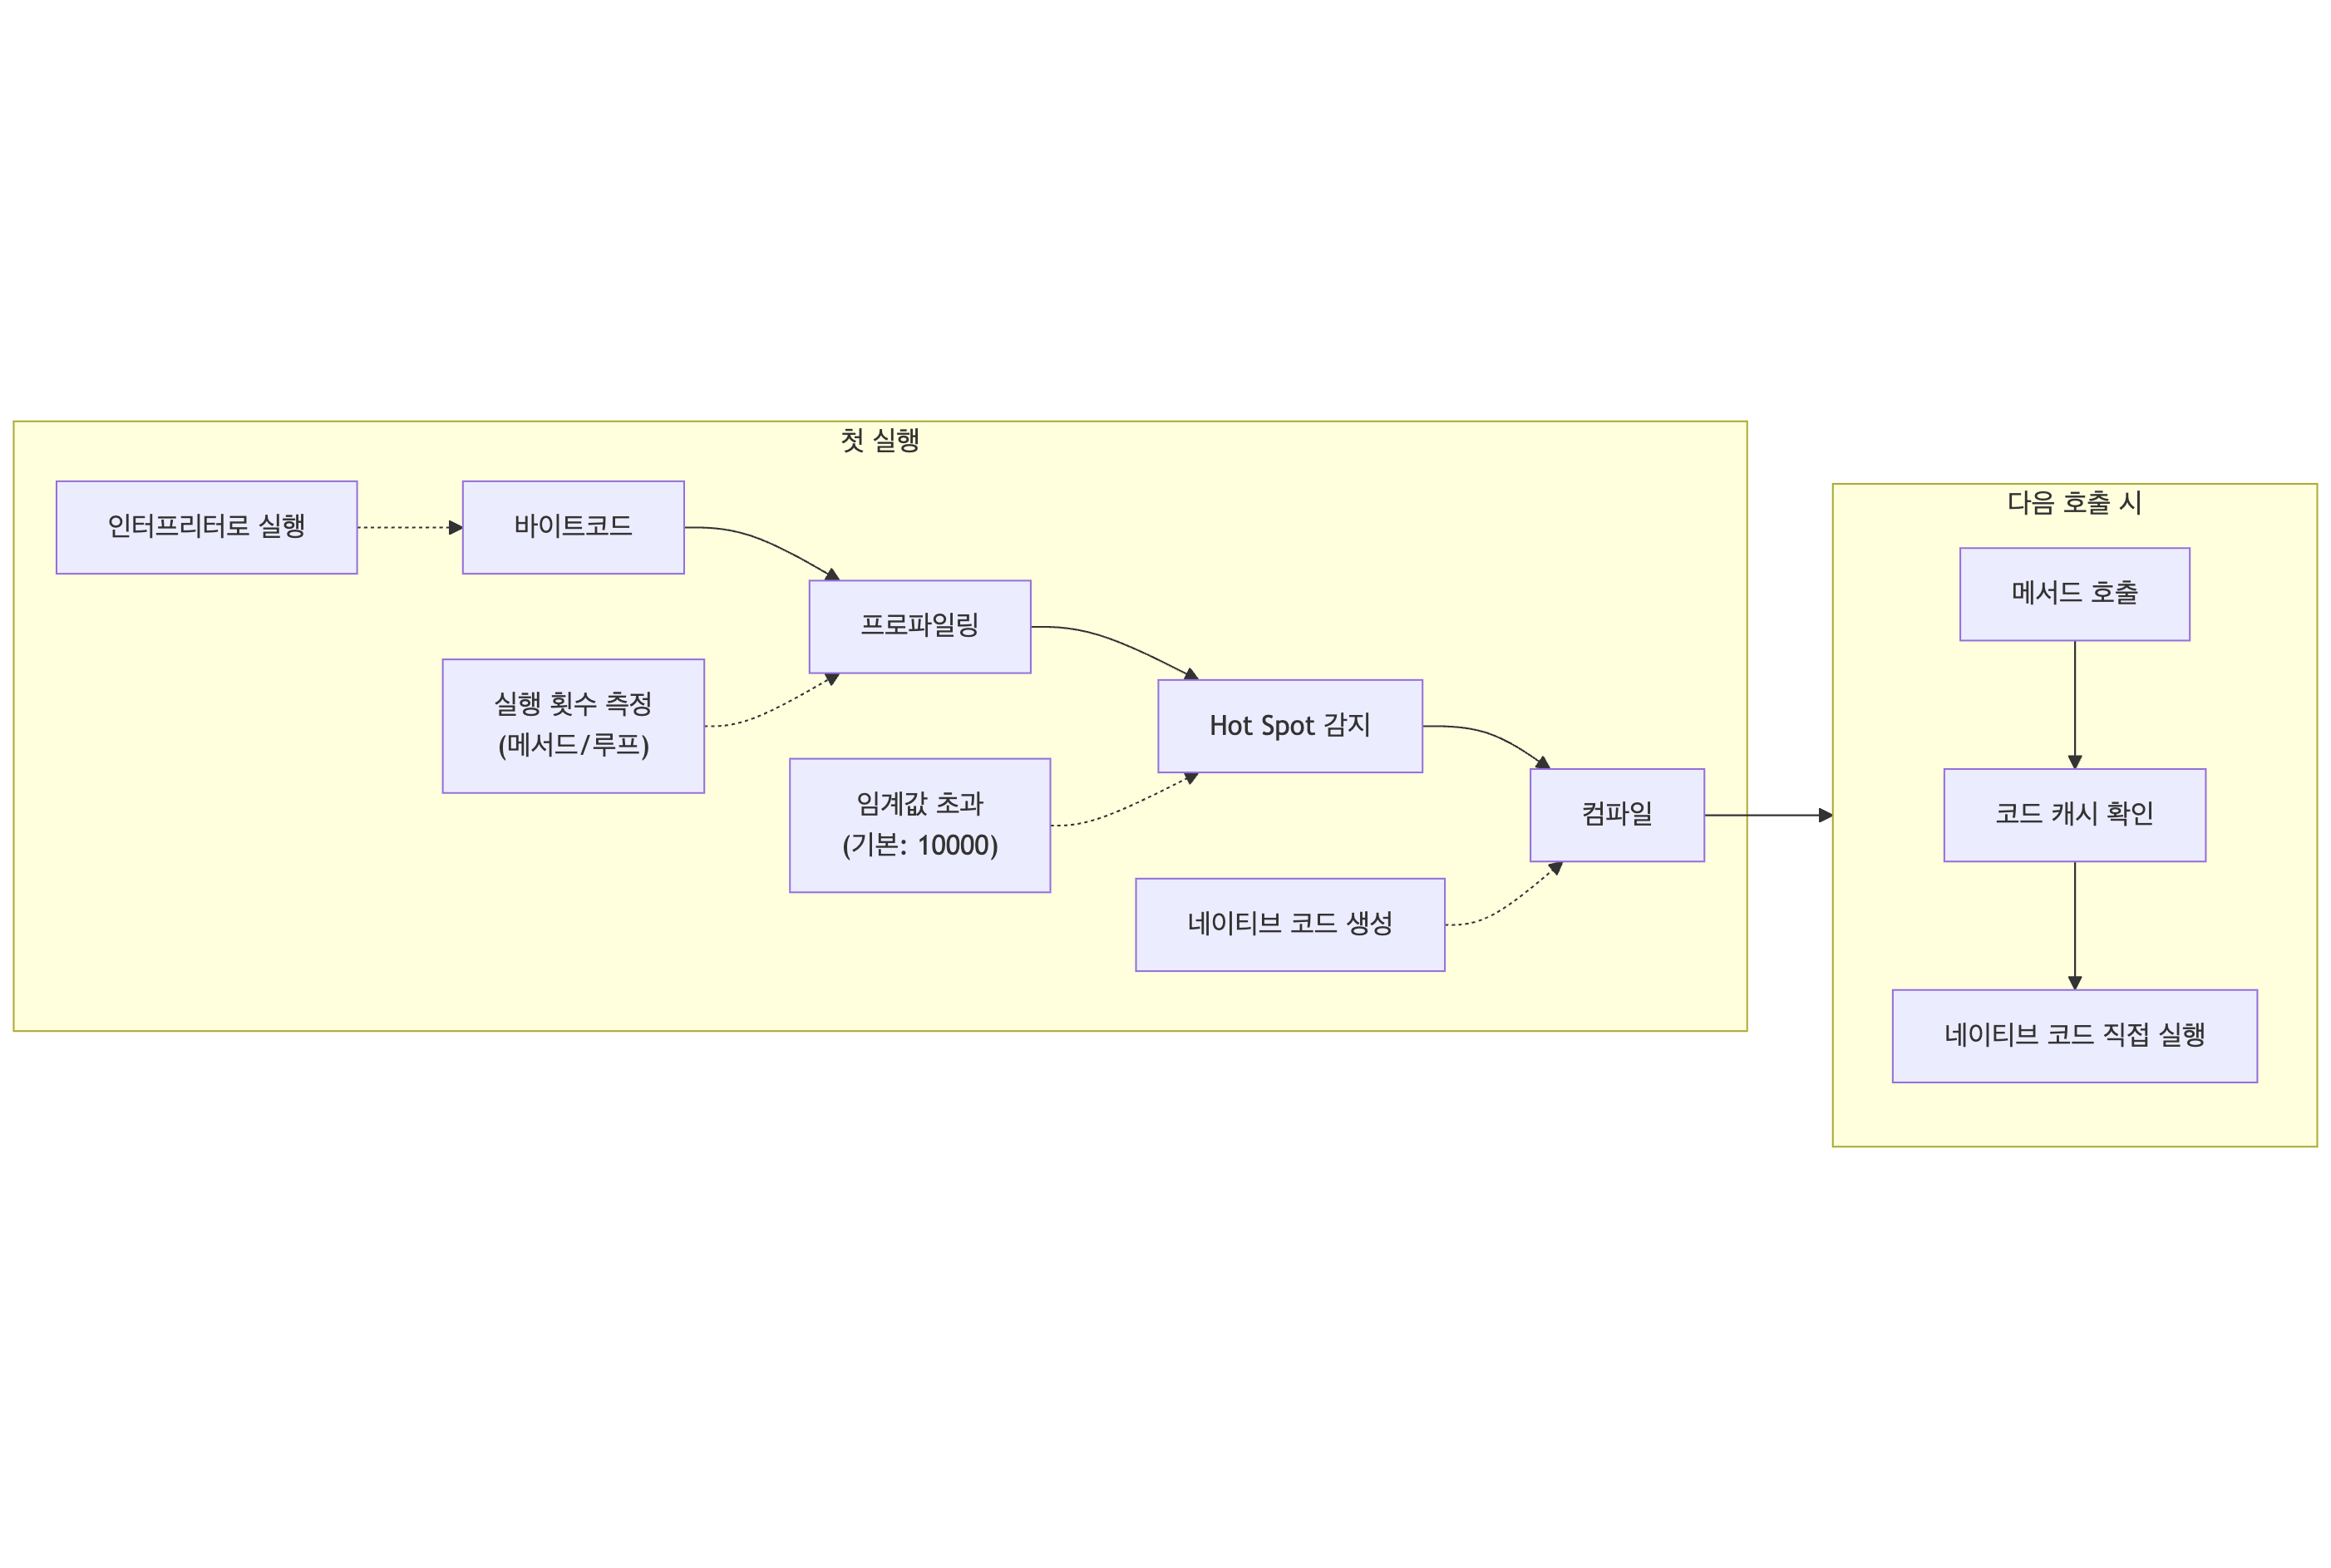
- 바이트코드 (인터프리터로 실행)
- 프로파일링 (실행 횟수 측정: 메서드/루프)
- Hot Spot 감지 (임계값 초과)
- 컴파일 (네이티브 코드 생성)
→ 다음 호출부터:
- 메서드 호출
- 코드 캐시 확인
- 네이티브 코드 직접 실행
4.3 Tiered Compilation
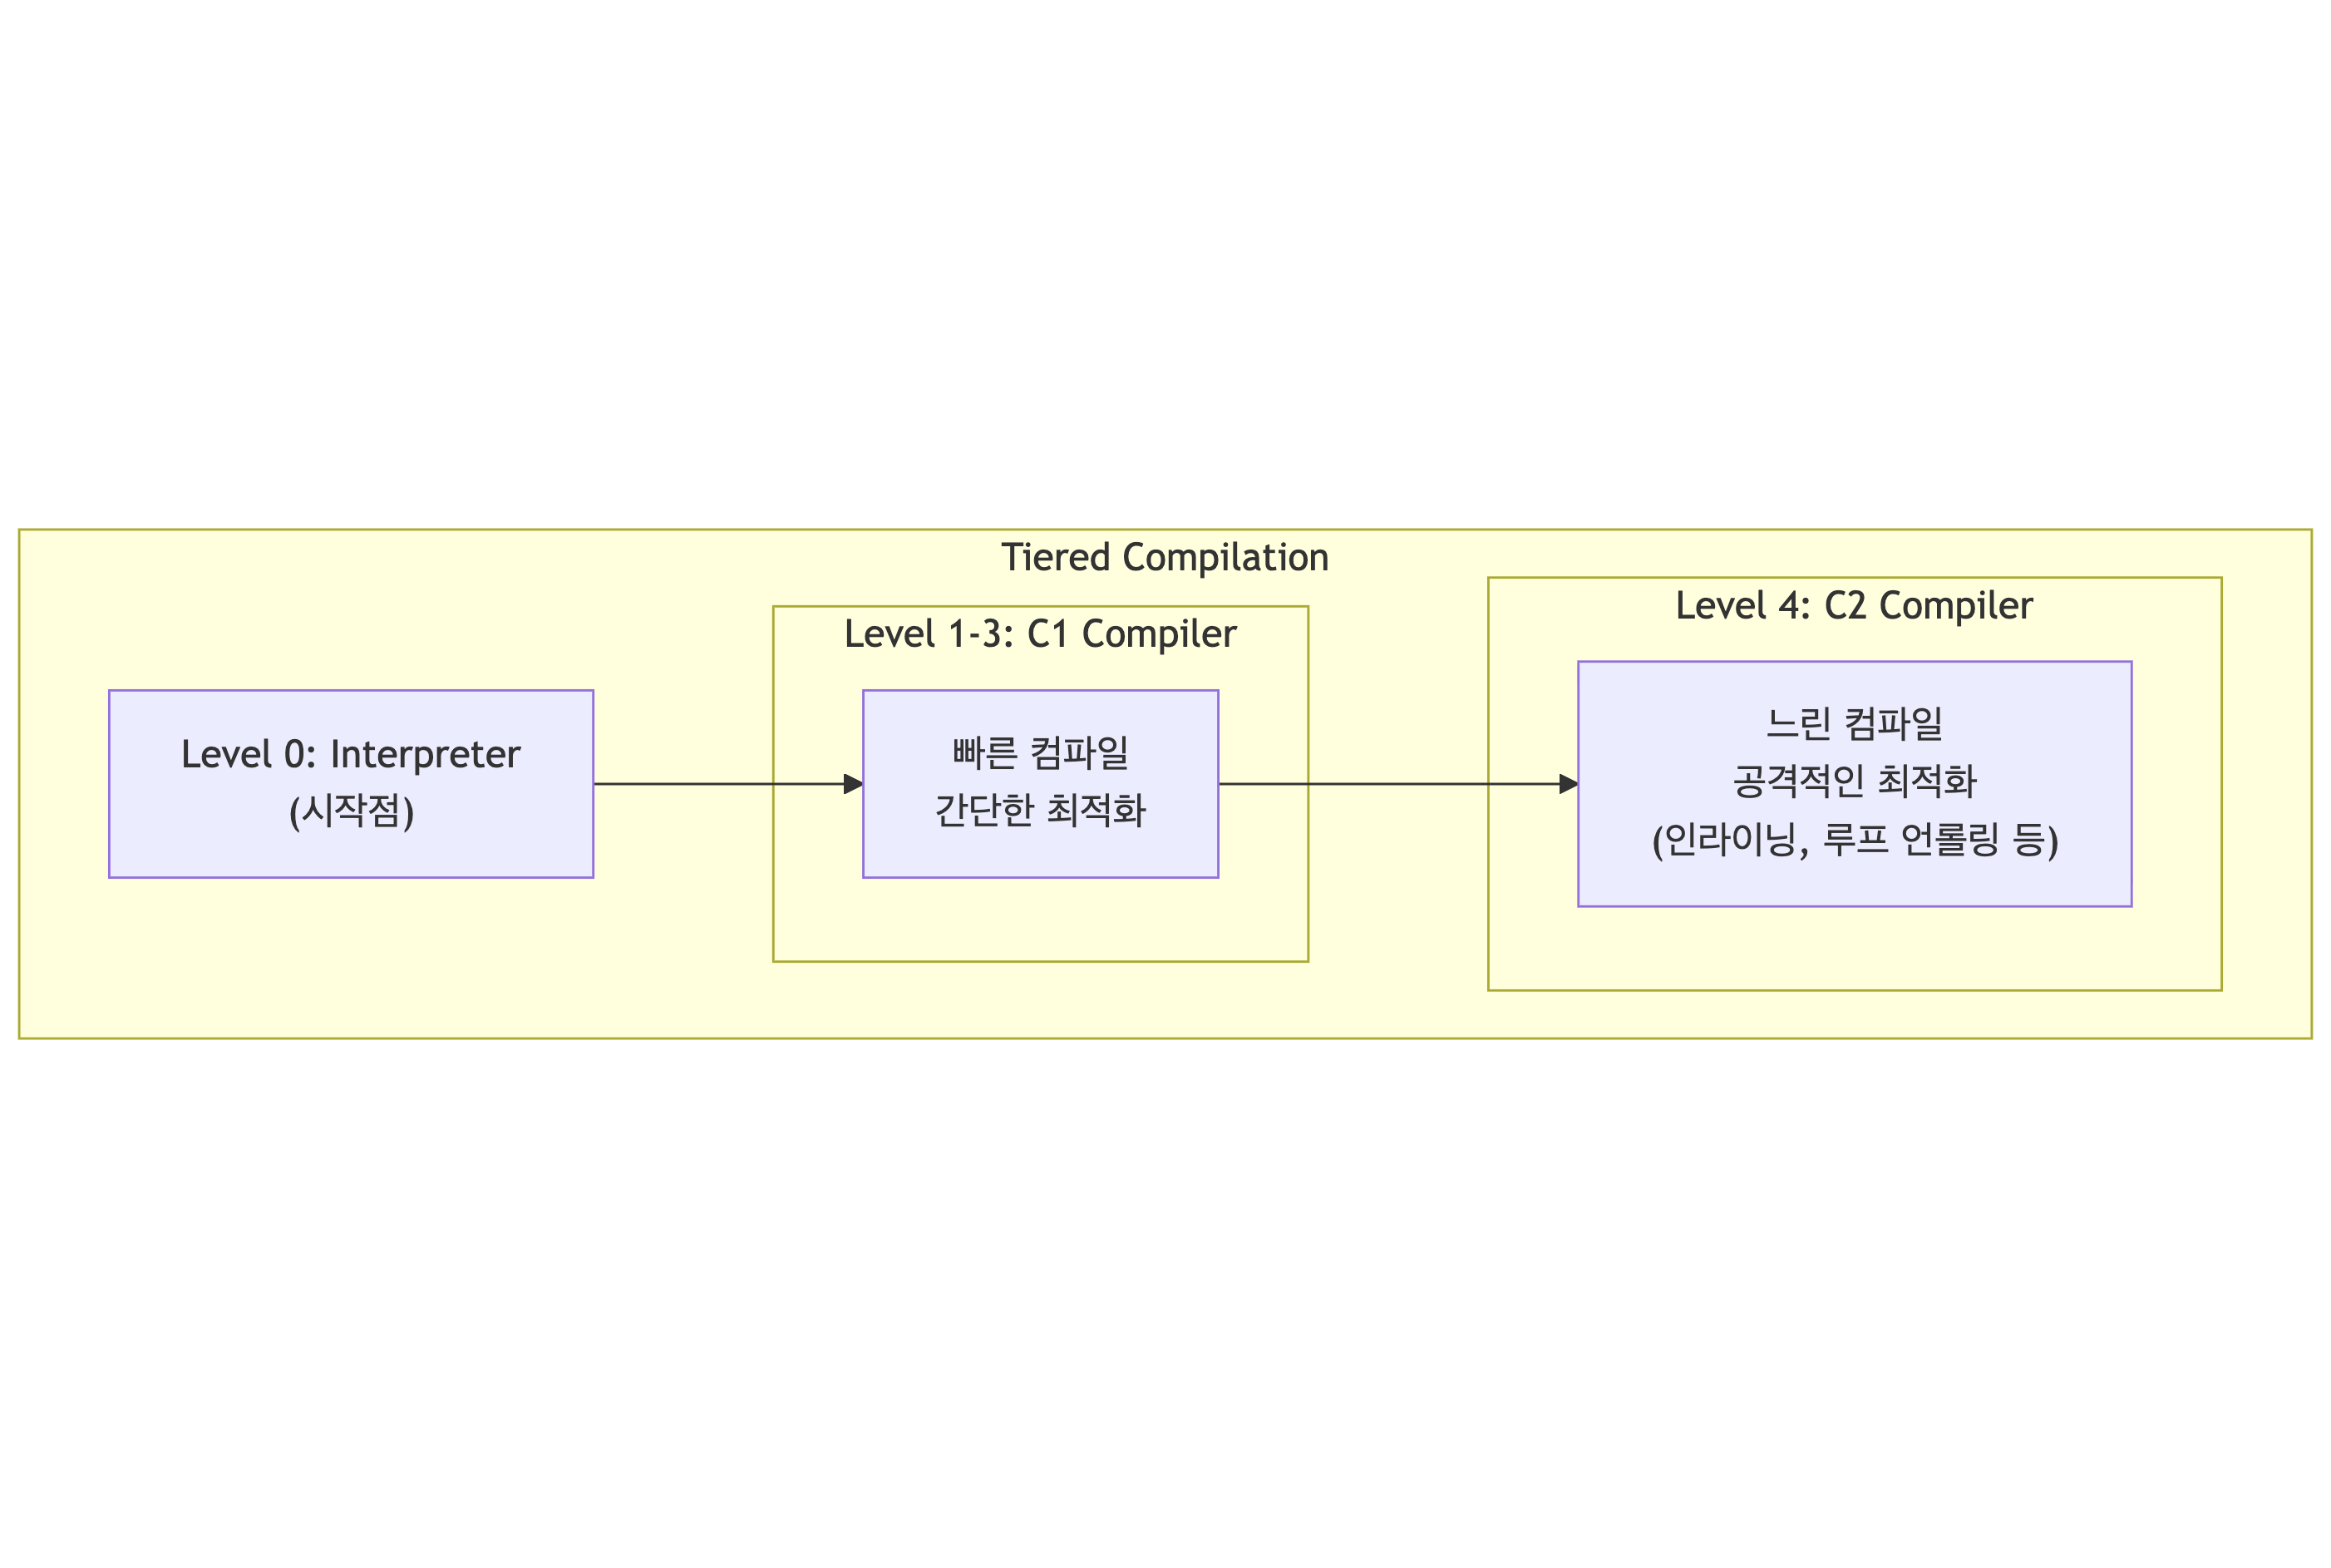
HotSpot은 두 개의 JIT 컴파일러를 단계적으로 결합합니다.
| Tier | 컴파일러 | 용도 |
|---|---|---|
| 0 | Interpreter | 초기 실행, 프로파일링 |
| 1~3 | C1 (Client) | 빠른 컴파일, 가벼운 최적화, 프로파일링 데이터 수집 |
| 4 | C2 (Server) | 공격적 최적화, 오랜 컴파일 시간, 최고 성능 |
코드는 0 → 3 → 4 식으로 단계적으로 승급됩니다. 초반엔 C1으로 빠르게 돌리다가 정말 뜨거운 코드만 C2로 재컴파일됩니다.
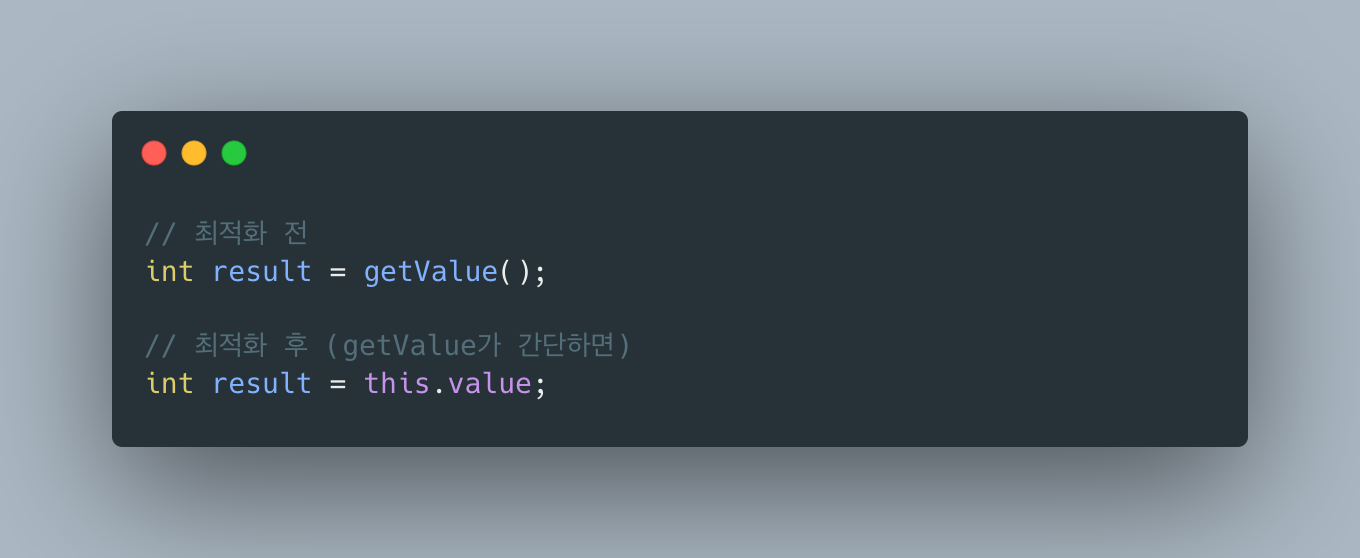
4.4 JIT 최적화 기법
1) Inlining: 메서드 호출을 본문으로 대체
2) Loop Unrolling: 루프 반복 줄이기
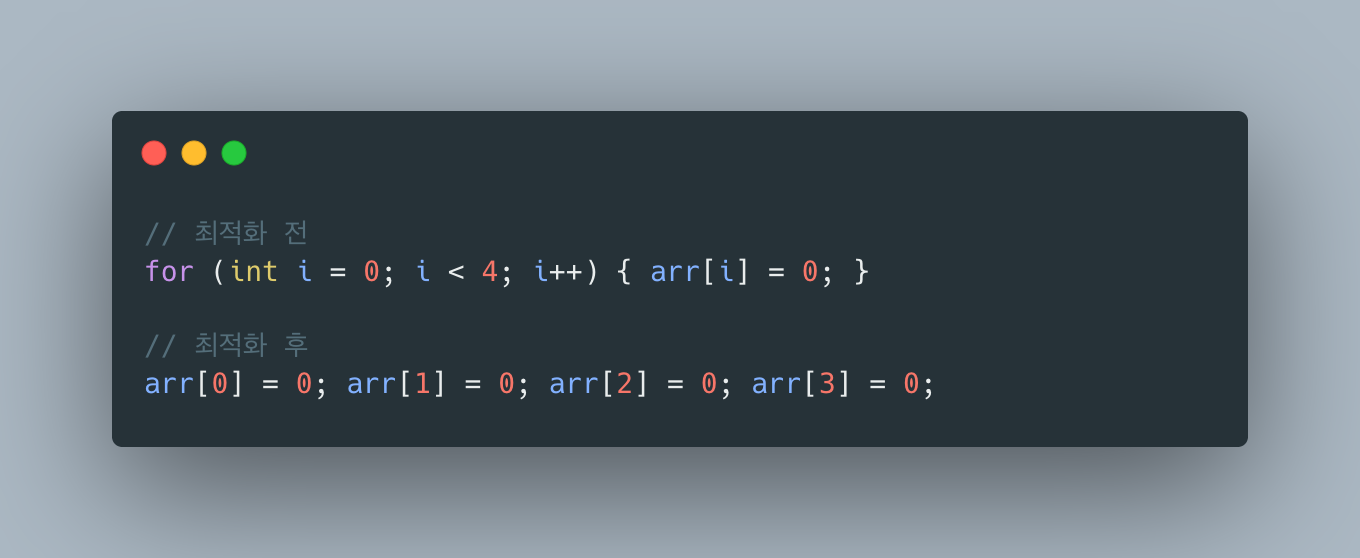
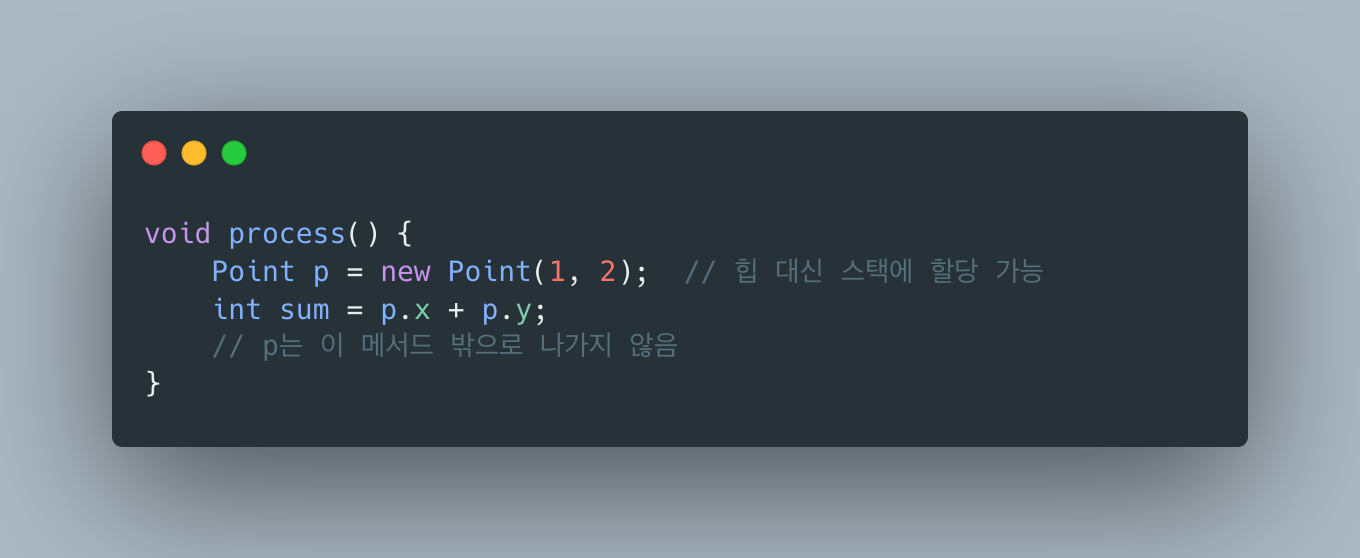
3) Escape Analysis: 객체가 메서드 밖으로 탈출하지 않으면 스택에 할당
4) Dead Code Elimination: 사용되지 않는 코드 제거
# JIT 관련 옵션-XX:+PrintCompilation # 컴파일되는 메서드 출력-XX:CompileThreshold=10000 # 컴파일 임계값 (Tiered 꺼졌을 때만 유효)-XX:-TieredCompilation # Tiered Compilation 비활성화참고: Tiered Compilation이 활성화된 상태(Java 8+ 기본값)에서는
CompileThreshold가 무시됩니다. 각 레벨별로 별도 임계값이 쓰입니다.
출처: Java HotSpot Virtual Machine Performance Enhancements - Oracle
5. Object Memory Layout
Java 객체가 Heap에서 어떻게 저장되는지 살펴보겠습니다.
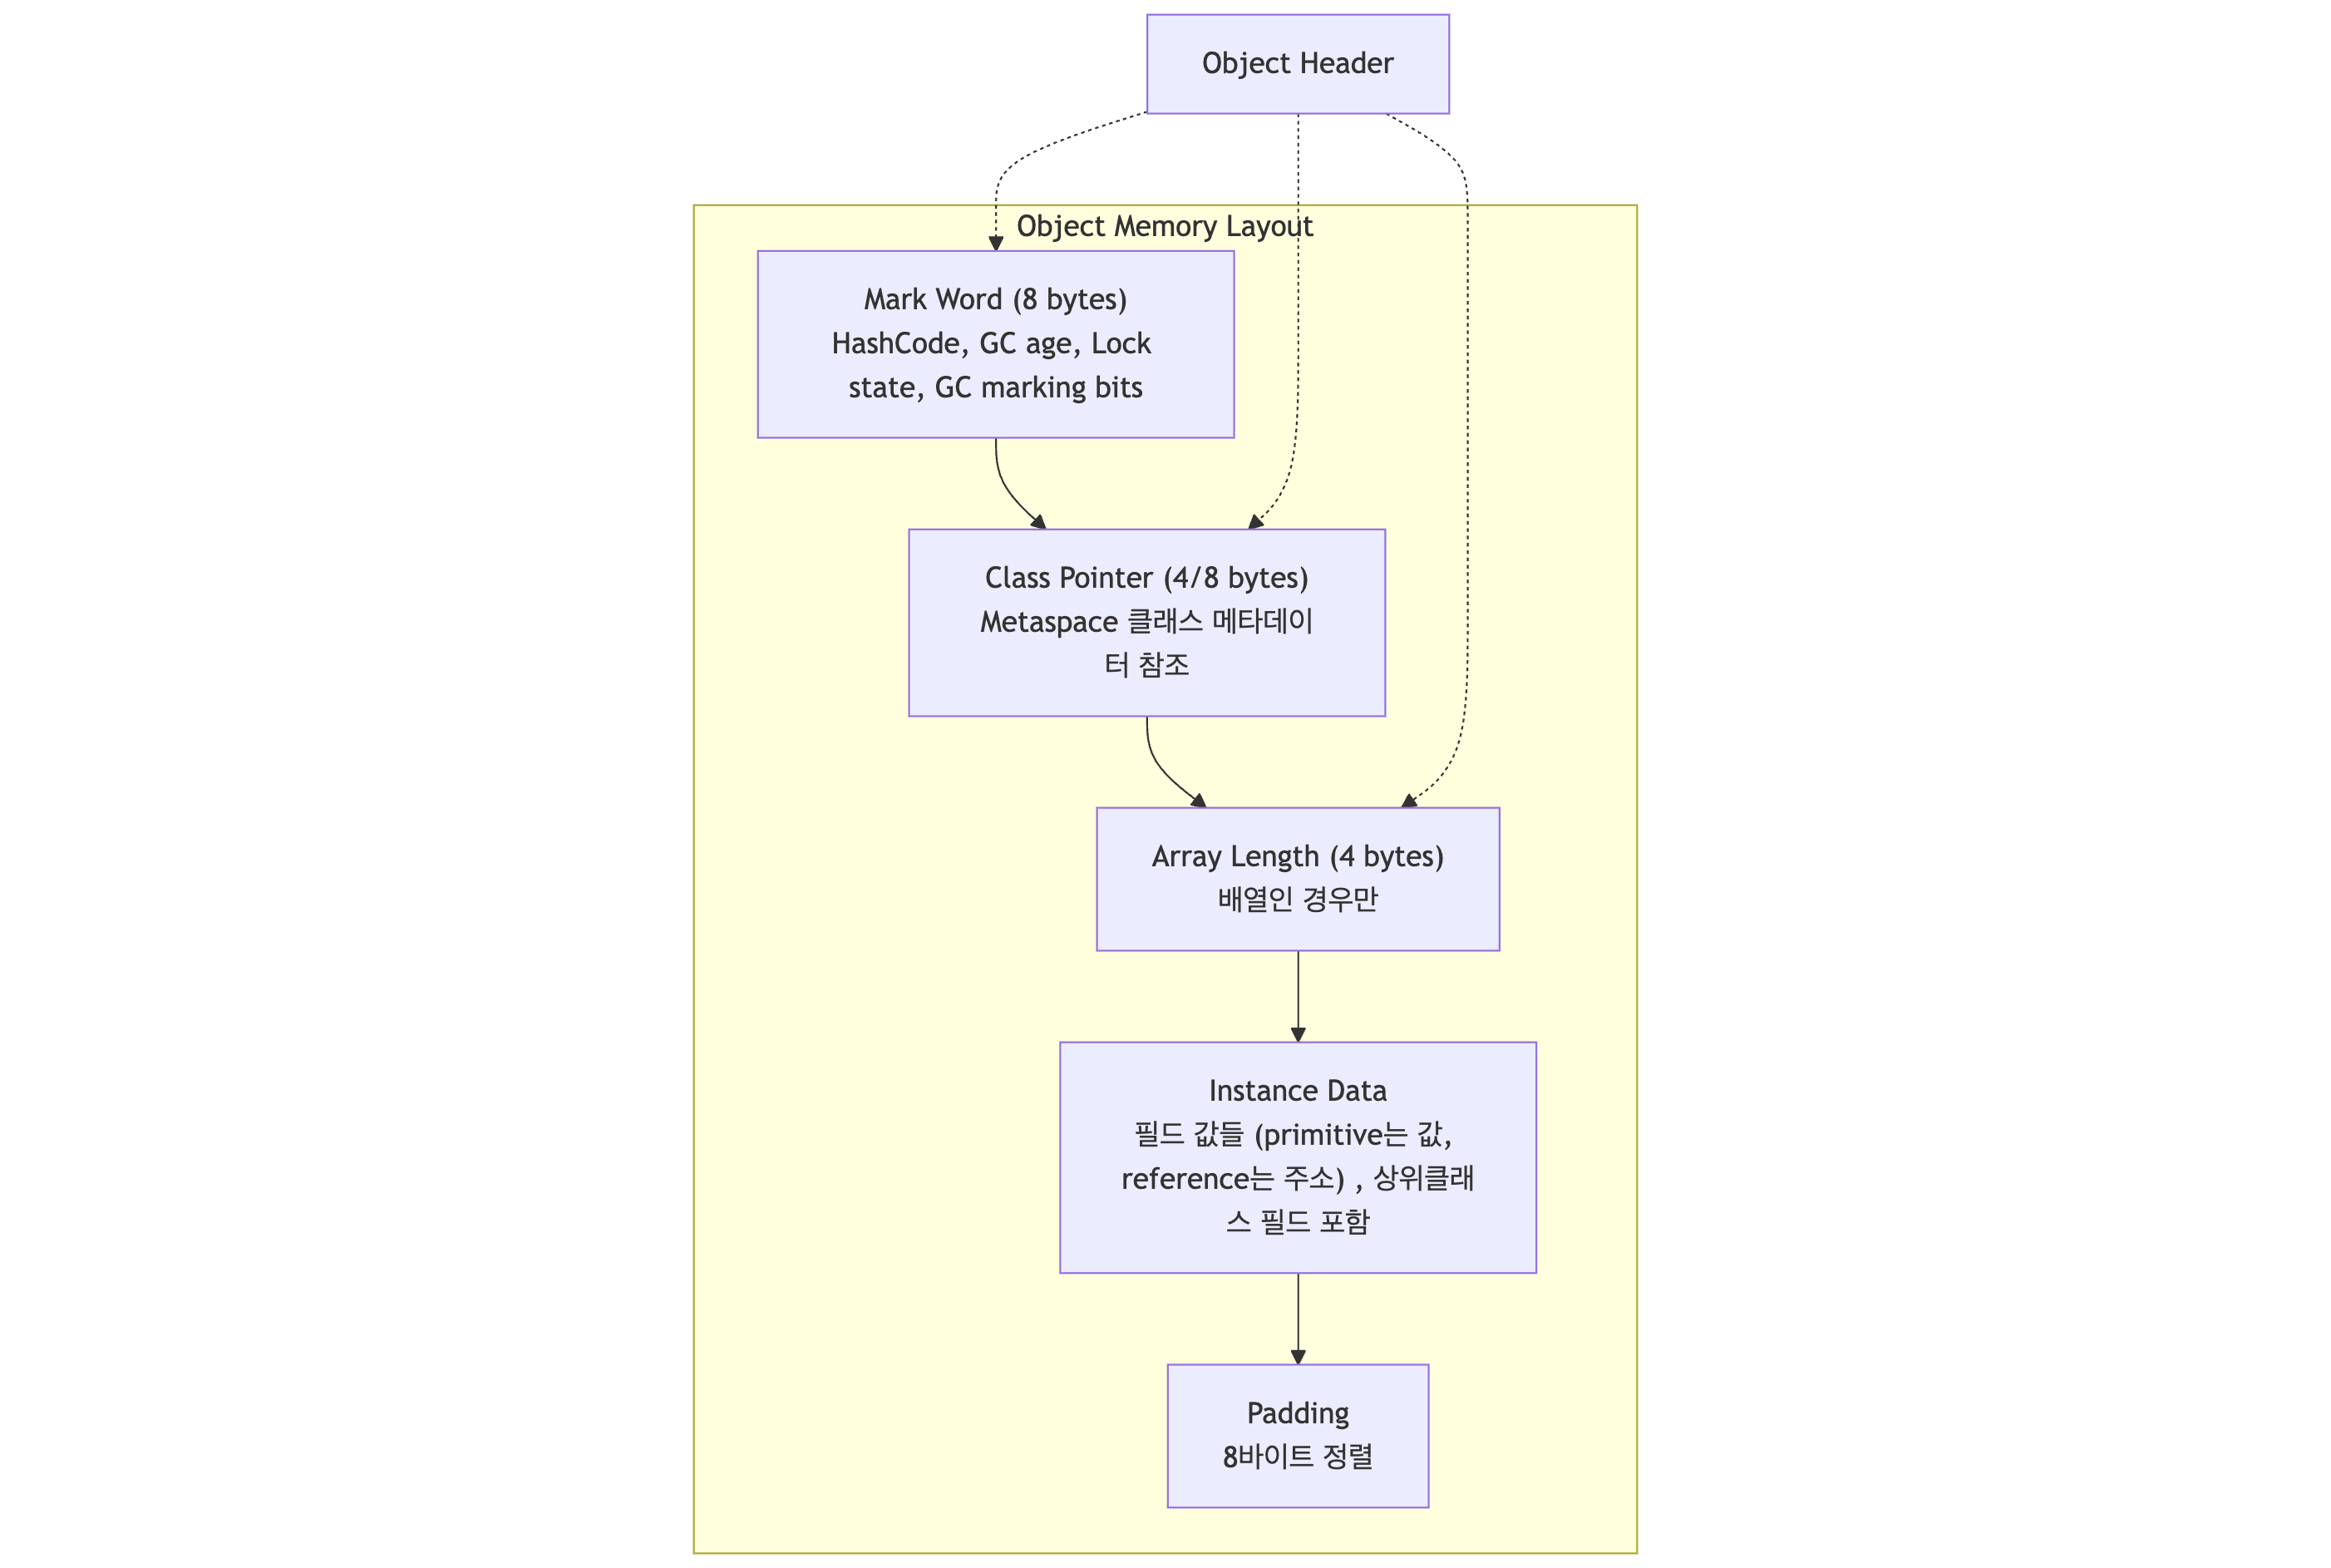
객체는 대략 세 부분으로 구성됩니다.
- Object Header (12~16 byte): Mark Word(락·GC 정보) + Class Pointer
- Instance Data: 필드 값들 (alignment 맞춰 정렬)
- Padding: 8-byte alignment 맞추기 위한 채움
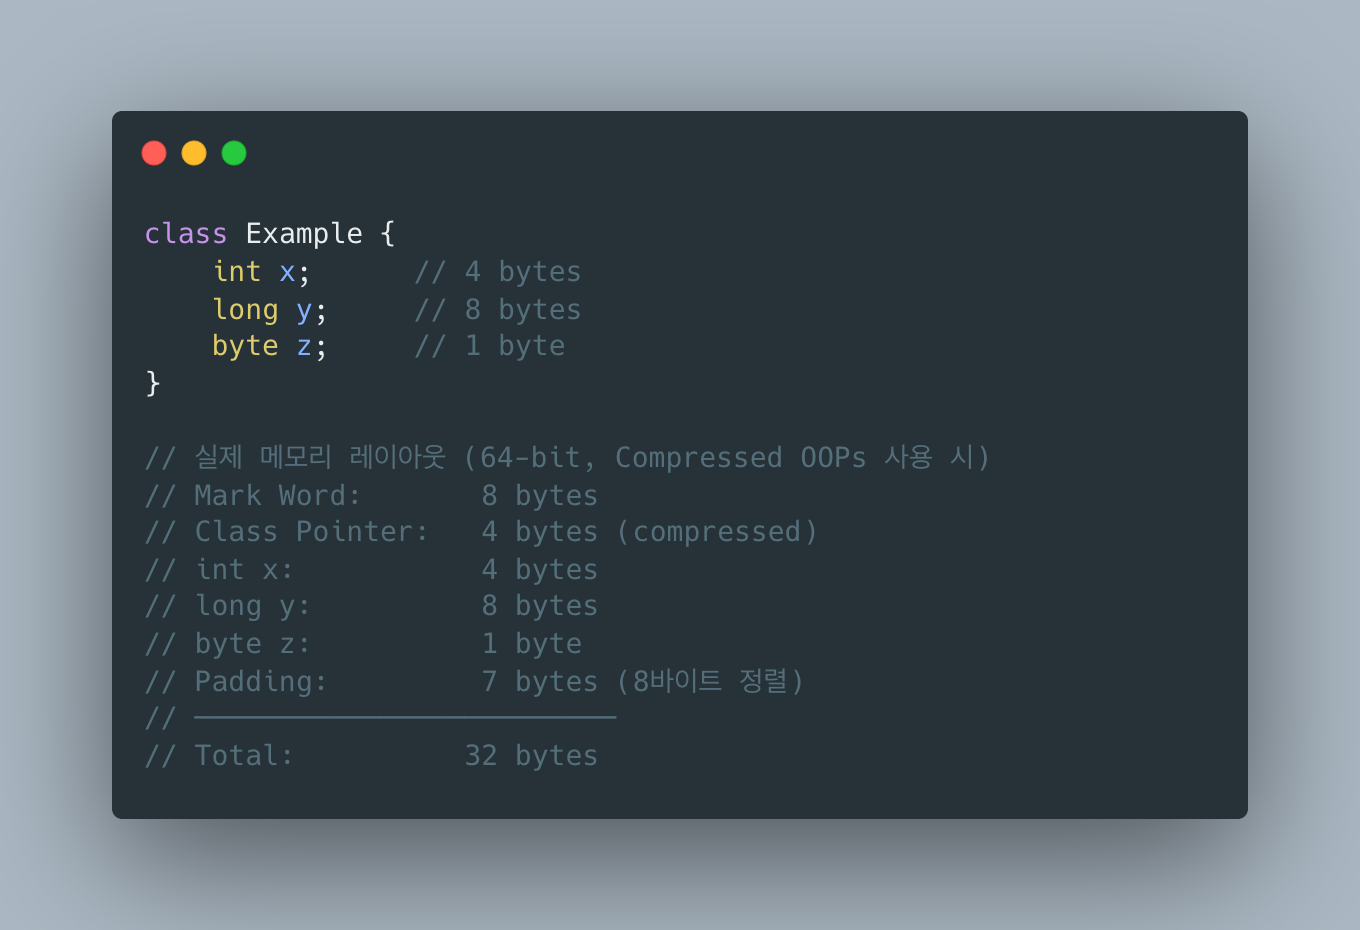
Compressed OOPs (Ordinary Object Pointers):
- Heap 크기가 32GB 미만이면 자동 활성화
- 64-bit 포인터를 32-bit narrow oop로 압축 → 메모리 절약 + 캐시 효율 향상
-XX:+UseCompressedOops # 기본 활성화 (힙 < 32GB)-XX:-UseCompressedOops # 비활성화왜 정확히 32GB까지 가능한지, Elasticsearch가 “힙 26~30GB에서 끊어라”라고 권고하는 이유(zero-based compressed oops)는 ⑤편의 Compressed OOPs와 32GB 한계 섹션에서 깊게 다뤘습니다.
6. String Pool과 Interning
String은 특별 취급됩니다. String Pool에서 중복을 제거합니다.
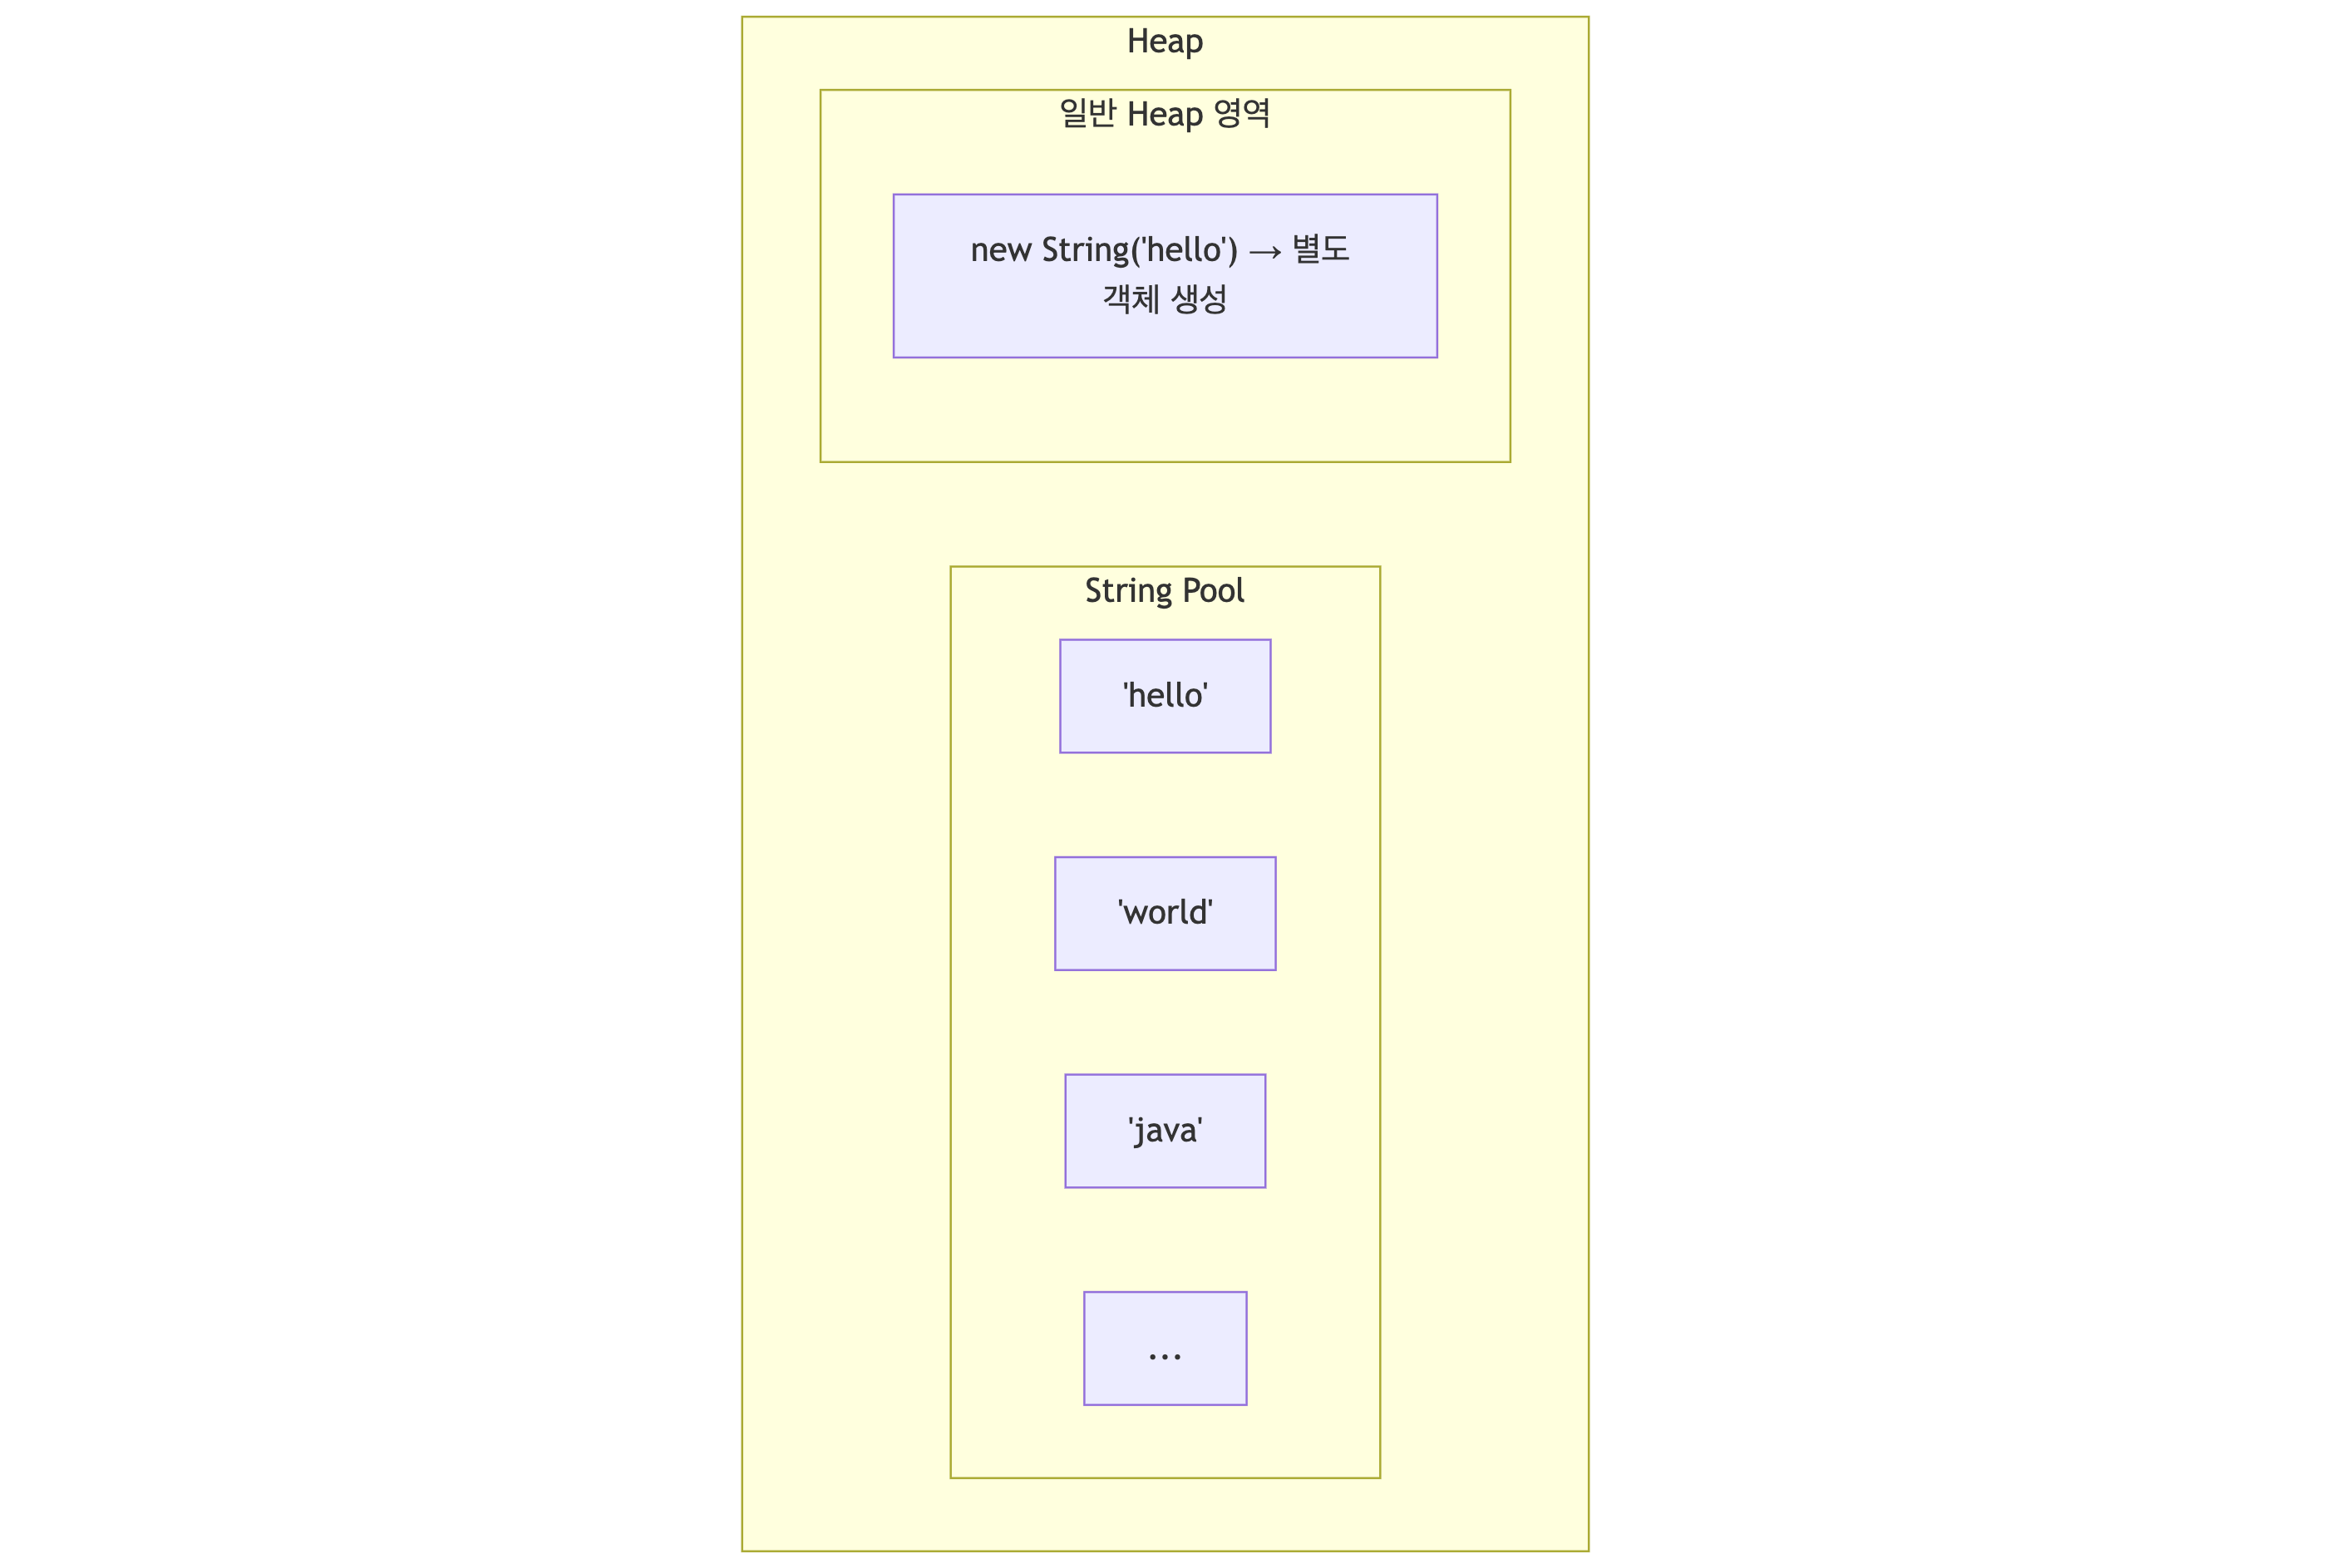
String s1 = "hello"; // String Pool에서 가져옴String s2 = "hello"; // 같은 객체 참조String s3 = new String("hello"); // 새 객체 생성 (Pool 아님)String s4 = s3.intern(); // Pool에 있는 객체 반환
System.out.println(s1 == s2); // true (같은 참조)System.out.println(s1 == s3); // false (다른 객체)System.out.println(s1 == s4); // true (intern으로 Pool 참조)Java 7+: String Pool이 PermGen에서 Heap으로 이동 → GC 대상이 됨.
-XX:StringTableSize=60013 # String Pool 해시 테이블 크기 (기본 60013)7. Garbage Collection의 존재 이유
프로그래머가 직접 메모리를 해제하지 않아도 JVM이 사용하지 않는 객체를 자동 회수해주는 시스템이 GC입니다.
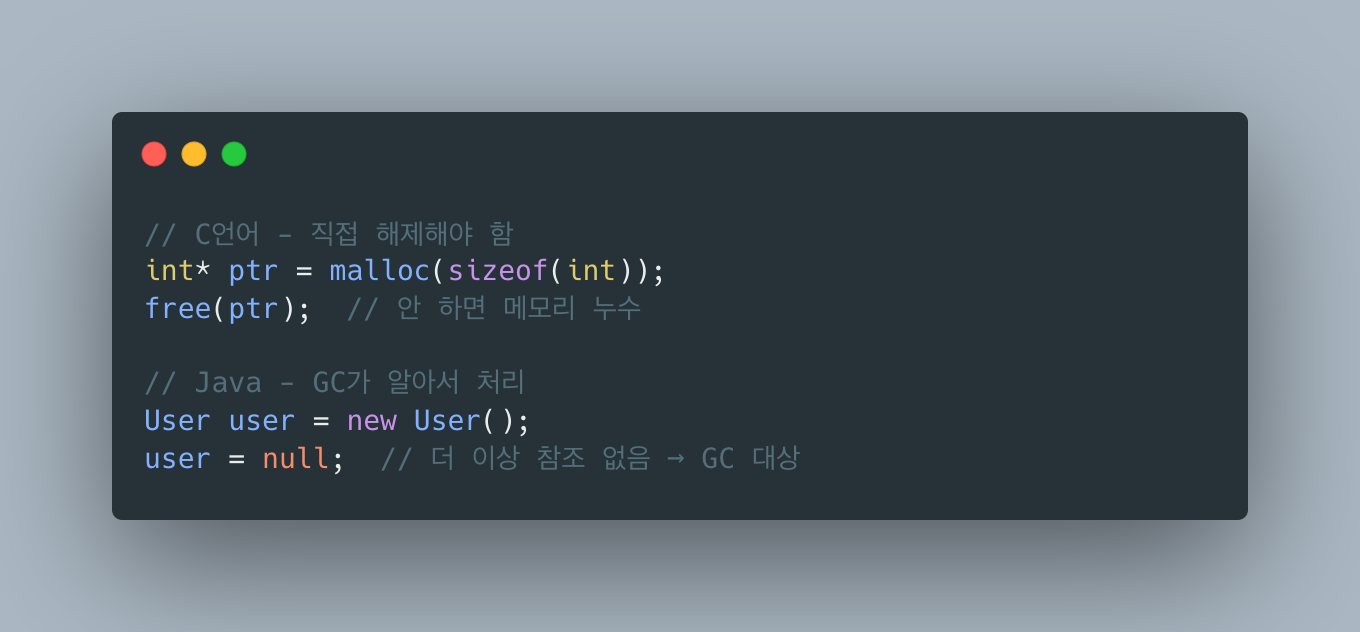
편하지만 공짜는 아닙니다. GC가 돌 때 Stop-the-World(STW)라는 성능 비용이 발생합니다. 그래서 JVM 튜닝의 핵심이 GC 튜닝입니다.
이 시리즈는 GC를 두 편으로 나눠서 다뤘습니다.
- ① JVM Heap의 세대별 구조: 어디서 객체가 살고 죽는지 (Generational Hypothesis, Young/Old, TLAB, Promotion, Premature Promotion)
- ② GC 알고리즘과 Stop-the-World: 어떻게 회수하는지 (Safepoint, Mark-Sweep-Compact, Serial/Parallel/G1/ZGC/Shenandoah, JDK 17 default)
그 다음 편들은 GC 영역 바깥까지 확장합니다:
- ③ JVM Off-heap과 Direct Memory: Heap 바깥의 DirectByteBuffer, mmap, Foreign Memory API
- ④ OS Page Cache가 ES 성능을 결정하는 이유: Linux 커널 관점
- ⑤ 힙 50% 룰 · mmap · Circuit Breaker: Elasticsearch 운영 맥락으로 통합
8. 정리: JVM을 한 문장으로
“JVM은 Class Loader가
.class를 메모리에 얹고, Runtime Data Areas에 객체·스택·메타데이터를 배치하고, Execution Engine(인터프리터 + JIT)이 바이트코드를 기계어로 번역·실행하는 가상 머신이며, 그 과정에서 Heap에 남은 쓰레기를 GC가 주기적으로 회수한다.”
이 한 문장이 성립한다면 0편의 목표는 달성된 것입니다. 구체적인 메모리 내부와 성능 튜닝은 ①편부터 이어서 읽으면 됩니다.
참고 문헌
- The Java Virtual Machine Specification, Java SE 21
- ClassLoader — Java SE 17 API
- Class Loaders in Java - Baeldung
- About G1, PermGen, Metaspace - Oracle Blogs
- Java HotSpot Virtual Machine Performance Enhancements - Oracle
- HotSpot Glossary - OpenJDK
- String Constant Pool - Baeldung
이어지는 글: ① JVM Heap의 세대별 구조
0. Where This Post Fits
This series covers JVM memory across 6 parts, grounded in primary sources (Oracle JDK docs, OpenJDK JEPs, Linux kernel docs). Part 0 — the one you’re reading — is the architecture overview: how the JVM itself is structured. Heap internals (Young/Old/Eden), GC algorithms (G1/ZGC/Shenandoah), off-heap memory, and the OS page cache are each given their own chapters (①–⑤), so this post focuses only on the big picture:
- how the JVM loads
.classfiles into memory (Class Loader) - which memory areas it uses during execution (Runtime Data Areas)
- how it turns bytecode into machine code (Execution Engine, JIT)
- how objects are laid out in the Heap (Object Layout)
1. JVM Architecture Overview
The JVM (Java Virtual Machine) is a virtual machine that executes Java bytecode. It’s the core component that enables “Write Once, Run Anywhere.”
Three subsystems:
- Class Loader Subsystem — reads
.classfiles and links them into memory - Runtime Data Areas — memory used during execution (Method Area, Heap, Stack, PC Register, Native Method Stack)
- Execution Engine — runs bytecode via Interpreter / JIT compilation
2. Class Loader Subsystem
2.1 Three-Level Class Loader Hierarchy (JDK 9+)
After Java 9’s module system, the built-in class loaders were redefined. The key change: Extension class loader was replaced by Platform class loader.
| Level | Name | Role |
|---|---|---|
| 1 | Bootstrap | Loads JDK core classes (java.lang.*, etc.). No parent (null). |
| 2 | Platform (JDK 9+) | Loads Java SE Platform APIs and JDK runtime classes (replaces the old Extension loader) |
| 3 | Application (System) | Loads classes from application classpath/module path |
System.out.println(String.class.getClassLoader()); // null (Bootstrap)System.out.println(javax.sql.DataSource.class.getClassLoader()); // PlatformClassLoaderSystem.out.println(MyClass.class.getClassLoader()); // AppClassLoaderSource: ClassLoader — Java SE 17 API
2.2 Parent Delegation Model
How it works:
- When a class load request arrives, delegate to the parent first
- If the parent can’t find it, try loading it yourself
- If nobody can find it, throw
ClassNotFoundException
Why this design?
- Security: prevents loading malicious
java.lang.String(Bootstrap always wins) - Consistency: core classes always use the same version
Source: Class Loaders in Java - Baeldung
2.3 Loading → Linking → Initialization
Loading: reads .class bytes and builds the class structure in the Method Area.
Linking (3 phases):
- Verify: validates bytecode against the JVM spec (security / type safety)
- Prepare: allocates static fields and initializes them with defaults (
0,null,false) - Resolve: converts symbolic references to actual memory addresses (may be lazy)
Initialization
Assigns actual values to static variables and runs static {} blocks. The class becomes usable.
3. Runtime Data Areas
Memory areas used by the JVM during program execution.
Split into shared and per-thread regions:
- Shared by all threads: Method Area (Metaspace), Heap
- Per-thread: JVM Stack, PC Register, Native Method Stack
3.1 Method Area (Metaspace)
- Before Java 8: PermGen (Permanent Generation)
- After Java 8: Metaspace (uses Native Memory)
Contents:
- Class structures (fields, methods)
- Runtime Constant Pool
- Method bytecode
- Static variables
-XX:MetaspaceSize=128m # initial size-XX:MaxMetaspaceSize=256m # max size (default: unlimited)Why PermGen → Metaspace
- PermGen was part of the heap with a hard size limit →
OutOfMemoryError: PermGen spacewas common. - Metaspace uses Native Memory and can auto-expand.
Note: since Java 7, static variable references moved to the Heap. Only class metadata remains in Metaspace.
Source: About G1 Garbage Collector, Permanent Generation, and Metaspace - Oracle
3.2 Heap
All objects and arrays are allocated here, and it’s the primary target of GC.
User user = new User(); // created on Heapint[] arr = new int[10]; // arrays tooHeap’s generational structure (Young/Old, Eden/Survivor), the Minor GC → Promotion → Full GC flow, and tuning params like NewRatio / SurvivorRatio are covered in depth in Part ① with primary sources.
3.3 JVM Stack (per thread)
Each thread has its own stack — a collection of Stack Frames.
Stack Frame components:
- Local Variables Array: locals and method parameters
- Operand Stack: operation intermediate values
- Frame Data: return address, exception table references
public int calculate(int a, int b) { int sum = a + b; // Local Variables: [this, a, b, sum] return sum * 2;}Stack size:
-Xss512k # per-thread stack size (default: 1MB)StackOverflowError:
void infinite() { infinite(); } // infinite recursion → overflow3.4 PC Register & Native Method Stack
PC Register — holds the address of the currently executing instruction, per-thread. (Undefined while executing native methods.)
Native Method Stack — stack for native methods (C/C++) called via JNI.
4. Execution Engine
Converts bytecode into machine code and executes it. HotSpot pairs Interpreter + JIT Compiler.
4.1 Interpreter
Reads and executes bytecode line by line. Fast to start, slow when repeated.
4.2 JIT Compiler (Just-In-Time)
Compiles frequently executed code (Hot Spots) into native code and caches it.
- Bytecode (run by interpreter)
- Profiling (execution counts per method/loop)
- Hot Spot detection (threshold exceeded)
- Compilation (native code generation)
→ On subsequent calls: method call → check code cache → run native code directly.
4.3 Tiered Compilation
HotSpot combines two JIT compilers in a tiered way.
| Tier | Compiler | Purpose |
|---|---|---|
| 0 | Interpreter | Initial run, profiling |
| 1–3 | C1 (Client) | Fast compile, lighter optimizations, profiling data |
| 4 | C2 (Server) | Aggressive optimization, longer compile, peak performance |
Code is promoted 0 → 3 → 4: run cheap first with C1, recompile only the truly hot code with C2.
4.4 JIT Optimizations
1) Inlining — replaces method calls with the body
2) Loop Unrolling — reduces loop iterations
3) Escape Analysis — objects that don’t escape the method can live on the stack
4) Dead Code Elimination — removes unused code
-XX:+PrintCompilation # print compiled methods-XX:CompileThreshold=10000 # only valid when Tiered is OFF-XX:-TieredCompilation # disable Tiered CompilationNote: with Tiered Compilation enabled (default since Java 8+),
CompileThresholdis ignored — each tier has its own.
Source: Java HotSpot Virtual Machine Performance Enhancements - Oracle
5. Object Memory Layout
How Java objects are laid out in the Heap.
An object is roughly three parts:
- Object Header (12–16 bytes) — Mark Word (lock/GC info) + Class Pointer
- Instance Data — field values (aligned)
- Padding — to meet 8-byte alignment
Compressed OOPs (Ordinary Object Pointers):
- Enabled automatically when Heap size is below 32GB
- Compresses 64-bit pointers to 32-bit narrow oops → saves memory + better cache locality
-XX:+UseCompressedOops # default on (heap < 32GB)-XX:-UseCompressedOops # disableThe precise reason why 32GB is the cap, and why Elasticsearch recommends 26–30GB (zero-based compressed oops), is covered in Part ⑤’s Compressed OOPs and the 32GB boundary section.
Source: HotSpot Glossary - OpenJDK
6. String Pool and Interning
Strings get special treatment. The String Pool deduplicates them.
String s1 = "hello"; // from String PoolString s2 = "hello"; // same referenceString s3 = new String("hello"); // new object (not pooled)String s4 = s3.intern(); // returns the pooled one
System.out.println(s1 == s2); // trueSystem.out.println(s1 == s3); // falseSystem.out.println(s1 == s4); // trueJava 7+: String Pool moved from PermGen to Heap → now GC-able.
-XX:StringTableSize=60013 # pool hashtable size (default 60013)Source: String Constant Pool - Baeldung
7. Why Garbage Collection Exists
Instead of the programmer freeing memory manually, the JVM automatically reclaims objects that aren’t in use.
Convenient, but not free — GC introduces Stop-the-World (STW) pauses. That’s why “JVM tuning” mostly means “GC tuning.”
This series splits GC into two parts:
- ① JVM Heap Internals — where objects live and die (Generational Hypothesis, Young/Old, TLAB, Promotion, Premature Promotion)
- ② GC Algorithms and Stop-the-World — how collection works (Safepoint, Mark-Sweep-Compact, Serial/Parallel/G1/ZGC/Shenandoah, JDK 17 default)
Then we go beyond the heap:
- ③ JVM Off-heap and Direct Memory — DirectByteBuffer, mmap, Foreign Memory API
- ④ Why OS Page Cache Determines ES Performance — the Linux kernel view
- ⑤ 50% Heap Rule · mmap · Circuit Breaker — Elasticsearch operations tying it all together
8. JVM in One Sentence
“The JVM is a virtual machine where the Class Loader brings
.classfiles into memory, the Runtime Data Areas hold objects, stacks, and metadata, the Execution Engine (Interpreter + JIT) translates bytecode to machine code and runs it, and in the background GC periodically reclaims unreachable objects from the Heap.”
If that sentence now makes sense, Part 0 has done its job. Keep reading from Part ① for the memory internals and performance tuning.
References
- The Java Virtual Machine Specification, Java SE 21
- ClassLoader — Java SE 17 API
- Class Loaders in Java - Baeldung
- About G1, PermGen, Metaspace - Oracle Blogs
- Java HotSpot Virtual Machine Performance Enhancements - Oracle
- HotSpot Glossary - OpenJDK
- String Constant Pool - Baeldung
Next: ① JVM Heap Internals

댓글
댓글 수정/삭제는 GitHub Discussions에서 가능합니다.