stress 테스트로 단일 서버 한계 확인: 튜닝 실패에서 배운 것
목차
이전 글
캐싱 전략에서 Caffeine L1 캐시를 도입하여 전체 평균 776ms→54ms(14배), cascade failure를 해소했습니다. Trie 자동완성에서 검색 로그 기반 인기순 자동완성 + 자모 검색을 구현했습니다.
이제 단일 서버가 어디서 터지는지 확인하여 분산 전환의 근거를 만듭니다.
이전 글 요약
| 글 | 개선 내용 | 결과 |
|---|---|---|
| 캐싱 전략 | Caffeine L1 캐시 | 전체 응답 776ms→54ms (14.4x), 자동완성 히트율 99.9% |
| Trie 자동완성 | Trie + 검색 로그 + 자모 | 사전순→인기순, “삼ㅅ”→“삼성전자” |
개요
이 글의 목적
stress 테스트로 단일 서버의 한계점(breaking point)을 수치로 확인합니다. 한계를 넘어가면 어떤 현상이 발생하는지(P99 폭발? 에러율 증가? OOM?)를 기록하고, JVM/Tomcat 튜닝으로 한계를 밀어올릴 수 있는지 검증합니다.
왜 stress 테스트인가
| 테스트 | 목적 | VU | 시간 | 이 프로젝트에서의 의미 |
|---|---|---|---|---|
| smoke | 동작 확인 | 5 | 2분 | ”안 터지나?” (이미 수행 완료) |
| load | 예상 트래픽 성능 | 100 | 20분 | ”정상 부하에서 성능은?” (이미 수행 완료) |
| stress | 한계점 탐색 | 200 | 25분 | ”어디서 터지나?” (이 글에서 수행) |
| soak | 장기 안정성 | 50 | 4시간 | 분산 인프라 구축 후 |
테스트 환경
| 항목 | 값 |
|---|---|
| 서버 | Oracle Cloud ARM (Ampere A1), 2코어, 12GB RAM |
| JVM | Java 25, -Xmx1g |
| DB | MySQL 8.0, InnoDB Buffer Pool 2GB |
| 데이터 | posts 1,215만 건, Lucene 인덱스 ~20GB |
| k6 | monitoring-loki 서버에서 실행, InfluxDB + Grafana 연동 |
k6 stress 프로필

25분 설정 근거: k6 공식 권장은 ramp-up의 5배 이상 지속이므로 이상적으로는 45분+. 하지만 ARM 2코어 서버에서 200 VU를 30분 이상 유지하면 서버 자체가 불안정해질 수 있으므로, 과부하 구간 10분 + 회복 구간 5분 = 25분으로 설정. 한계점 확인이 목적이므로 지속 시간보다 VU 수(200)가 더 중요.
예상 병목 지점
단일 서버(ARM 2코어, 12GB)에서 발생 가능한 병목 4가지:
1. CPU 포화
ARM 2코어에서 Lucene 검색(BM25 + DocValues + 정렬)은 CPU 집약적. Caffeine 캐시 히트율이 96%이지만, 4%의 캐시 미스가 동시에 발생하면 CPU 포화 가능.
2. DB 커넥션 풀 고갈
HikariCP 풀 사이즈 20. 동시 200 요청 중 DB 조회가 20개를 초과하면 대기. HikariCP 풀 사이즈 공식(PostgreSQL 기준이지만 MySQL에도 적용 가능):
connections = (core_count * 2) + effective_spindle_countARM 2코어: (2 * 2) + 1 = 5 (최소값)권장: 10~20 (워크로드에 따라 조정)3. JVM 힙 메모리 압박
현재 -Xmx1g에서 Trie(~66MB) + Caffeine 3개(~100MB) + Spring Context(~200MB) + GC 여유(~200MB). stress 시 동시 200 요청의 임시 객체가 힙을 압박하면 Full GC(STW) 가능.
4. Tomcat 스레드 풀
Spring Boot 기본 Tomcat 스레드: 200개. 동시 200 VU가 모두 활성이면 스레드 풀이 꽉 차고 추가 요청은 큐 대기.
1차 stress 결과 (튜닝 전, 200 VU, 25분)
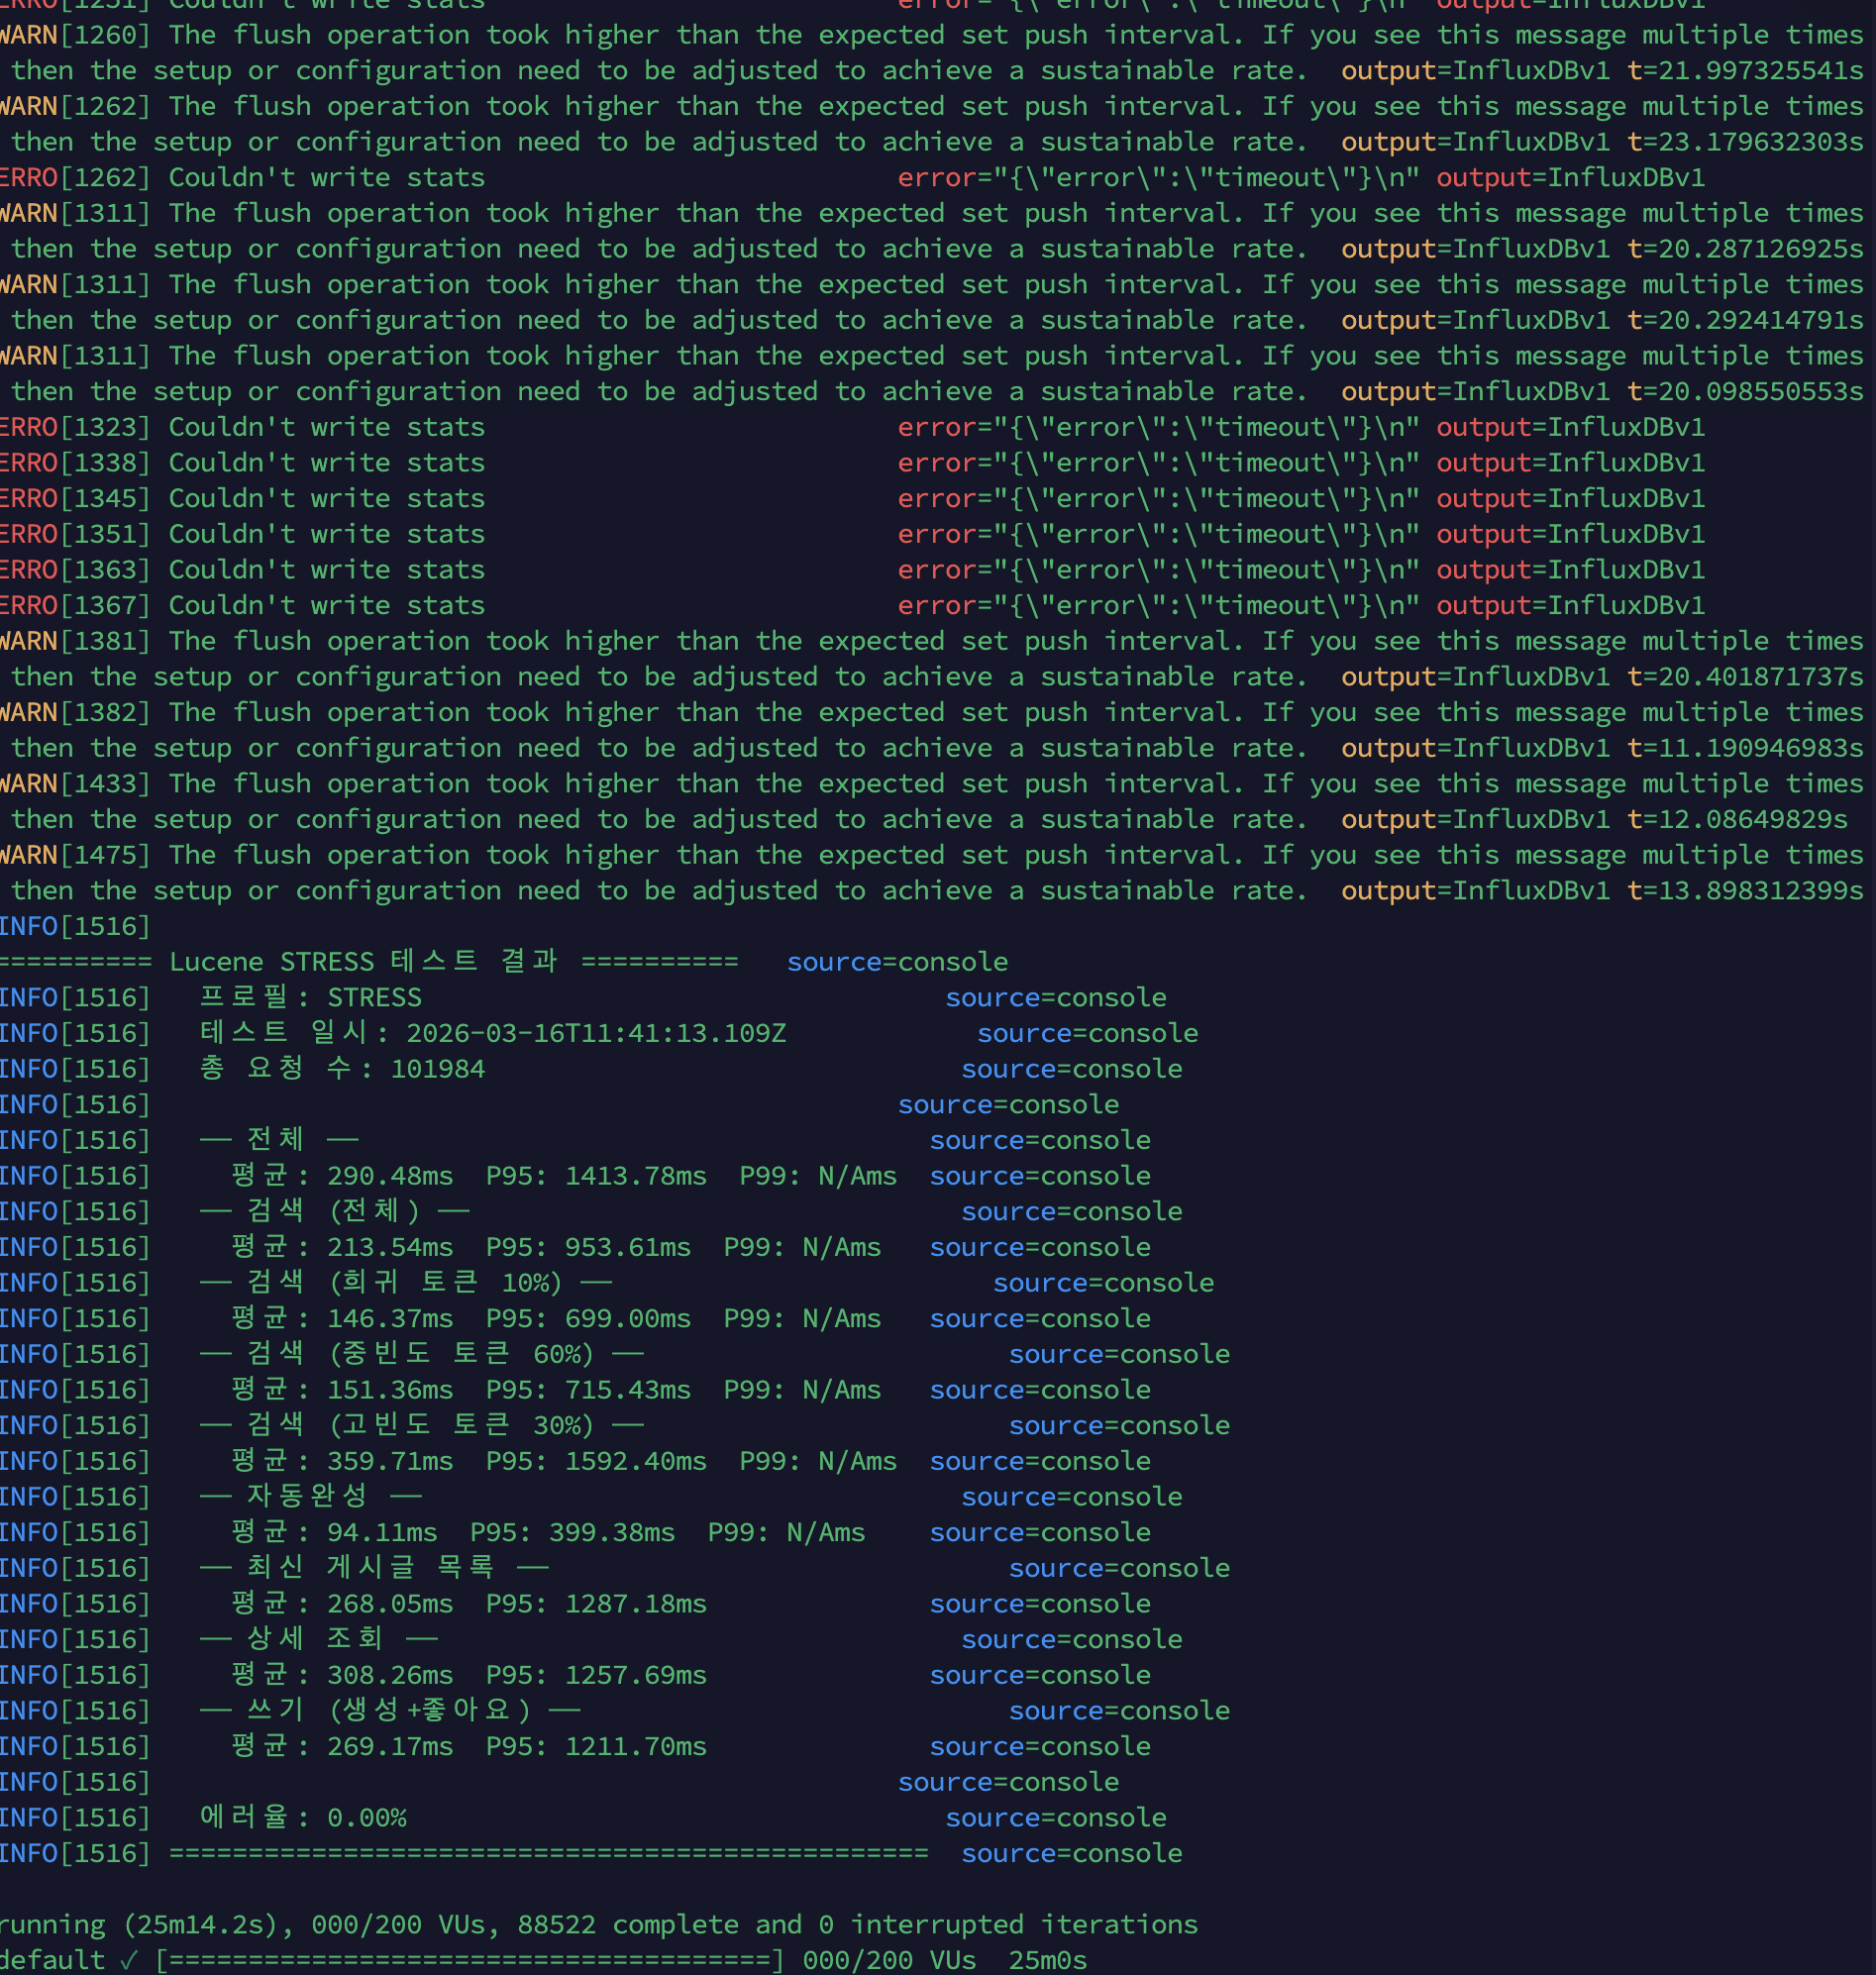
k6 콘솔 결과
| 시나리오 | 평균 | P95 | Max |
|---|---|---|---|
| 전체 | 290ms | 1,413ms | - |
| 검색 (전체) | 213ms | 953ms | - |
| 검색 (희귀 10%) | 146ms | 699ms | 6.88s |
| 검색 (중빈도 60%) | 151ms | 715ms | 6.76s |
| 검색 (고빈도 30%) | 359ms | 1,592ms | 6.92s |
| 자동완성 | 94ms | 399ms | 4.45s |
| 최신 게시글 목록 | 268ms | 1,287ms | 4.94s |
| 상세 조회 | 308ms | 1,257ms | 6.20s |
| 쓰기 (생성+좋아요) | 269ms | 1,211ms | - |
| 에러율 | 0.00% | ||
| 총 요청 수 | 101,984건 |
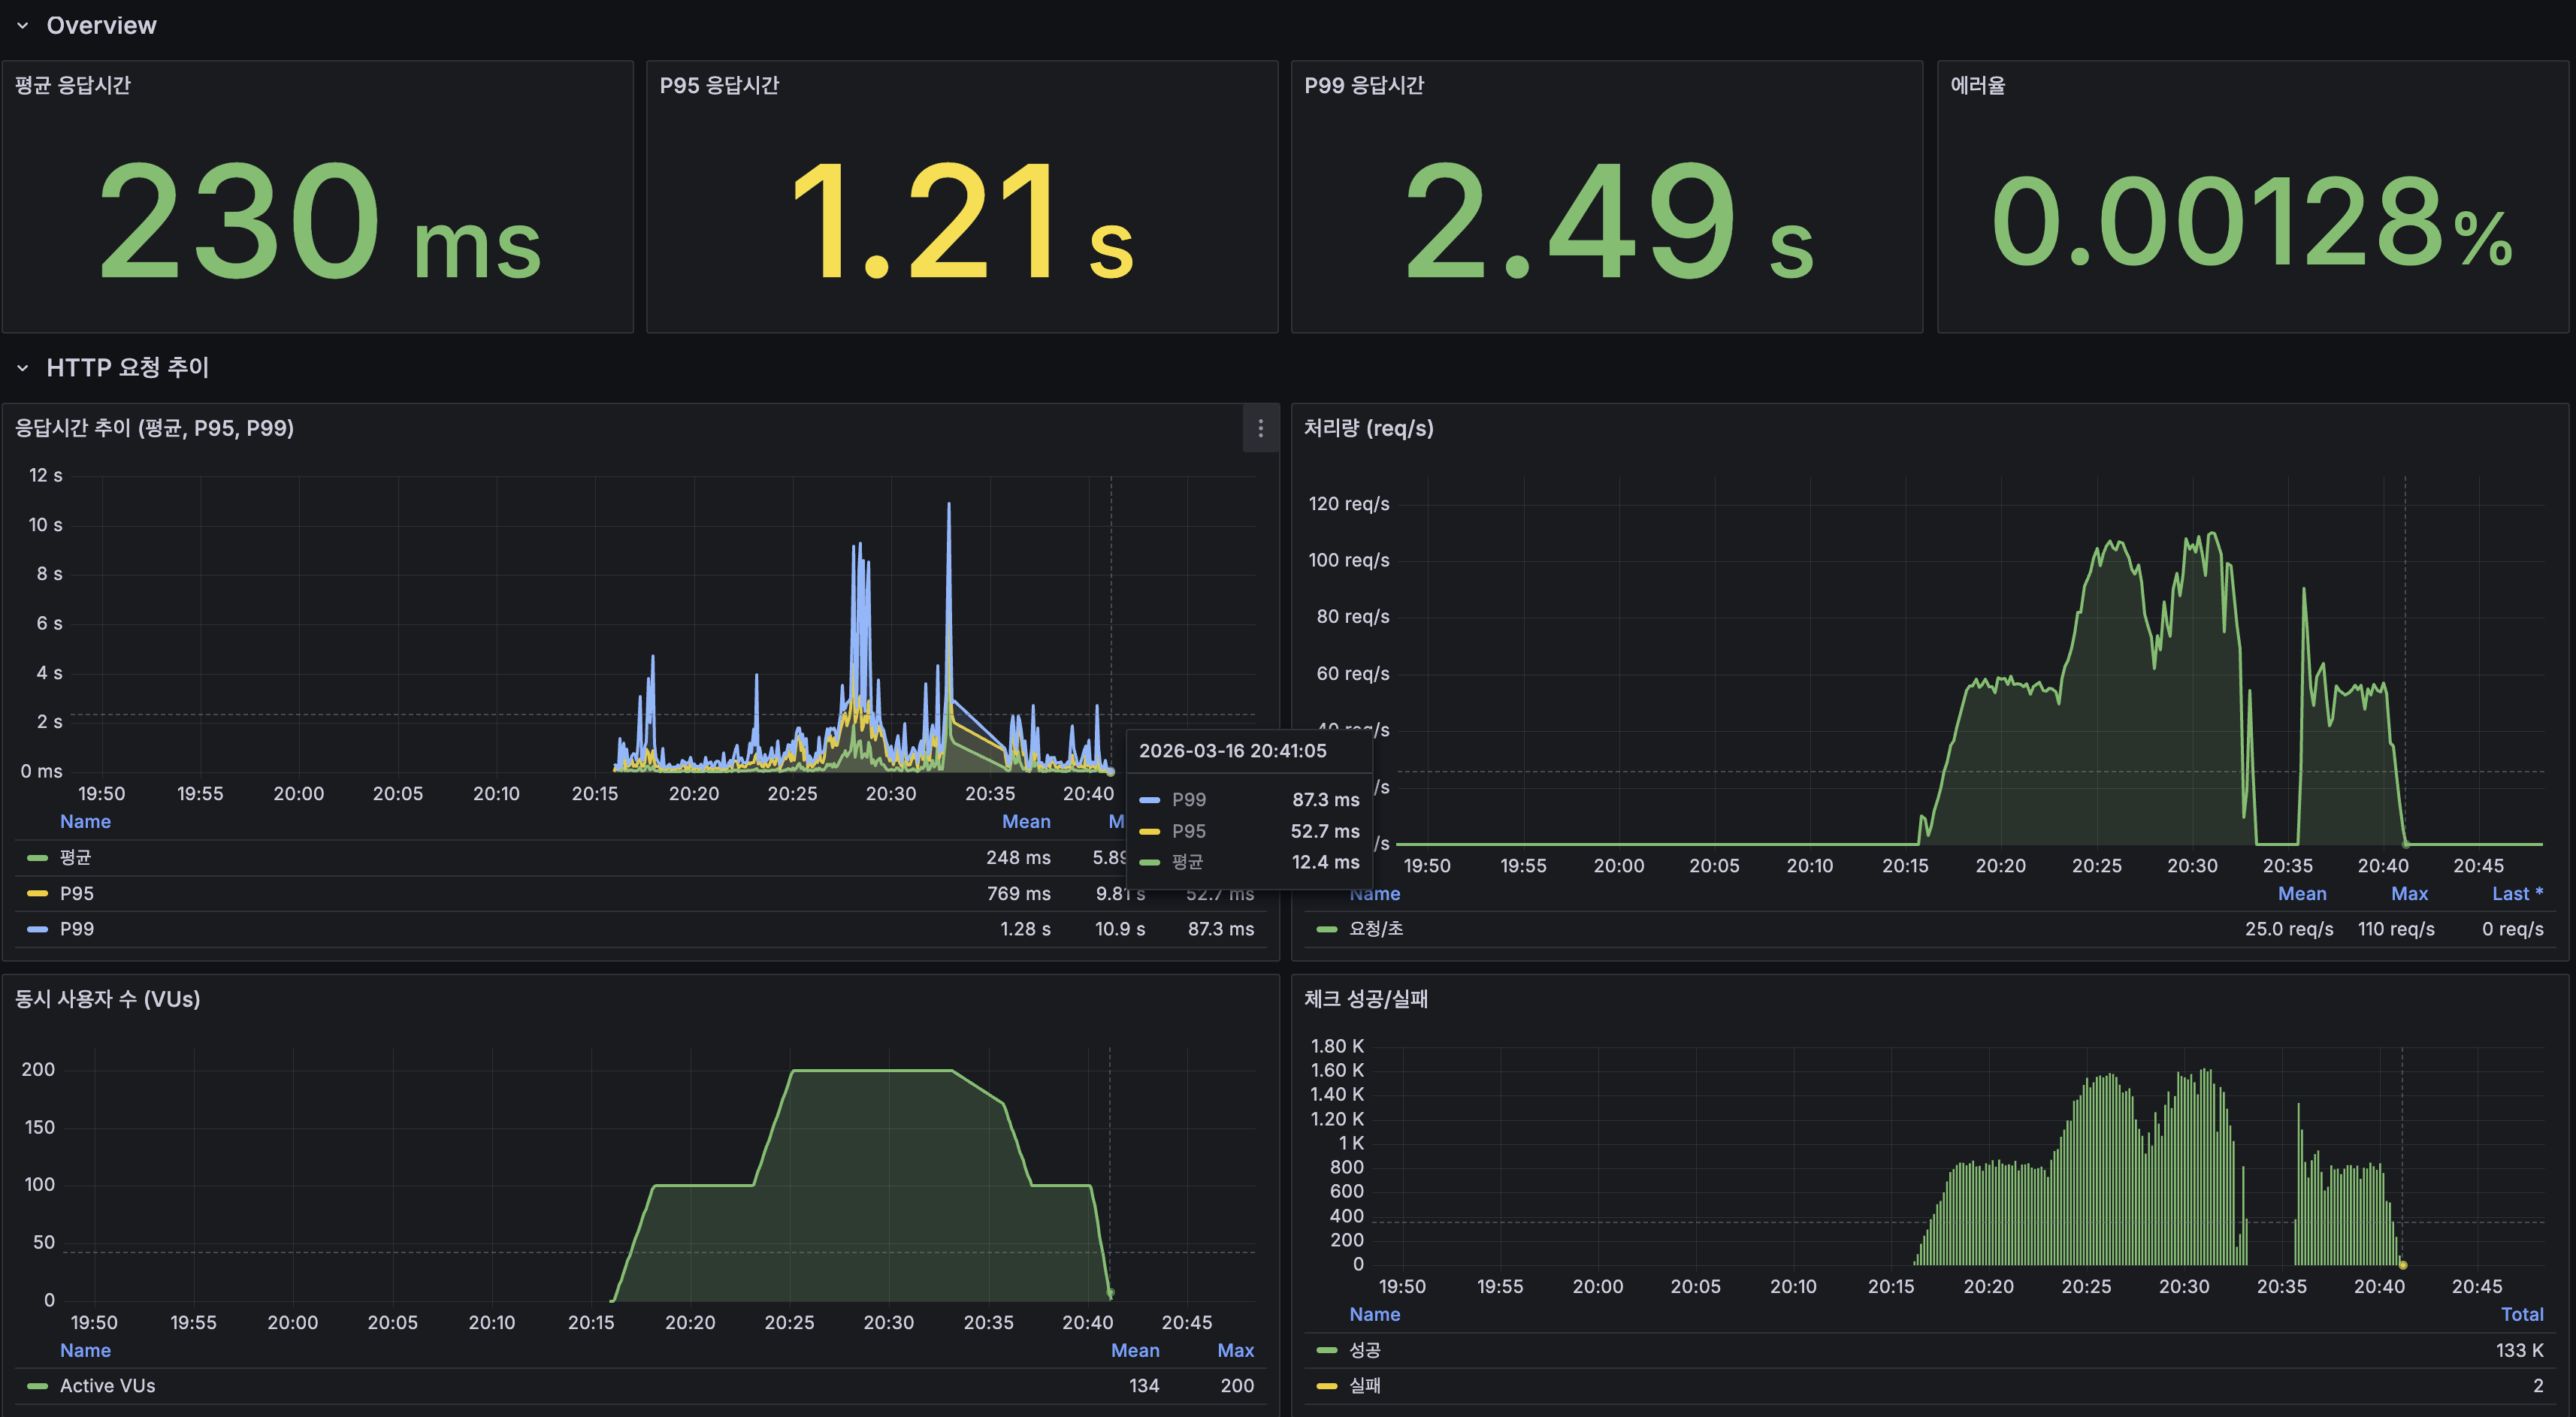
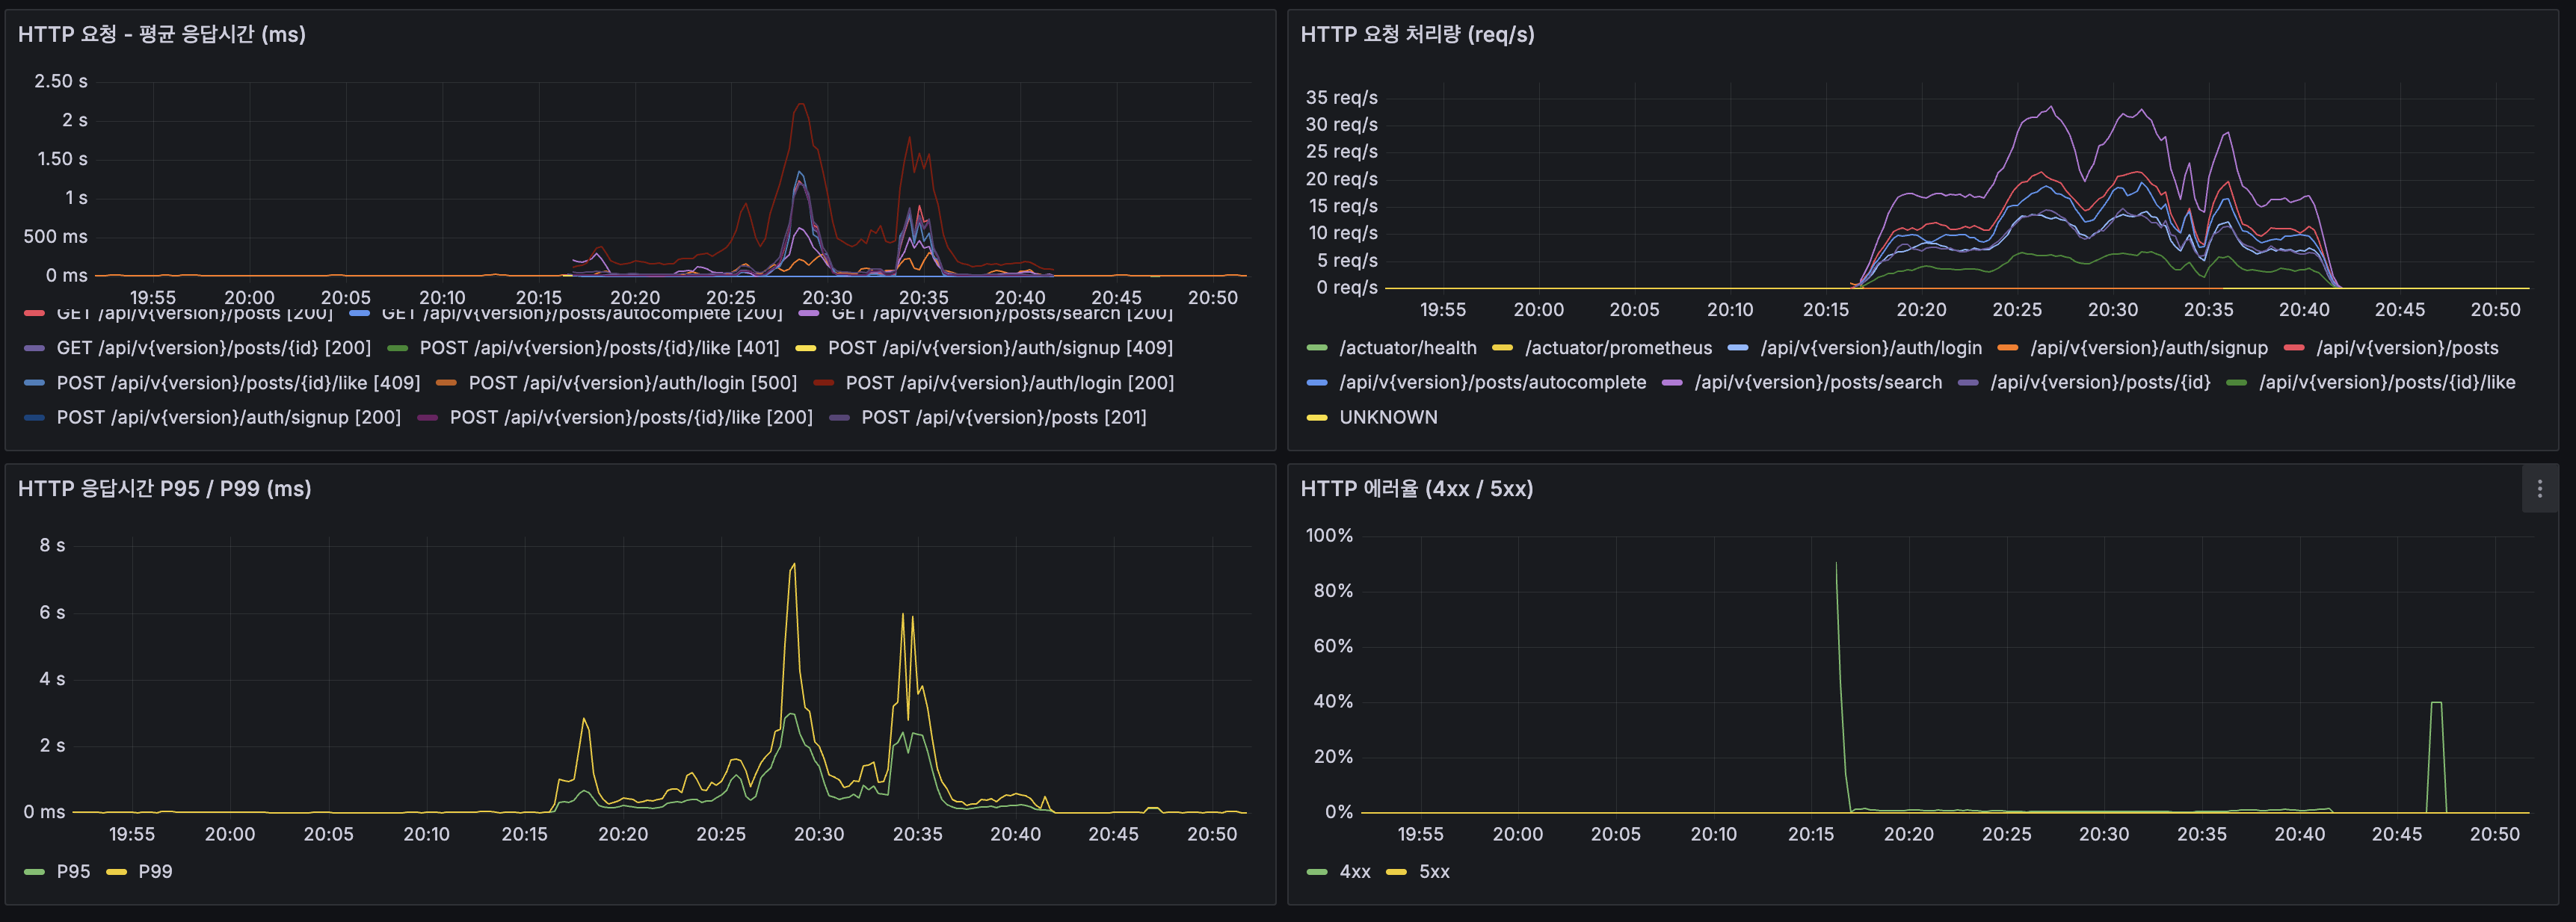
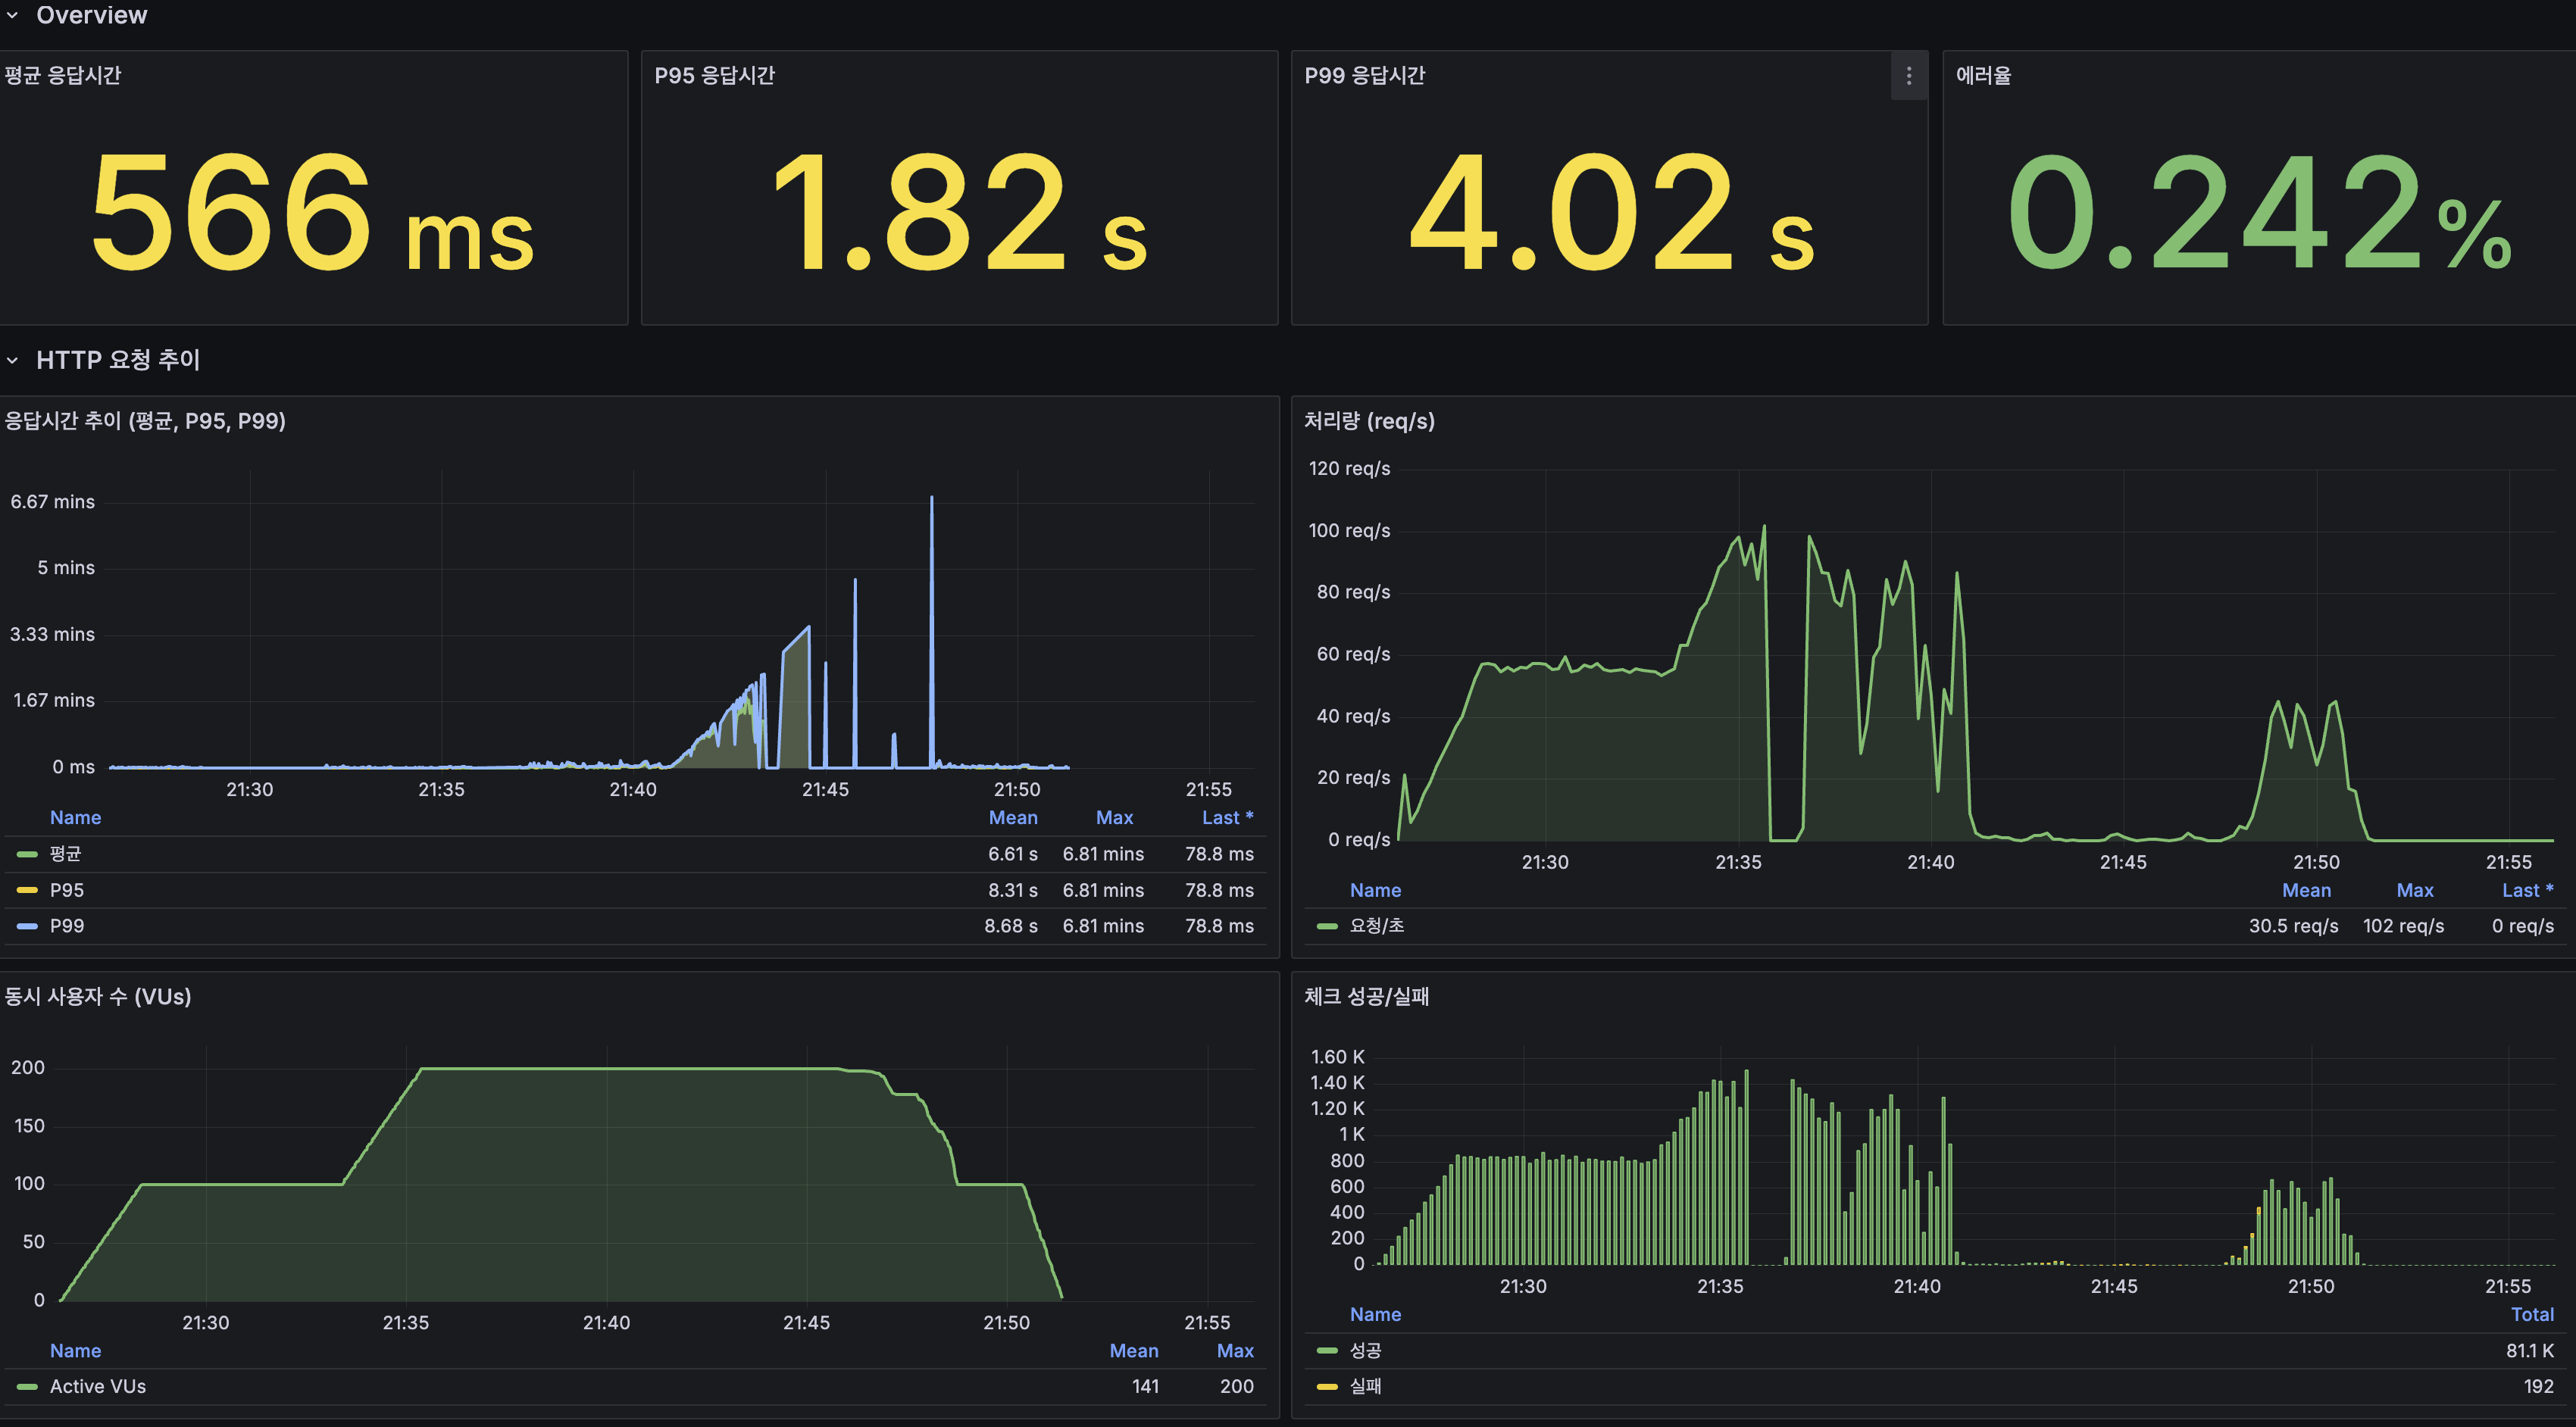
Grafana Overview
| 지표 | 값 |
|---|---|
| 평균 응답시간 | 230ms |
| P95 | 1.21s |
| P99 | 2.49s |
| 에러율 | 0.00128% |
| 최대 TPS | 110 req/s |
병목 분석
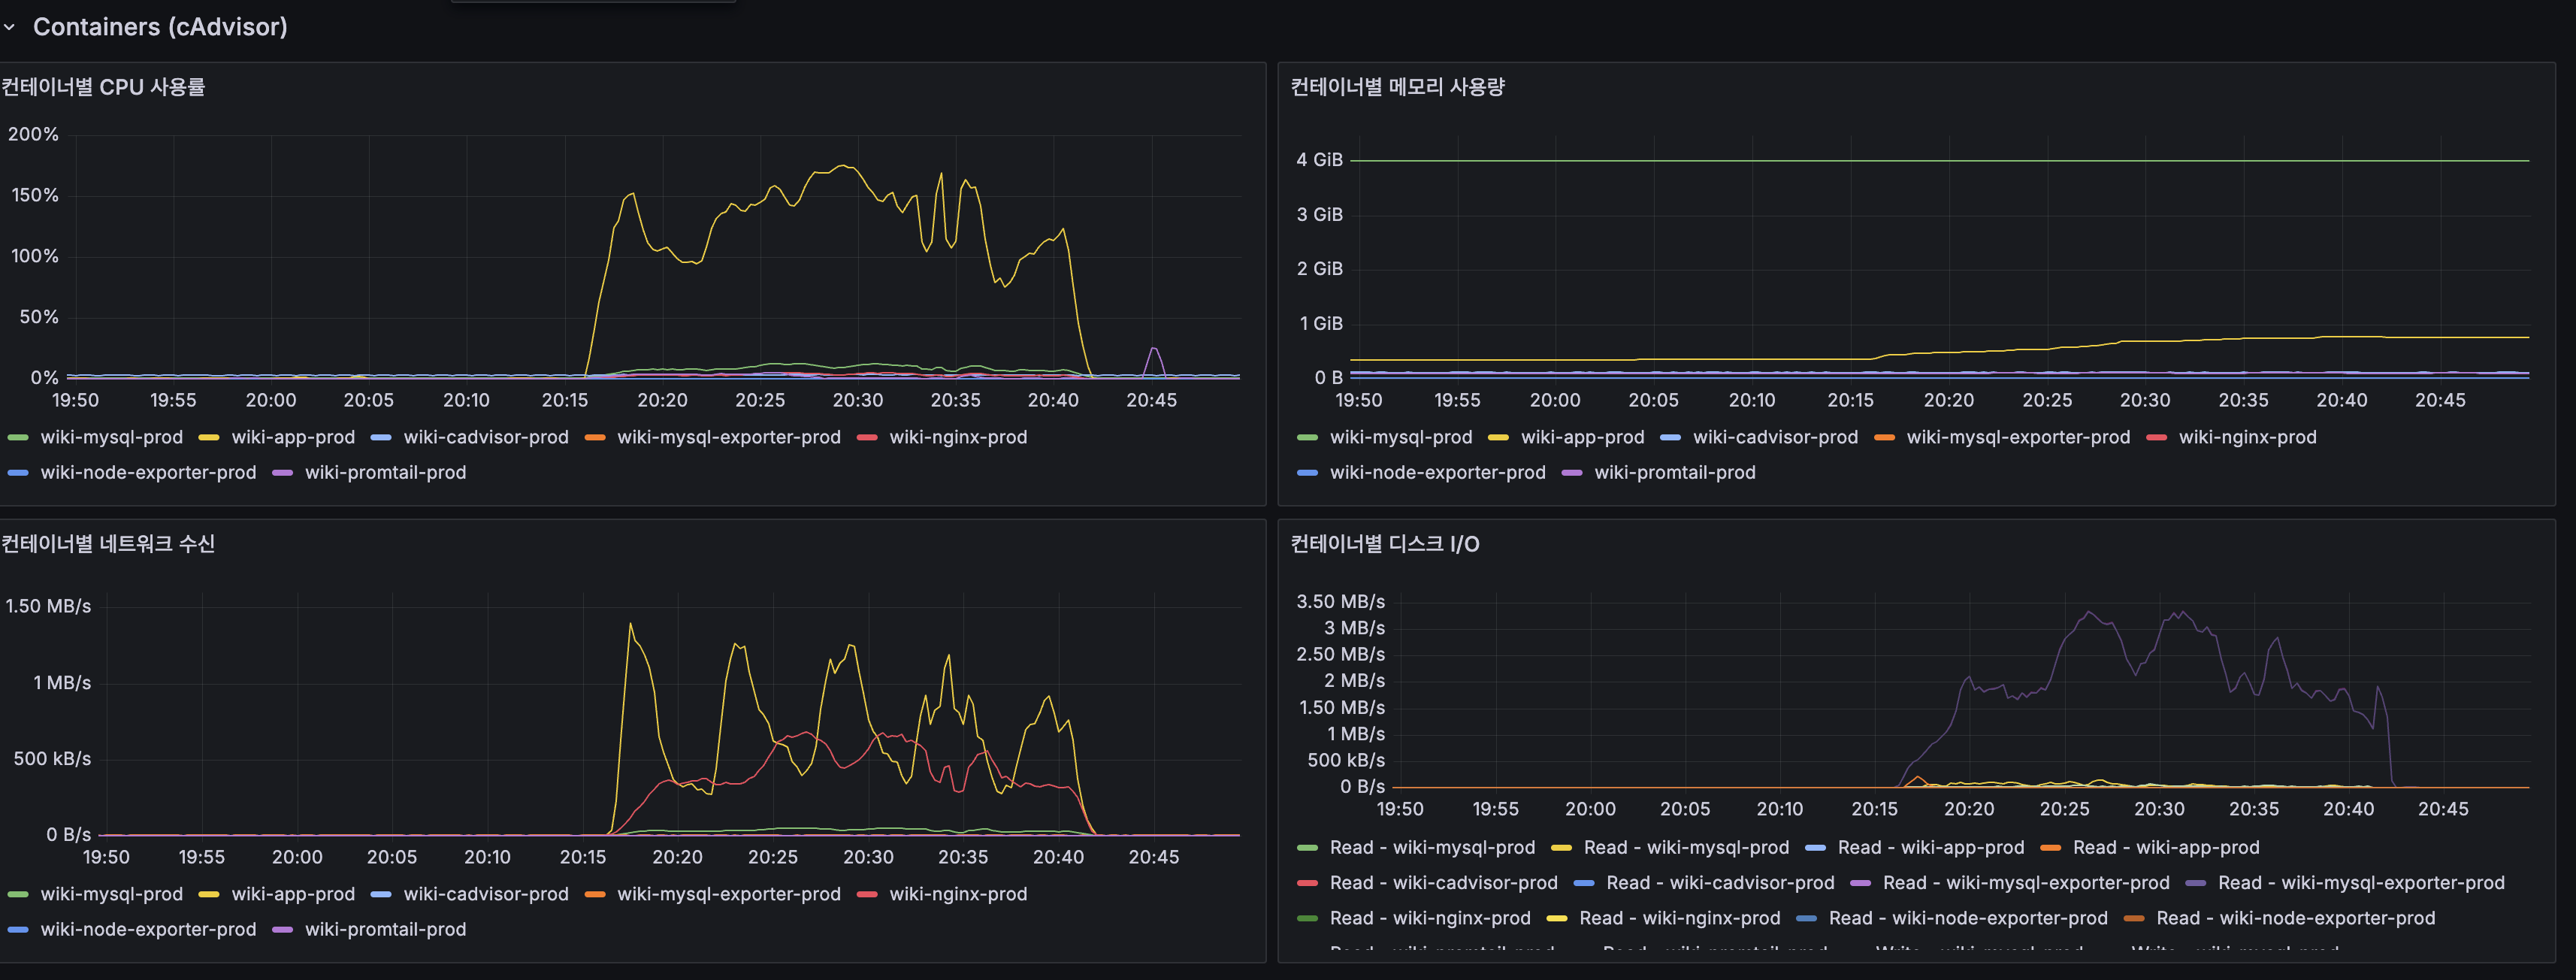
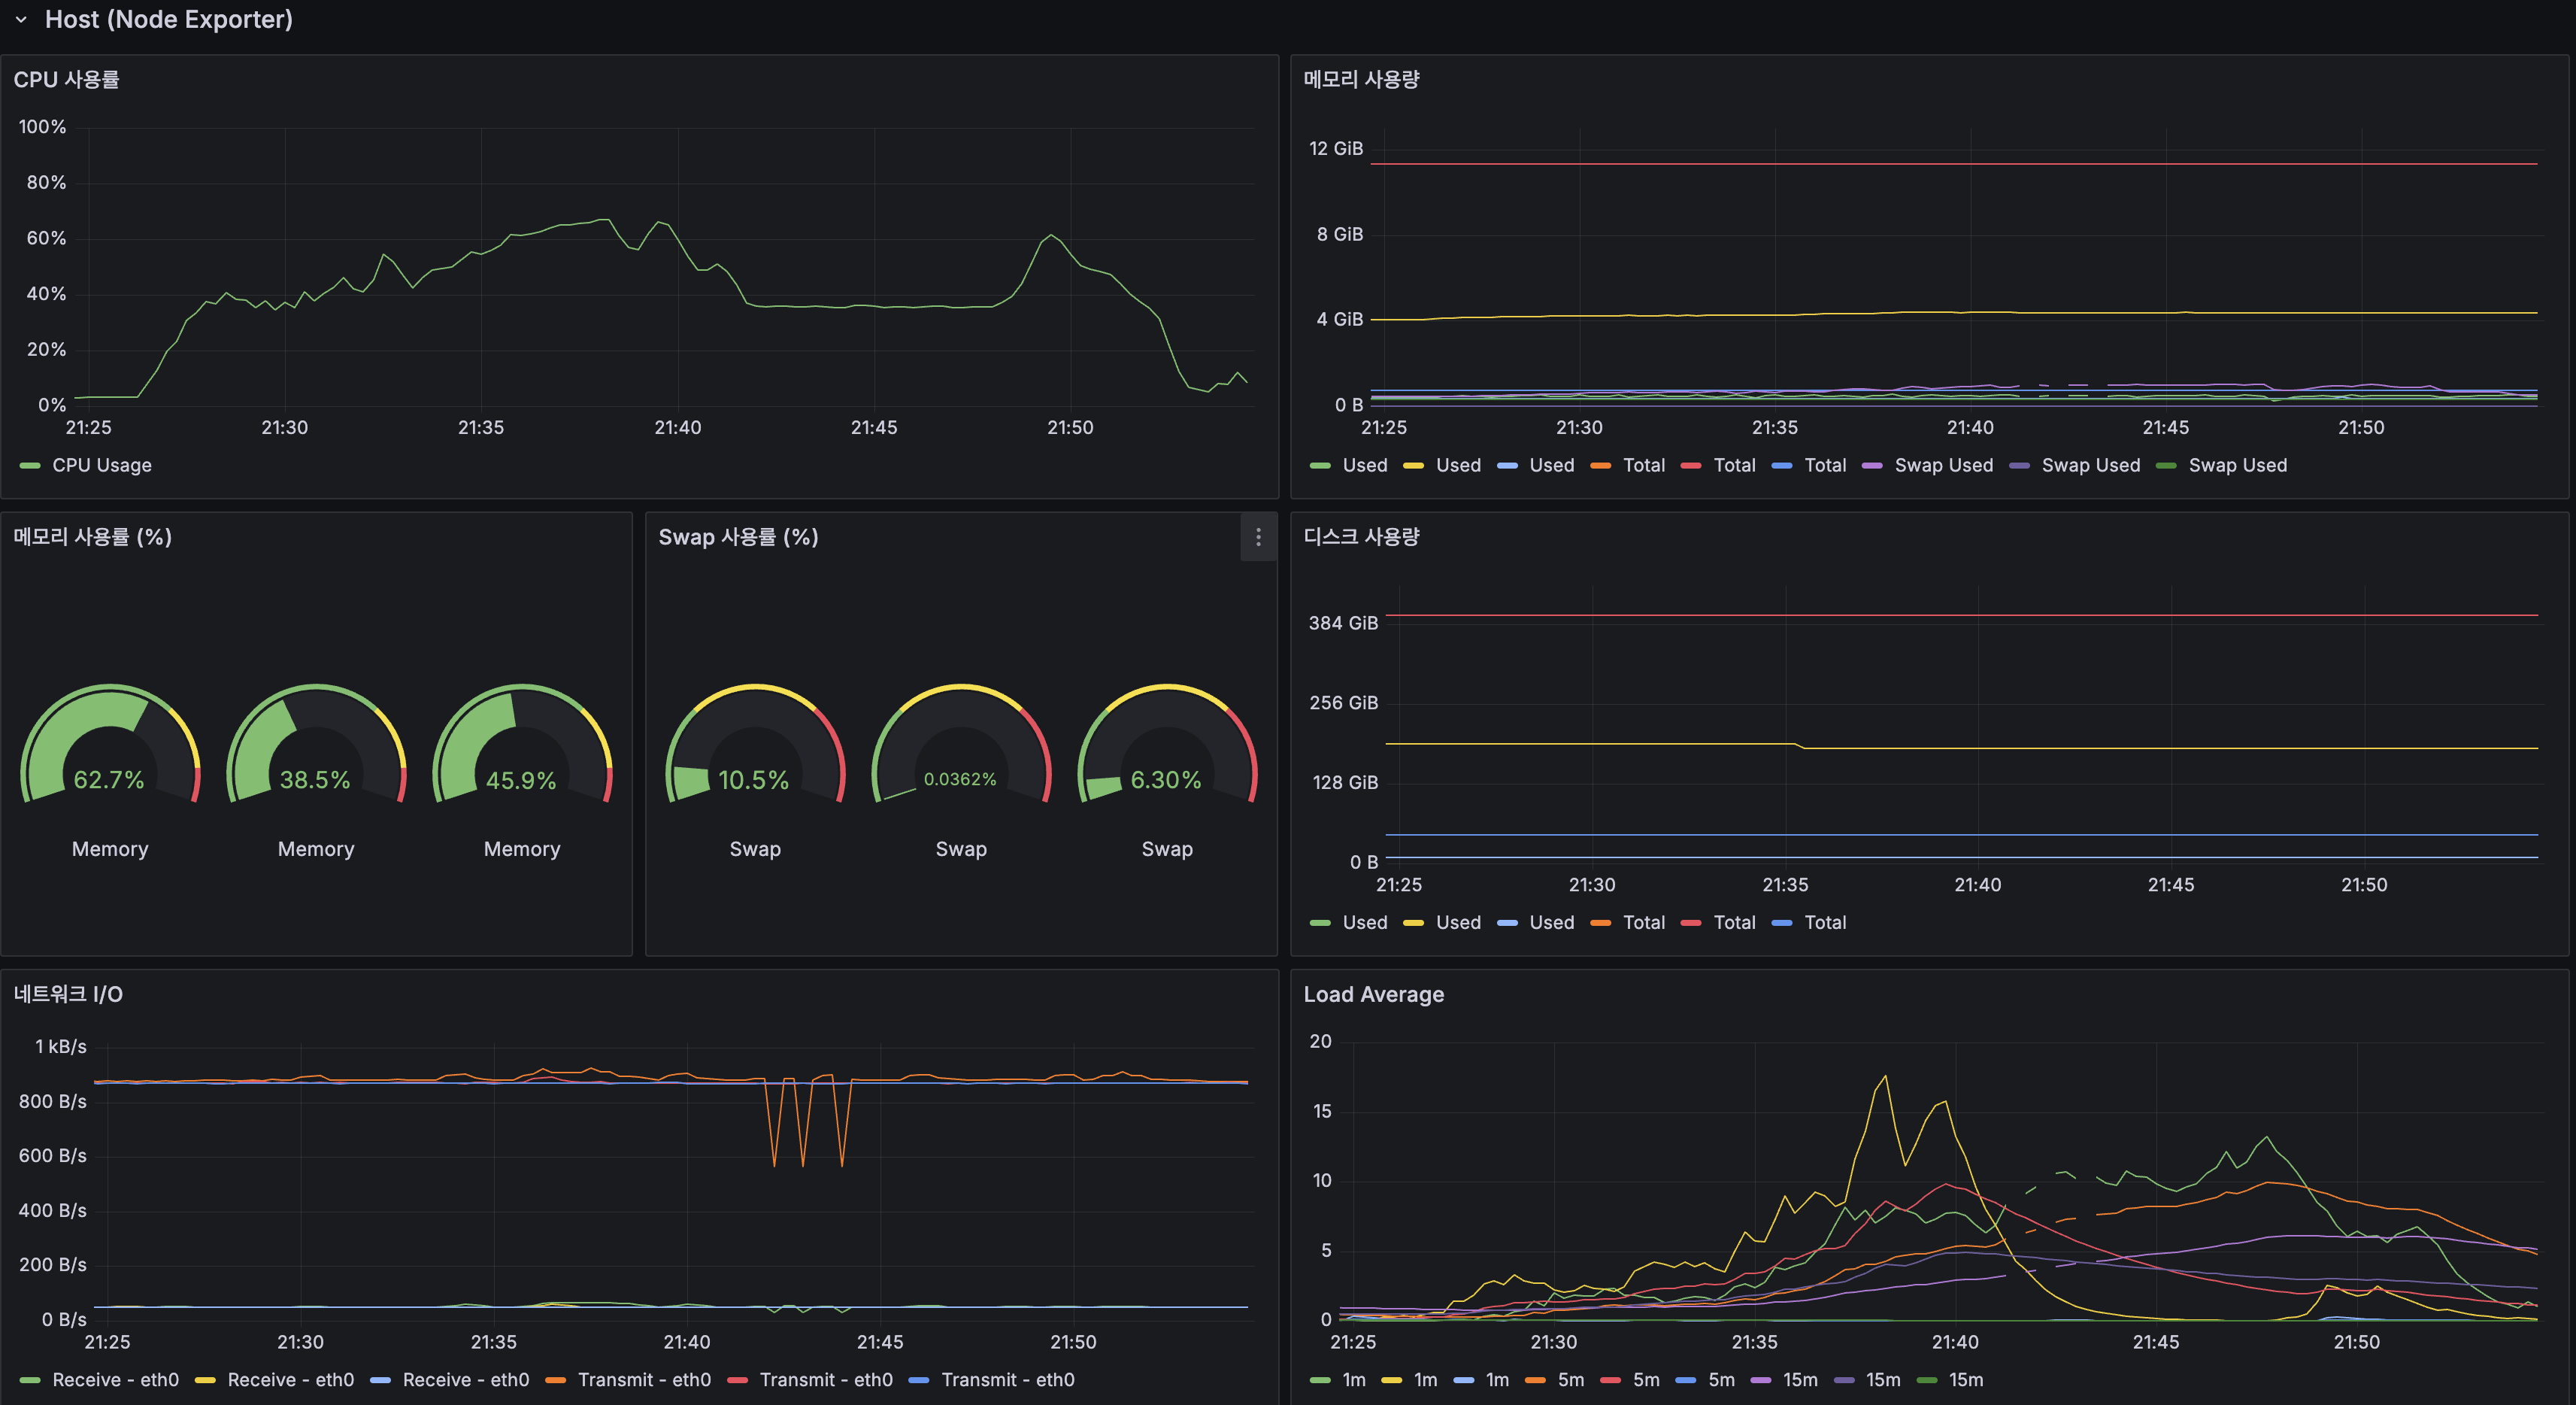
1번 병목: CPU 포화 (가장 심각)
| 지표 | 값 | 증거 |
|---|---|---|
| App CPU | 100% 포화 | Grafana 프로세스 CPU 패널 |
| cAdvisor wiki-app-prod | 150%+ (2코어 중 1.5코어) | cAdvisor CPU 패널 |
| Load Average (1m) | 20+ (2코어에서 18개 프로세스 대기) | Host Load Average |
| 포화 시점 | 200 VU 진입 후 약 5분 | VU 그래프와 CPU 그래프 교차 |
CPU가 Lucene BM25 검색(특히 고빈도 토큰 “대한민국”, “history”)과 DB 조회를 동시에 처리하면서 포화. 고빈도 토큰의 P95가 1,592ms로 가장 높은 이유: posting list가 길어 BM25 점수 계산에 CPU가 많이 소모됨.
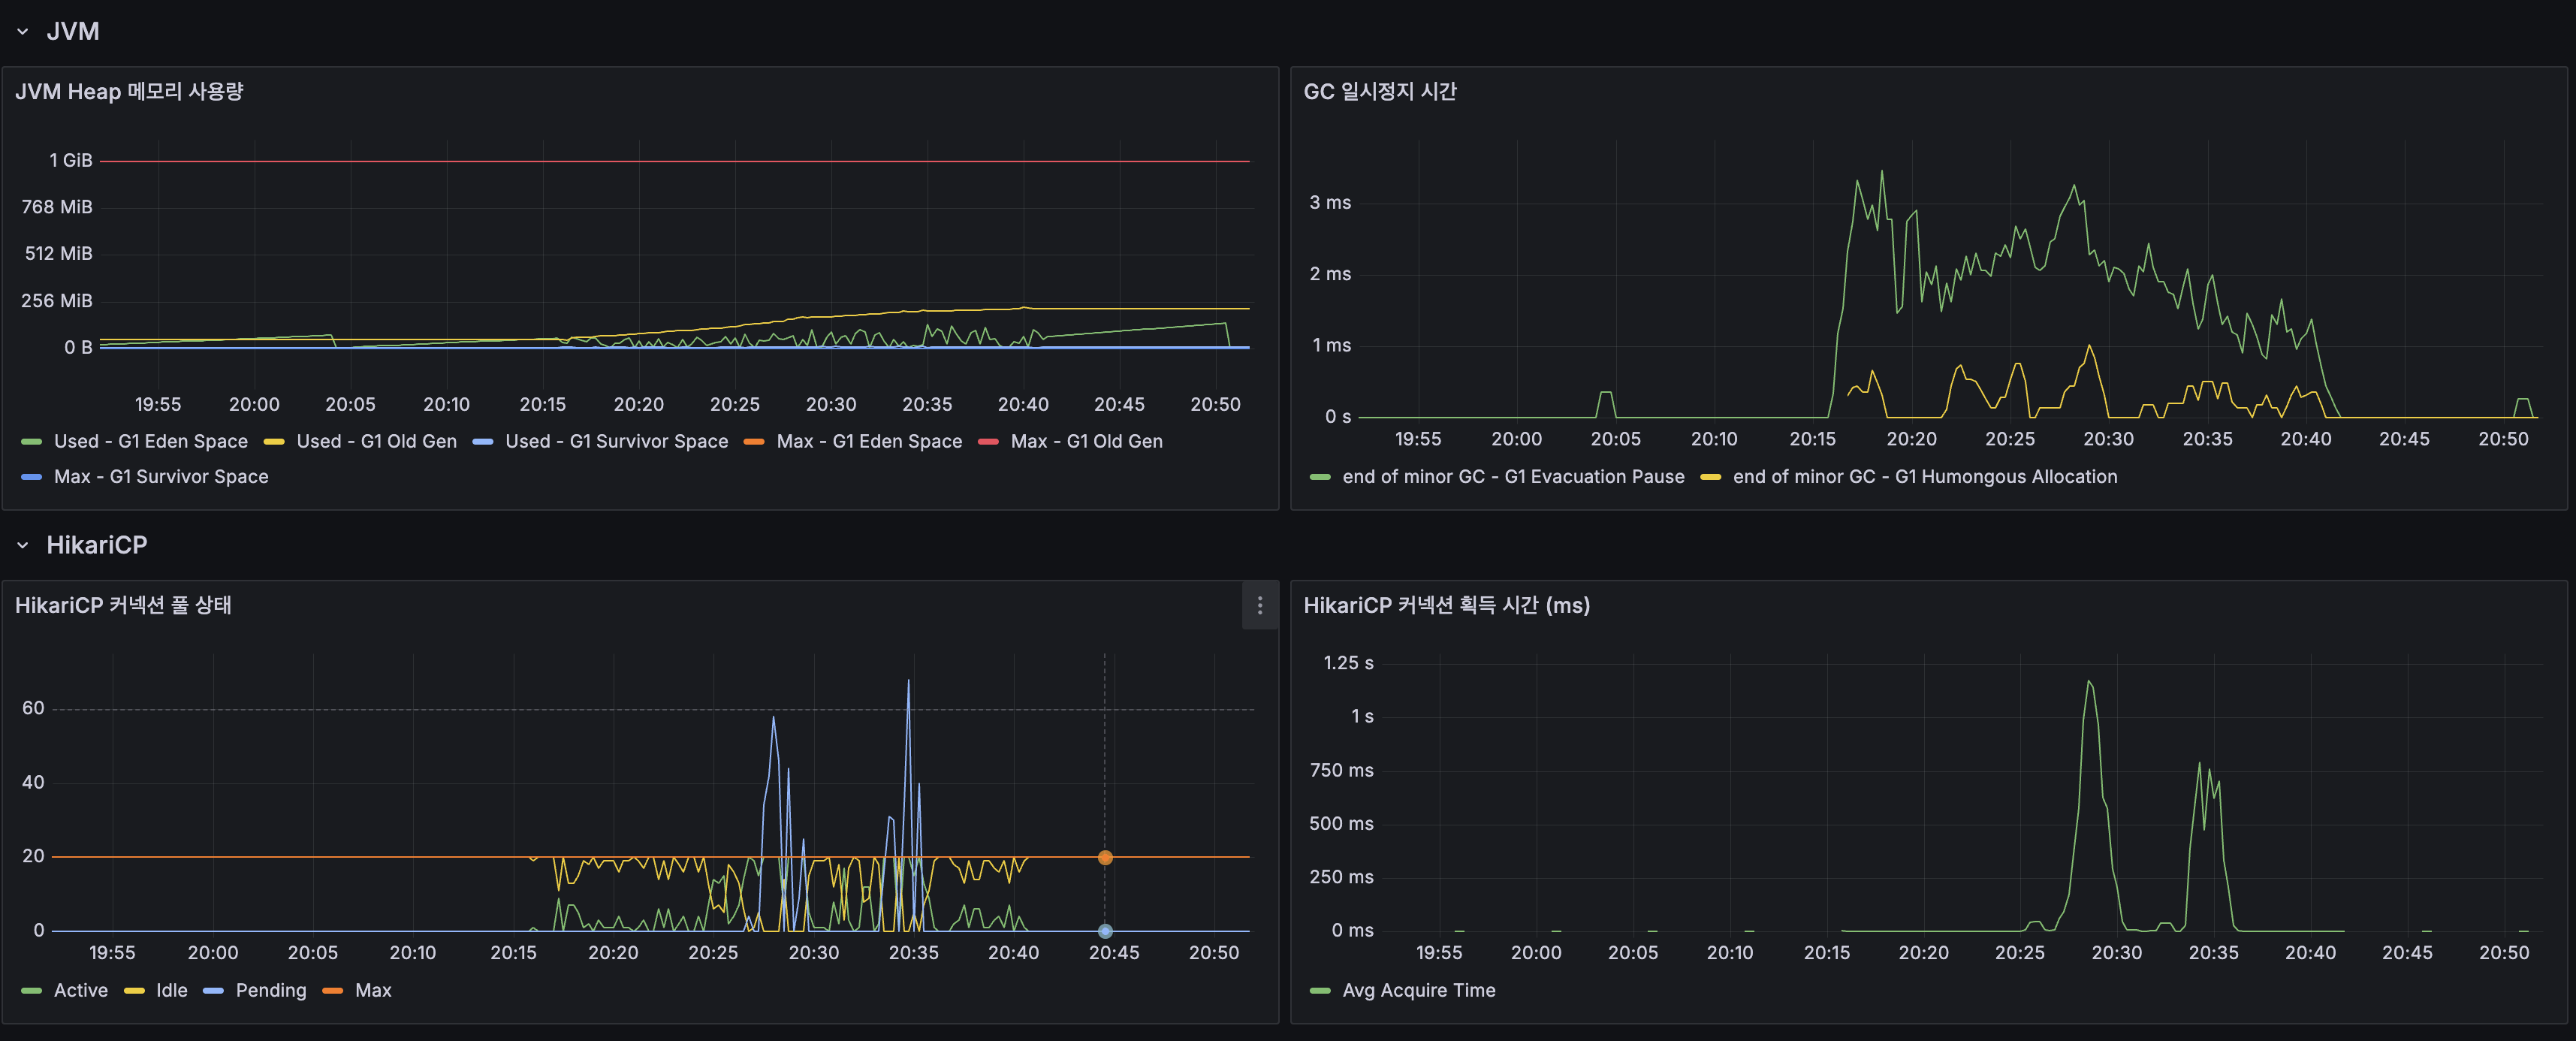
2번 병목: HikariCP 커넥션 풀 압박
| 지표 | 정상 (100 VU) | 과부하 (200 VU) |
|---|---|---|
| Active Connections | ~10/20 | 60+/20 (Max 초과) |
| Pending | 0 | 40+ |
| Acquire Time | 0.05ms | 1,250ms |
Max=20인데 Active가 60까지 치솟은 이유: CPU 포화로 요청 처리가 느려지면서 커넥션 점유 시간이 길어진 것. 풀이 부족해서가 아니라 CPU가 근본 원인.
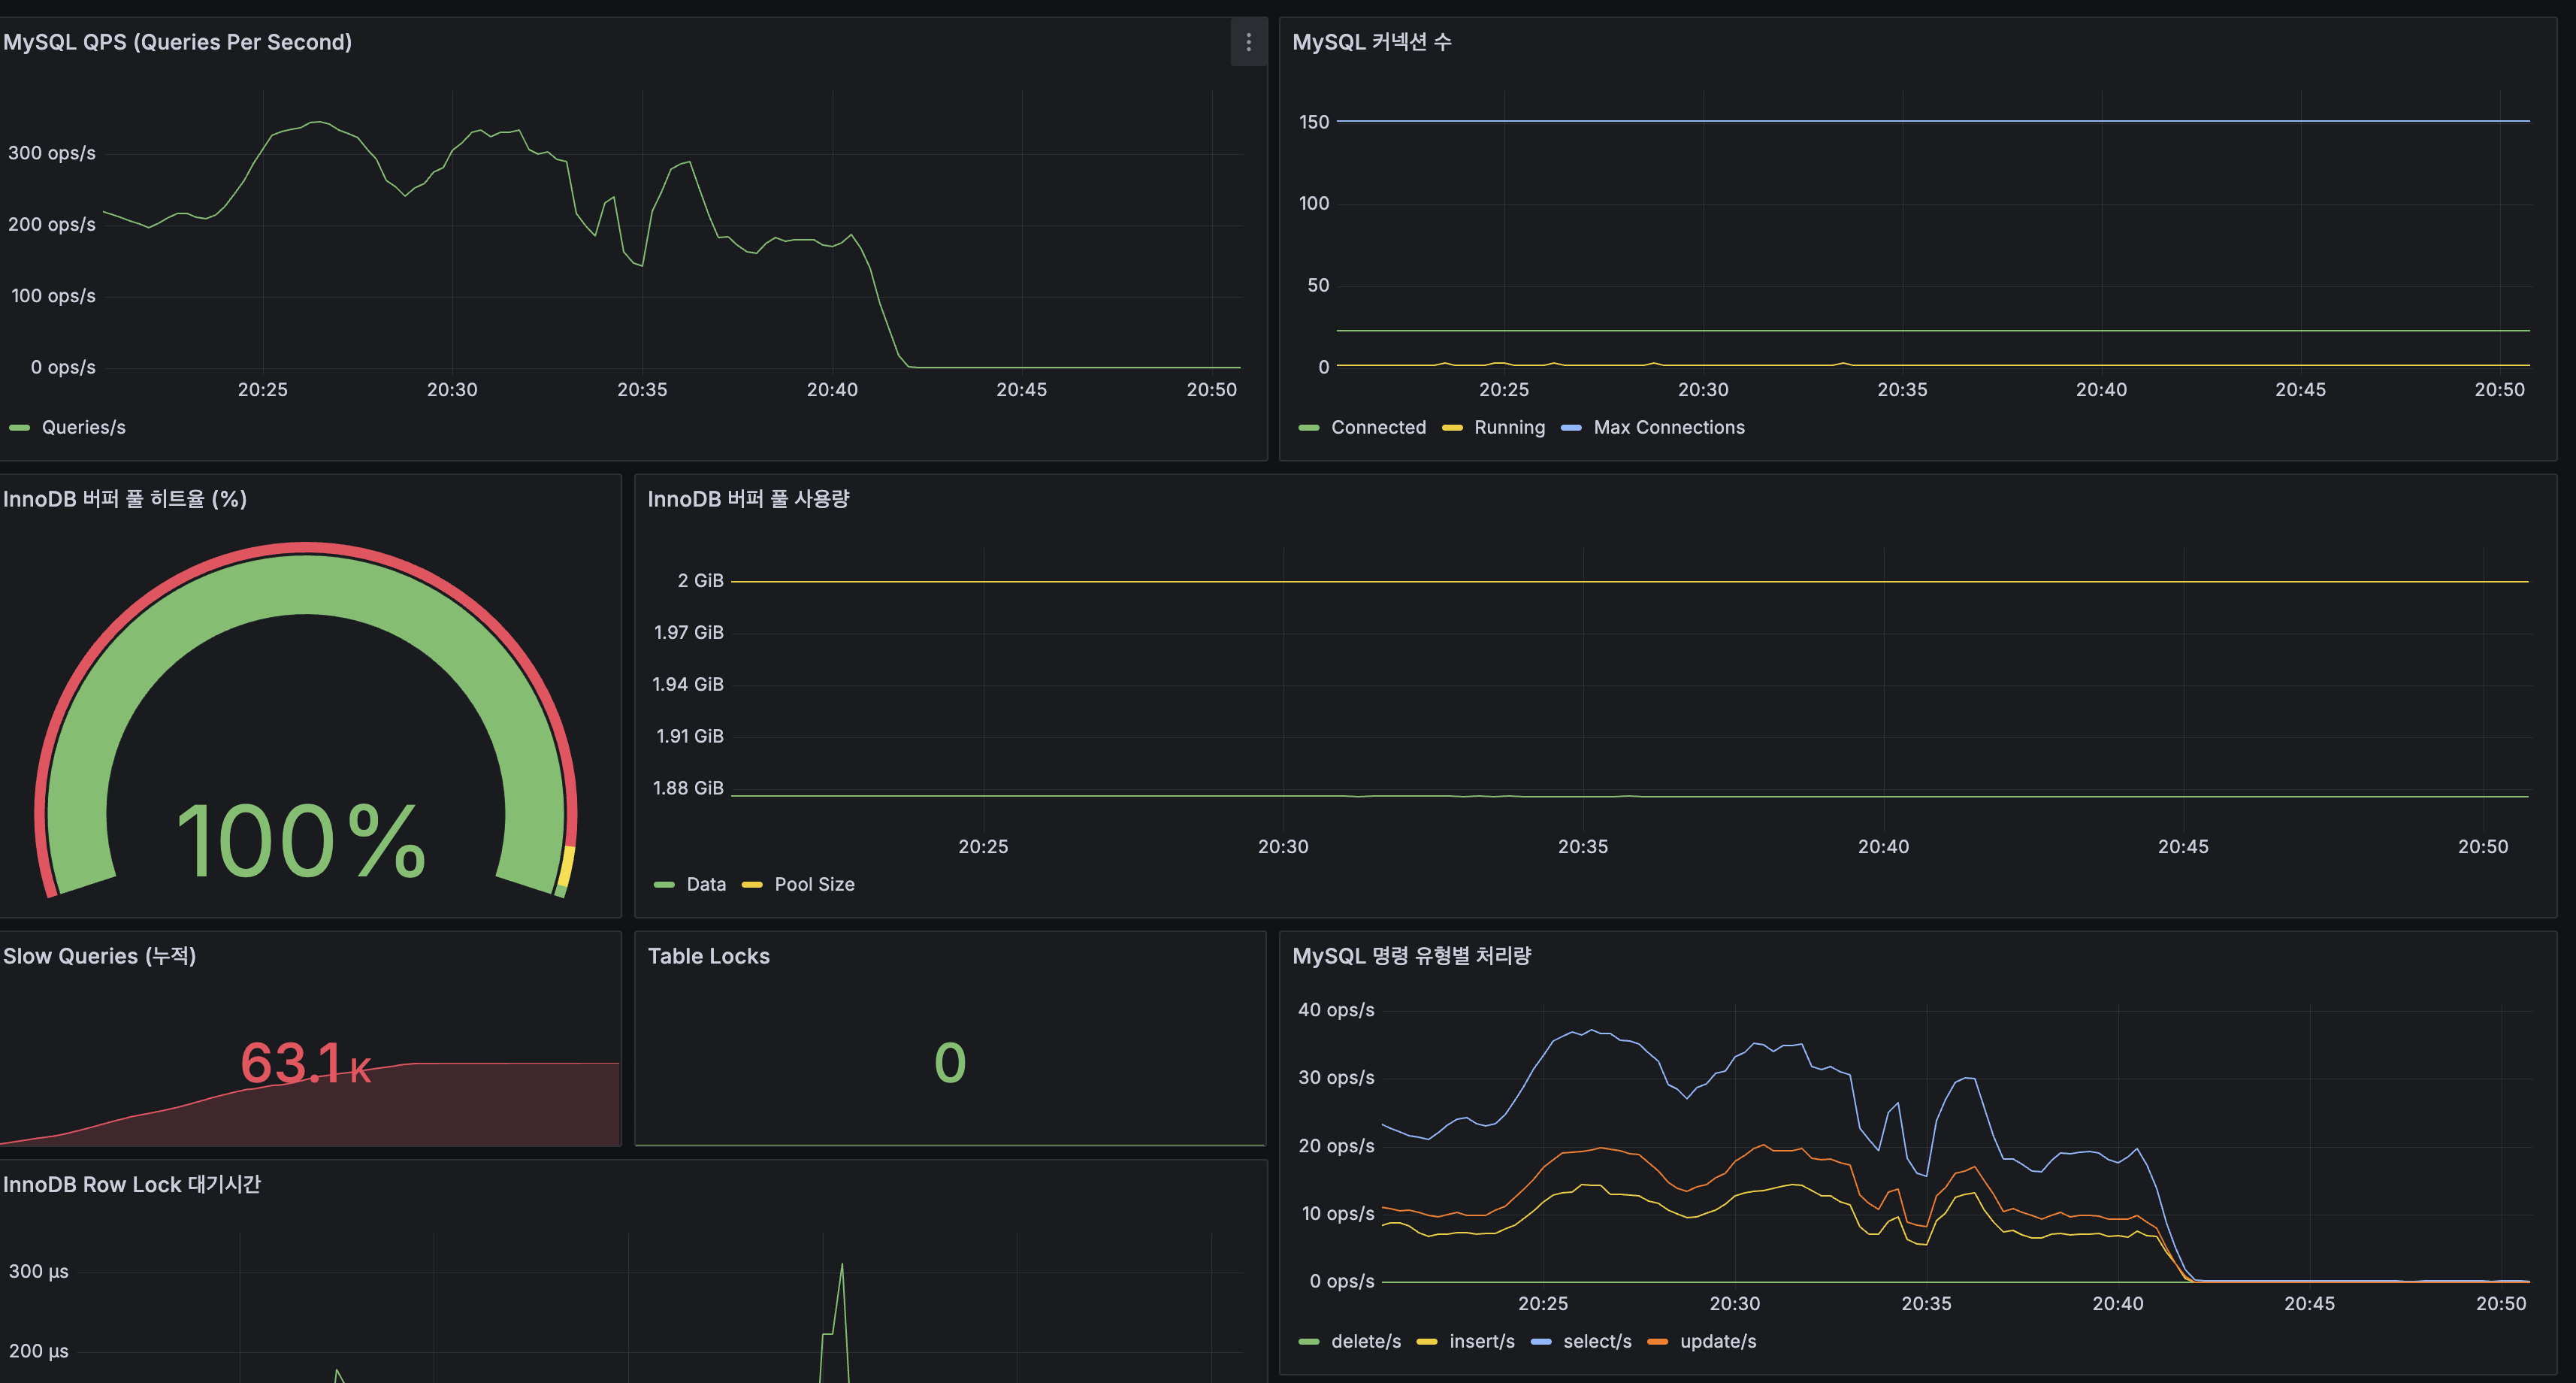
병목 아닌 것
| 항목 | 값 | 판단 |
|---|---|---|
| JVM Heap | 256MB / 1GB | 여유 |
| GC Pause | 최대 3ms | 문제 없음 |
| InnoDB Buffer Pool | 100% 히트율 | DB 캐시 정상 |
| Table Lock | 0 | 락 경합 없음 |
| Row Lock | 최대 300us (순간 스파이크) | 무시 가능 |
캐시 히트율
| 캐시 | 히트율 | 비고 |
|---|---|---|
| autocomplete | 100% | Trie + Caffeine 완벽 히트 |
| searchResults | 96.0% | 대부분 캐시 서빙 |
| postDetail | 71.4% | 랜덤 ID 조회라 미스 많음 |
searchResults 96%라도 4% 캐시 미스가 200 VU에서는 ~8 req/s의 Lucene 검색을 발생시키고, 이것이 CPU를 포화시킴.
한계점 요약
단일 서버 (ARM 2코어, 12GB RAM, JVM -Xmx1g) 한계: 안정 구간: ~100 VU (P95 < 500ms, CPU 40%) 한계 구간: ~150 VU (P95 ~ 1초, CPU 80%) 포화 구간: 200 VU (P95 > 1.4초, CPU 100%, HikariCP 고갈) 에러 발생: 없음 (에러율 0%) — 느려지지만 터지지는 않음
→ 단일 서버의 실질적 한계: 약 100~150 동시 사용자JVM/Tomcat 튜닝 시도
1차 stress에서 CPU 포화가 확인되었으므로, JVM/Tomcat 튜닝으로 한계를 밀어올릴 수 있는지 시도.
서버 메모리 배분

적용한 튜닝
| 항목 | 튜닝 전 | 튜닝 후 | 의도 |
|---|---|---|---|
| -Xmx | 1g | 2g | GC 여유 확보 |
| -Xms | (JVM 기본) | 2g | 힙 리사이징 오버헤드 제거 |
| Tomcat max-threads | 200 | 100 | 컨텍스트 스위칭 감소 |
| Tomcat accept-count | 100 | 50 | 큐 대기 제한 |
| app_memory_limit | 2G | 4G | JVM 2g + 메타스페이스/스레드 |
HikariCP (변경 없음)
1차 stress에서 HikariCP Active가 Max(20) 초과한 것은 풀이 부족해서가 아니라 CPU 포화로 요청 처리가 느려져 커넥션 점유 시간이 길어진 것. 풀 사이즈를 올려도 CPU 문제는 해결되지 않음.
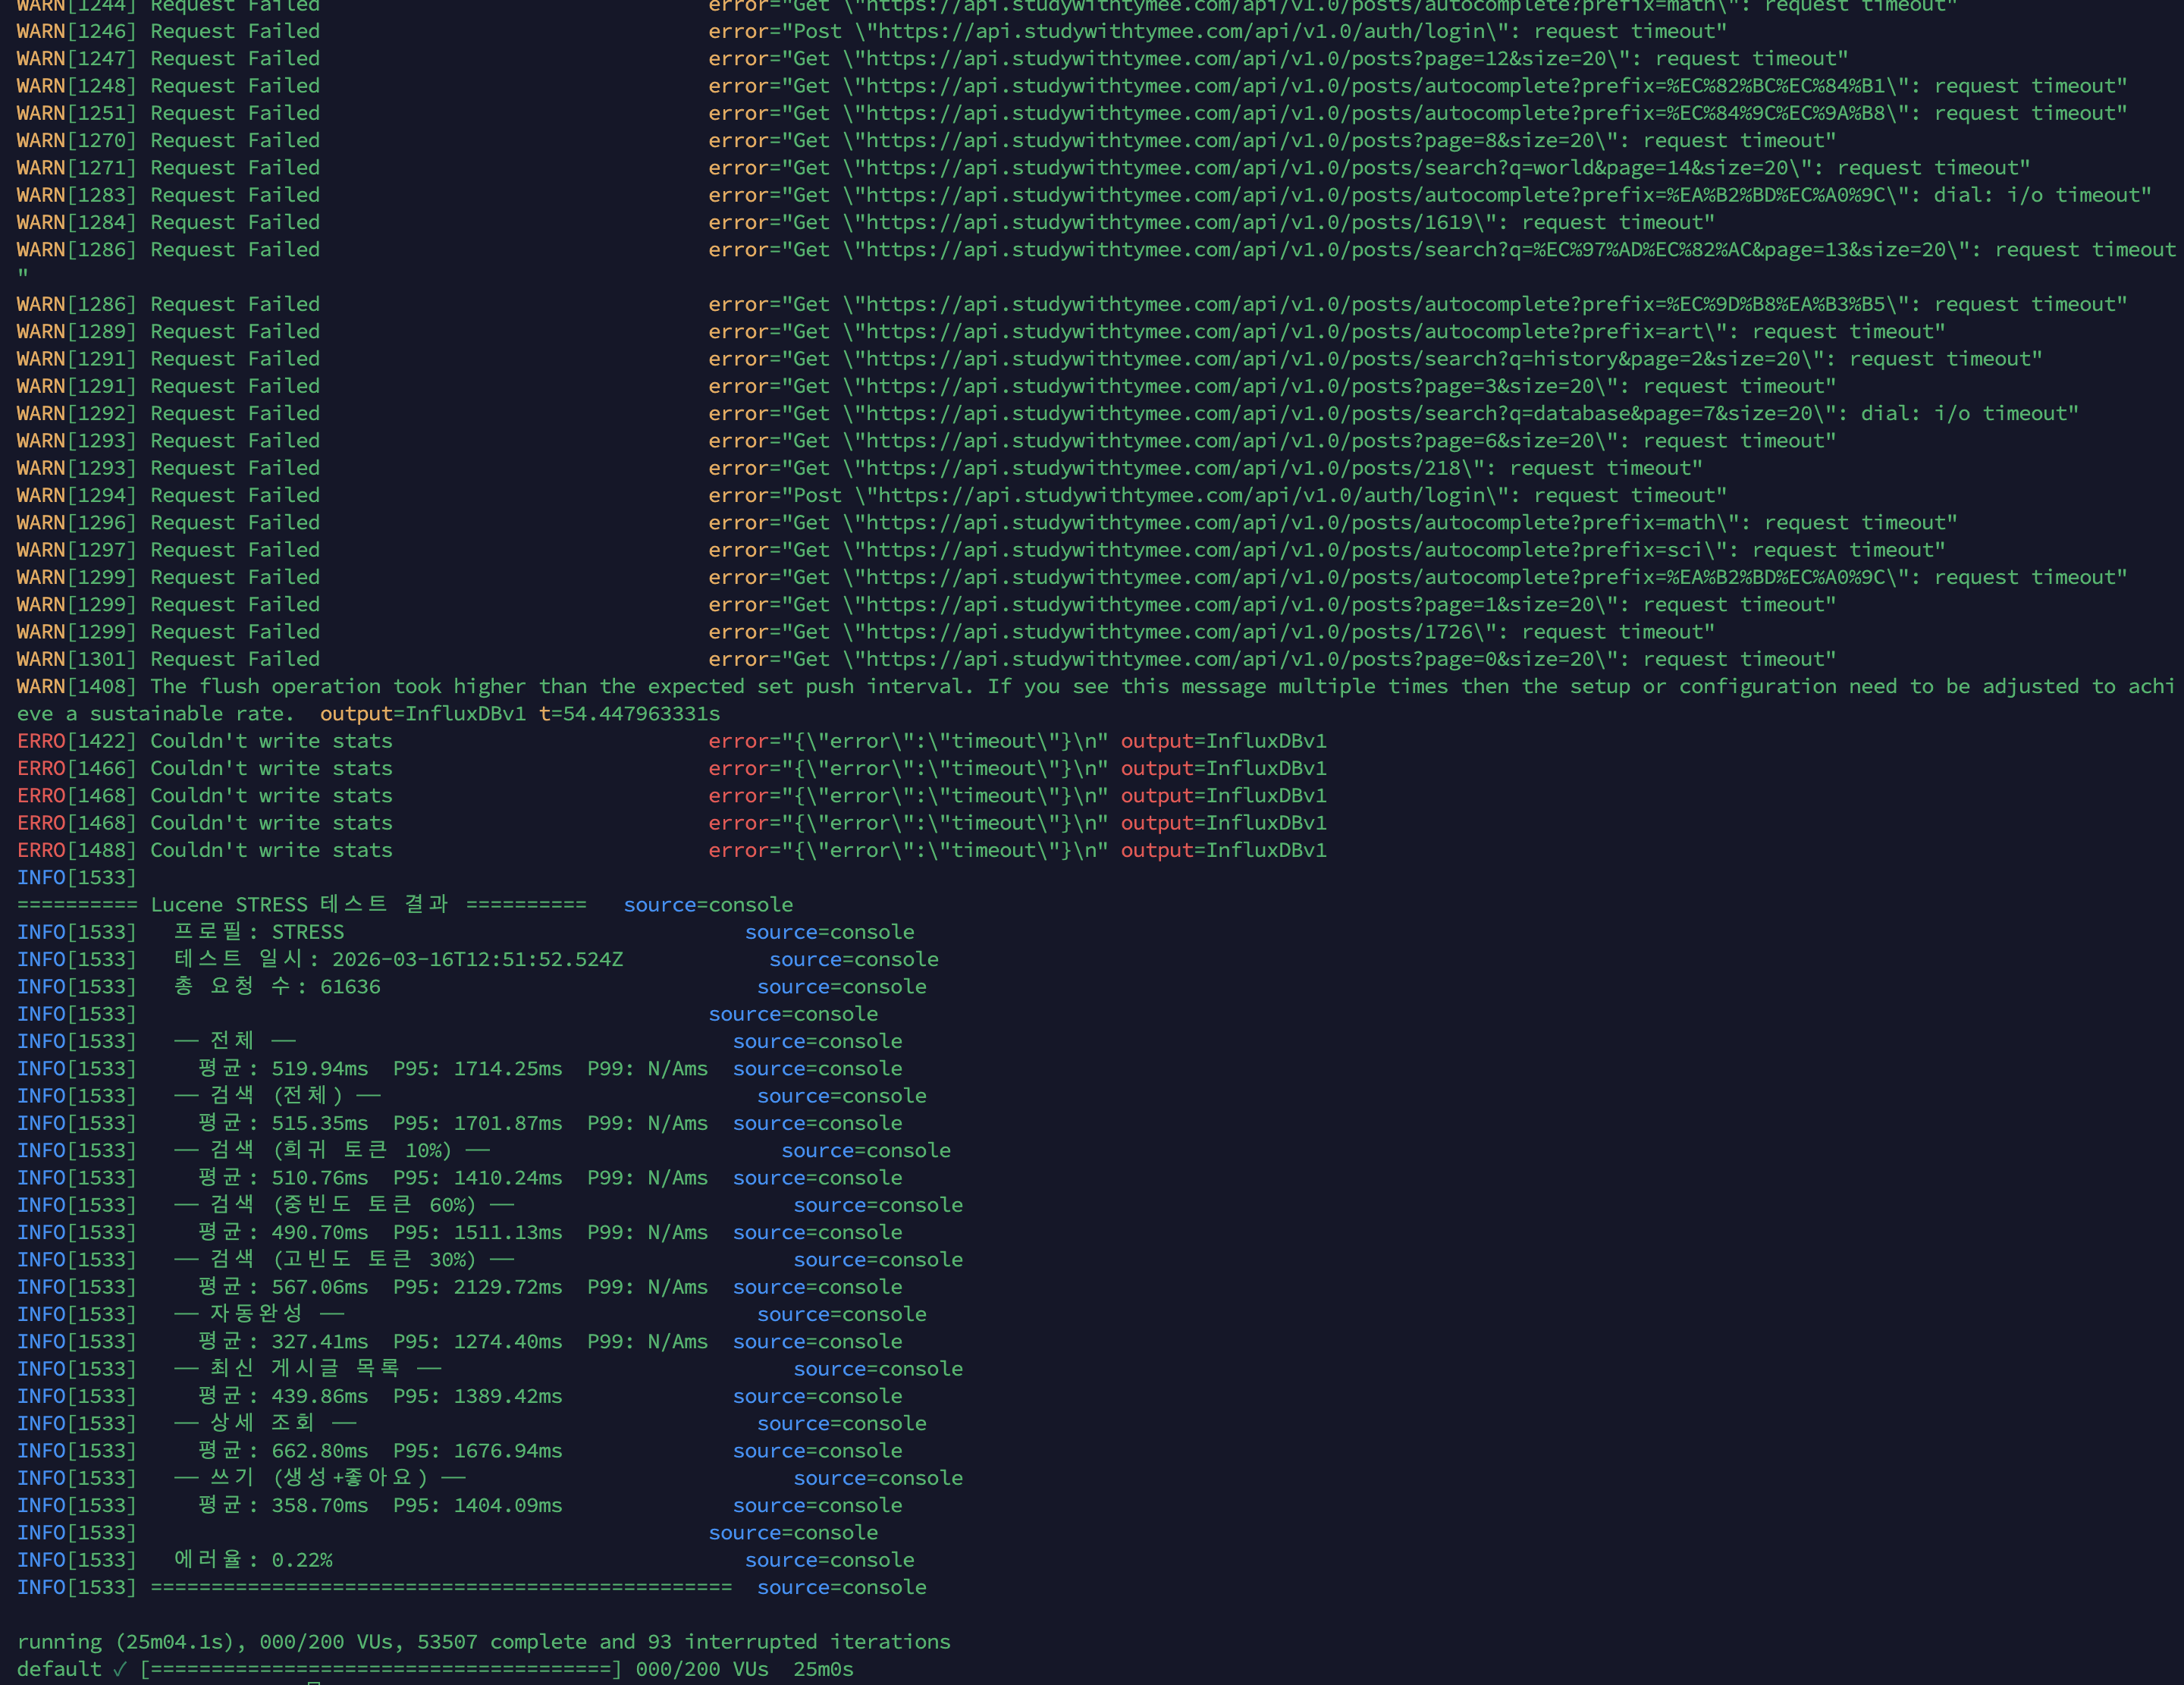
2차 stress 결과 (튜닝 후, 역효과 발생)
결과: 모든 지표가 악화되었다.
| 지표 | 1차 (튜닝 전) | 2차 (튜닝 후) | 변화 |
|---|---|---|---|
| 총 요청 | 101,984 | 61,636 | -40% |
| 평균 응답시간 | 290ms | 519ms | +79% 악화 |
| P95 | 1,413ms | 1,714ms | +21% 악화 |
| 에러율 | 0.00% | 0.22% | 에러 발생 |
| 자동완성 평균 | 94ms | 327ms | +248% 악화 |
| searchResults 히트율 | 96% | 91.8% | -4.2% 하락 |
| postDetail 히트율 | 71.4% | 50% | -21.4% 하락 |
역효과 원인 분석
1. Tomcat max-threads 200→100이 핵심 악화 요인
CPU-bound 병목인 상태에서 스레드를 줄이면 동시 처리 가능한 요청 수가 줄어듦. 200 VU가 100 스레드에 몰리면 나머지 100 VU는 큐에서 대기. 대기 시간이 응답시간에 추가되어 전체 지연 증가.
2. Xmx 2g가 실제로 적용되지 않음
$ docker exec wiki-app-prod java -XshowSettings:vm -version 2>&1 | grep -i heap Max. Heap Size (Estimated): 512.00M512MB. 2g는커녕 1g도 아니었음.

배포 미반영 발견 과정
2차 stress에서 결과가 오히려 악화되어 의심. Grafana JVM 패널에서 Heap Max가 여전히 기존과 동일하게 표시되어 직접 확인.
원인: GitHub Actions 배포는 Docker 이미지(코드)만 교체하고, Ansible group_vars(환경변수)는 Ansible Playbook 실행 시에만 반영. group_vars/all.yml을 로컬에서만 수정하고 GitHub에 push하지 않아서 .env.prod가 갱신되지 않았음.
해결: ansible-vault encrypt group_vars/all.yml → git push → 다음 배포 시 반영.
이 경험에서 “코드 배포”와 “인프라 설정 배포”는 별개라는 것을 배움.
3. app_memory_limit 4G로 인한 Lucene 페이지 캐시 감소
Docker 컨테이너가 4G를 점유하면서 OS 페이지 캐시(Lucene MMap용)가 5G→3G로 줄어 캐시 히트율이 하락했을 가능성.
교훈 3가지
1. CPU-bound 병목에서 스레드를 줄이는 것은 잘못된 튜닝이다. 컨텍스트 스위칭을 줄이는 것이 목적이었지만, 실제로는 동시 처리 용량을 줄여서 큐 대기만 길어졌다. CPU가 근본 한계인 상황에서 JVM/스레드 튜닝으로는 해결할 수 없다.
2. 튜닝 적용 여부를 반드시 검증해야 한다.
docker exec ... java -XshowSettings:vm으로 직접 확인. “배포했으니 적용됐겠지”라는 가정은 위험하다.3. 실패한 튜닝도 기록해야 한다. “Tomcat 스레드 100으로 줄였더니 좋아졌습니다”라고 거짓말하는 것보다, “줄였더니 79% 악화돼서 원복했고, CPU-bound에서는 스레드 수가 아니라 CPU 자체를 늘려야 한다는 걸 배웠다”가 면접에서 훨씬 강력하다.
원복 + 최종 결론
모든 설정을 1차 stress 시점으로 원복.
app_memory_limit: 2G # 4G→2G 원복java_opts: "-Xmx1g" # 2g→1g 원복tomcat_max_threads: 200 # 100→200 원복tomcat_accept_count: 100 # 50→100 원복| 시도 | 결과 | 판단 |
|---|---|---|
| 1차 stress (기본 설정) | CPU 100%, P95 1.4초, 에러 0% | 단일 서버 한계 = ~100-150 VU |
| 2차 stress (Tomcat 100, Xmx 미적용) | 전 지표 40~79% 악화, 에러 0.22% | 튜닝 역효과 + 배포 미반영 |
| 원복 후 | 1차와 동일 | 이 서버에서 튜닝으로 해결할 수 없는 한계 |
분산 전환 근거 확보: 단일 서버(ARM 2코어)의 한계는 약 100-150 동시 사용자이며, JVM/Tomcat 튜닝으로는 이 한계를 넘을 수 없다. CPU 부하를 근본적으로 줄이려면 Redis L2 캐시(DB/Lucene 접근 감소)와 App 스케일아웃(CPU 분산)이 필요하다.
GC 튜닝이 해결책이 아니었던 이유
JVM/Tomcat 튜닝을 시도했지만, 근본 병목이 GC가 아니라 CPU 자체였기 때문에 효과가 없었다.
1차 stress에서 확인한 GC 상태:
- GC pause: 최대 3ms (문제 없음)
- Full GC: 0회 (발생하지 않음)
- JVM Heap: 256MB / 1GB (여유)
GC 튜닝이 필요한 건 “GC pause가 수백ms~초 단위로 응답시간을 잡아먹을 때”다. 이 프로젝트에서는 GC가 정상 범위였고, CPU 100% 포화가 진짜 병목이었다. Tomcat 스레드를 줄여봤지만 CPU-bound 상황에서 동시 처리 용량만 줄어들어 79% 악화. “GC가 아닌 곳을 튜닝하면 효과가 없거나 역효과”라는 것을 실측으로 확인했다.
최적화 순서의 정석:
- 애플리케이션 레벨 최적화 (코드, 쿼리, 캐싱): 캐싱 전략~Trie 자동완성에서 완료
- 아키텍처 변경 (분산 캐시, DB 분산, 스케일아웃): 다음에서 수행
- JVM/GC 튜닝: 1, 2를 다 한 후에도 GC가 병목일 때만
스케일 업 vs 스케일 아웃
| 스케일 업 (서버 스펙 올리기) | 스케일 아웃 (서버 대수 늘리기) | |
|---|---|---|
| 방법 | 2코어→4코어, RAM 12G→24G | 서버 2대→3대 + 로드밸런서 |
| 장점 | 간단, 코드 변경 없음 | 무한 확장, 고가용성, 장애 격리 |
| 단점 | 물리적 한계, 비용 급증 | 상태 공유 문제(세션, 캐시) |
| 적합 상황 | 단기 해결, 스펙 여유 있을 때 | 장기 확장, 고가용성 필요 시 |
이 프로젝트에서 스케일 아웃을 선택한 이유:
- Oracle Cloud Free Tier라 스케일 업 불가: ARM 2코어/12GB가 Free Tier 최대 사양
- CPU가 병목: 코어 수를 늘려야 하는데, 같은 서버에서는 불가
- 고가용성: 서버 1대가 죽으면 전체 서비스 중단. 2대 이상이면 장애 격리 가능
- 확장 경로의 타당성: 스케일 업은 단기 완화에는 유효하지만, 현재 제약에서는 불가능했다. 반면 스케일 아웃은 상태 공유, 로드밸런싱, 세션/캐시 일관성을 함께 정리해야 하므로 이후 구조 변경의 방향과도 맞았다
실무에서는 “먼저 스케일 업(간단) → 한계 오면 스케일 아웃(확장성)“이 일반적이다. Free Tier 제약으로 스케일 업이 불가능하므로 바로 스케일 아웃으로 진행한다.
CPU 병목 해결 순서: 왜 바로 스케일 아웃이 아닌가
CPU가 병목이라고 무조건 서버를 늘리는 게 아니다. 실무에서는 아래 순서로 접근한다:
| 순서 | 최적화 | 적용 | 상태 |
|---|---|---|---|
| 진짜 CPU 병목 확인 | lock / IO wait / GC / context switching이 CPU처럼 보일 수 있음 | Grafana에서 CPU 100%, GC 3ms, Lock 0, IO wait 없음 확인 | 진짜 CPU 병목 확인 |
| 캐싱 | Caffeine L1 (히트율 96%) | 캐싱 전략 | 완료 |
| 알고리즘 | LIKE → Lucene BM25 역색인 | Lucene 전환 | 완료 |
| 데이터 최적화 | Slice 전환, snippet 150자 (260KB→3KB) | COUNT(*) 제거와 페이지 제한 | 완료 |
| Precompute | 검색 로그 → Trie 인기순 | Trie 자동완성 | 완료 |
| JVM/Tomcat 튜닝 | Tomcat 스레드 축소 시도 → 역효과 | 이 글 | 실패 (원복) |
| 스케일 업 | Free Tier 제약으로 불가 | - | 불가 |
| → 스케일 아웃 | Redis L2 + Replication + 다중 인스턴스 | 다음 | 다음 |
스케일 아웃은 “마지막 수단”이다. 코드 최적화, 캐싱, 알고리즘 개선을 다 한 후에도 CPU가 병목이고, 스케일 업도 불가능한 상황에서 선택하는 것이다. “Redis가 좋으니까”, “MSA가 트렌드니까”가 아니라, “stress 테스트에서 CPU 100% 확인 + 튜닝 역효과 확인 + 스케일 업 불가”라는 근거가 있다.
참고: 대규모 자동완성 파이프라인 설계
stress 테스트에서 단일 서버 한계를 확인한 후, “대규모에서는 어떻게 해야 하는가”를 정리합니다.
현재 vs 대규모
| 규모 | 검색 로그 집계 | 자동완성 서빙 |
|---|---|---|
| 단일 서버 (현재) | SQL GROUP BY | Trie → Redis flat KV |
| 대규모 배치 | Spark SQL (1시간 주기) | Redis Cluster |
| 대규모 실시간 | Kafka + Flink (초 단위) | Redis Cluster + CDC |
”MapReduce”에 대한 정리
“MapReduce”는 Hadoop MapReduce 프레임워크가 아니라 “데이터 분배 → 그룹핑 → 집계”라는 사고 패턴입니다.

현업(2025년 기준):
- Hadoop MapReduce는 정부/전통 기업의 레거시 시스템에서만 사용
- 새 프로젝트는 Spark SQL 또는 Flink를 사용
- Spark SQL은 자체 실행 엔진(DAG + Catalyst Optimizer)을 사용하며 MapReduce 프레임워크 위에서 동작하지 않음
출처
- k6 — Test Types (smoke, load, stress, soak)
- HikariCP — About Pool Sizing
- Zalando Engineering — How to Set an Ideal Thread Pool Size
Previous Posts
In Caching Strategy, we introduced Caffeine L1 cache achieving 14x overall improvement. In Trie Autocomplete, we implemented popularity-based autocomplete with Jamo search.
Now we determine where the single server breaks to establish grounds for distributed architecture transition.
Previous Posts Summary
| Post | Improvement | Result |
|---|---|---|
| Caching Strategy | Caffeine L1 cache | Overall 776ms→54ms (14.4x), autocomplete hit rate 99.9% |
| Trie Autocomplete | Trie + search logs + Jamo | Alphabetical→popularity order, “삼ㅅ”→“삼성전자” |
Overview
Purpose of This Post
Identify the single server’s breaking point with stress testing. Record what happens when limits are exceeded (P99 explosion? error rate increase? OOM?) and verify whether JVM/Tomcat tuning can push the limits further.
Why Stress Testing
| Test | Purpose | VU | Duration | Meaning in This Project |
|---|---|---|---|---|
| smoke | Sanity check | 5 | 2min | ”Does it crash?” — already done |
| load | Expected traffic | 100 | 20min | ”Performance under normal load?” — already done |
| stress | Find breaking point | 200 | 25min | ”Where does it break?” — this post |
| soak | Long-term stability | 50 | 4hr | After distributed infra |
Test Environment
| Item | Value |
|---|---|
| Server | Oracle Cloud ARM (Ampere A1), 2 cores, 12GB RAM |
| JVM | Java 25, -Xmx1g |
| DB | MySQL 8.0, InnoDB Buffer Pool 2GB |
| Data | 14.25M posts, Lucene index ~20GB |
| k6 | Running from monitoring-loki server, InfluxDB + Grafana |
k6 Stress Profile
25-minute rationale: k6 official recommendation is 5x ramp-up duration, ideally 45min+. However, sustaining 200 VU for 30+ minutes on a 2-core ARM server risks server instability. Overload phase 10min + recovery 5min = 25min. Finding the breaking point is the goal, so VU count (200) matters more than duration.
Expected Bottlenecks
Four potential bottlenecks on a single server (ARM 2 cores, 12GB):
1. CPU Saturation
Lucene search (BM25 + DocValues + sorting) is CPU-intensive on 2 ARM cores. Caffeine cache hit rate is 96%, but simultaneous cache misses can saturate CPU.
2. DB Connection Pool Exhaustion
HikariCP pool size 20. If concurrent DB queries exceed 20, remaining requests wait. HikariCP pool sizing formula:
connections = (core_count * 2) + effective_spindle_countARM 2 cores: (2 * 2) + 1 = 5 (minimum)Recommended: 10~20 (adjust per workload)3. JVM Heap Pressure
At -Xmx1g: Trie (~66MB) + Caffeine 3 caches (~100MB) + Spring Context (~200MB) + GC headroom (~200MB). Under stress, 200 concurrent requests’ temporary objects may trigger Full GC (STW).
4. Tomcat Thread Pool
Spring Boot default: 200 Tomcat threads. If all 200 VUs are active simultaneously, the thread pool fills and additional requests queue.
1st Stress Results (Before Tuning, 200 VU, 25min)
k6 Console Results
| Scenario | Avg | P95 | Max |
|---|---|---|---|
| Overall | 290ms | 1,413ms | - |
| Search (all) | 213ms | 953ms | - |
| Search (rare 10%) | 146ms | 699ms | 6.88s |
| Search (mid-freq 60%) | 151ms | 715ms | 6.76s |
| Search (high-freq 30%) | 359ms | 1,592ms | 6.92s |
| Autocomplete | 94ms | 399ms | 4.45s |
| Post listing | 268ms | 1,287ms | 4.94s |
| Detail view | 308ms | 1,257ms | 6.20s |
| Write (create+like) | 269ms | 1,211ms | - |
| Error rate | 0.00% | ||
| Total requests | 101,984 |
Grafana Overview
| Metric | Value |
|---|---|
| Avg response time | 230ms |
| P95 | 1.21s |
| P99 | 2.49s |
| Error rate | 0.00128% |
| Max TPS | 110 req/s |
Bottleneck Analysis
#1 Bottleneck: CPU Saturation (Most Critical)
| Metric | Value | Evidence |
|---|---|---|
| App CPU | 100% saturated | Grafana process CPU panel |
| cAdvisor wiki-app-prod | 150%+ (1.5 of 2 cores) | cAdvisor CPU panel |
| Load Average (1m) | 20+ (18 processes waiting on 2 cores) | Host Load Average |
| Saturation point | ~5min after 200 VU entry | VU graph and CPU graph crossover |
CPU saturated while processing Lucene BM25 search (especially high-frequency tokens “대한민국”, “history”) and DB queries simultaneously. High-frequency tokens have the highest P95 (1,592ms) because longer posting lists require more CPU for BM25 scoring.
#2 Bottleneck: HikariCP Connection Pool Pressure
| Metric | Normal (100 VU) | Overload (200 VU) |
|---|---|---|
| Active Connections | ~10/20 | 60+/20 (exceeds max) |
| Pending | 0 | 40+ |
| Acquire Time | 0.05ms | 1,250ms |
Active reaching 60 despite Max=20: CPU saturation slowed request processing, extending connection hold time. Not a pool size issue — CPU is the root cause.
Not Bottlenecks
| Item | Value | Verdict |
|---|---|---|
| JVM Heap | 256MB / 1GB | Plenty of headroom |
| GC Pause | Max 3ms | No issue |
| InnoDB Buffer Pool | 100% hit rate | DB cache healthy |
| Table Lock | 0 | No contention |
Cache Hit Rates
| Cache | Hit Rate | Note |
|---|---|---|
| autocomplete | 100% | Trie + Caffeine perfect hit |
| searchResults | 96.0% | Mostly cache-served |
| postDetail | 71.4% | Random ID access → more misses |
Even at 96% searchResults hit rate, 4% cache misses at 200 VU = ~8 req/s Lucene searches, which saturates CPU.
Breaking Point Summary
Single server (ARM 2 cores, 12GB RAM, JVM -Xmx1g) limits: Stable zone: ~100 VU (P95 < 500ms, CPU 40%) Limit zone: ~150 VU (P95 ~ 1s, CPU 80%) Saturated: 200 VU (P95 > 1.4s, CPU 100%, HikariCP exhausted) Errors: None (0% error rate) — slows down but doesn't crash
→ Practical single server limit: ~100-150 concurrent usersJVM/Tomcat Tuning Attempt
Server Memory Allocation
Applied Tuning
| Item | Before | After | Intent |
|---|---|---|---|
| -Xmx | 1g | 2g | More GC headroom |
| -Xms | (JVM default) | 2g | Eliminate heap resizing overhead |
| Tomcat max-threads | 200 | 100 | Reduce context switching |
| Tomcat accept-count | 100 | 50 | Limit queue waiting |
| app_memory_limit | 2G | 4G | JVM 2g + metaspace/threads |
HikariCP (No Changes)
The 1st stress showed HikariCP Active exceeding Max(20) because CPU saturation slowed request processing, extending connection hold time — not because the pool was too small. Increasing pool size wouldn’t fix a CPU problem.
2nd Stress Results (After Tuning — Backfired)
Result: Every metric got worse.
| Metric | 1st (Before) | 2nd (After) | Change |
|---|---|---|---|
| Total requests | 101,984 | 61,636 | -40% |
| Avg response | 290ms | 519ms | +79% worse |
| P95 | 1,413ms | 1,714ms | +21% worse |
| Error rate | 0.00% | 0.22% | Errors appeared |
| Autocomplete avg | 94ms | 327ms | +248% worse |
| searchResults hit | 96% | 91.8% | -4.2% drop |
| postDetail hit | 71.4% | 50% | -21.4% drop |
Root Cause of Backfire
1. Tomcat max-threads 200→100 Was the Key Degradation Factor
Under CPU-bound bottleneck, reducing threads reduces concurrent processing capacity. 200 VUs hitting 100 threads means 100 VUs queue. Queue wait time adds to response time.
2. Xmx 2g Was Never Actually Applied
$ docker exec wiki-app-prod java -XshowSettings:vm -version 2>&1 | grep -i heap Max. Heap Size (Estimated): 512.00M512MB — not even 1g, let alone 2g.
Cause: GitHub Actions deployment only replaces the Docker image (code). Ansible group_vars (environment variables) are only applied when the Ansible Playbook runs. The group_vars/all.yml was modified locally but never pushed to GitHub, so .env.prod wasn’t updated.
Fix: ansible-vault encrypt group_vars/all.yml → git push → applied on next deployment.
This taught us that “code deployment” and “infrastructure config deployment” are separate things.
3. app_memory_limit 4G Reduced Lucene Page Cache
Docker container claiming 4G reduced OS page cache (for Lucene MMap) from 5G to 3G, likely lowering cache hit rates.
Three Lessons Learned
1. Reducing threads under CPU-bound bottleneck is wrong tuning. The intent was to reduce context switching, but it actually reduced concurrent processing capacity, only lengthening queue wait times. When CPU is the fundamental limit, JVM/thread tuning cannot solve it.
2. Always verify that tuning was actually applied. Checked with
docker exec ... java -XshowSettings:vm. The assumption “deployed = applied” is dangerous.3. Record failed tunings too. “Reduced Tomcat threads to 100 and it got 79% worse, so we reverted and learned that CPU-bound problems need more CPU, not fewer threads” is far more powerful in interviews than pretending it worked.
Rollback + Final Conclusion
All settings reverted to 1st stress baseline.
| Attempt | Result | Verdict |
|---|---|---|
| 1st stress (default) | CPU 100%, P95 1.4s, 0% errors | Single server limit = ~100-150 VU |
| 2nd stress (Tomcat 100, Xmx not applied) | All metrics 40-79% worse, 0.22% errors | Tuning backfired + deployment missed |
| After rollback | Same as 1st | Cannot exceed this limit with tuning on this server |
Distributed transition justified: Single server (ARM 2 cores) limit is ~100-150 concurrent users. JVM/Tomcat tuning cannot break this limit. Fundamentally reducing CPU load requires Redis L2 cache (reducing DB/Lucene access) and App scale-out (distributing CPU).
Why GC Tuning Was Not the Solution
JVM/Tomcat tuning was attempted, but it had no effect because the fundamental bottleneck was CPU itself, not GC.
GC status confirmed in the 1st stress test:
- GC pause: max 3ms (no issue)
- Full GC: 0 occurrences (never happened)
- JVM Heap: 256MB / 1GB (plenty of headroom)
GC tuning is needed when “GC pauses in the hundreds of ms to seconds consume response time.” In this project, GC was within normal range, and the real bottleneck was 100% CPU saturation. Reducing Tomcat threads was attempted but only reduced concurrent processing capacity under a CPU-bound situation, resulting in 79% degradation. “Tuning something that isn’t the bottleneck has no effect or backfires” — confirmed through measurement.
The established optimization order:
- Application-level optimization (code, queries, caching) — completed through Caching Strategy to Trie Autocomplete
- Architecture changes (distributed cache, DB distribution, scale-out) — next phase
- JVM/GC tuning — only when GC is the bottleneck after completing 1 and 2
Scale Up vs Scale Out
| Scale Up (increase server specs) | Scale Out (increase server count) | |
|---|---|---|
| Method | 2 cores→4 cores, RAM 12G→24G | 2→3 servers + load balancer |
| Pros | Simple, no code changes | Unlimited expansion, high availability, fault isolation |
| Cons | Physical limits, cost spikes | State sharing issues (sessions, cache) |
| Suited for | Short-term fix, when spec headroom exists | Long-term scaling, high availability needed |
Why scale-out was chosen for this project:
- Oracle Cloud Free Tier prevents scale-up — ARM 2 cores/12GB is the Free Tier maximum
- CPU is the bottleneck — more cores are needed, impossible on the same server
- High availability — with 1 server, any failure means total service outage. 2+ servers enable fault isolation
- Portfolio value — scale-up is just “upgraded server specs,” but scale-out demonstrates engineering judgment in Redis cache consistency, load balancing, session sharing, etc.
In practice, the typical approach is “scale up first (simple) → scale out when limits are hit (scalability).” Due to Free Tier constraints making scale-up impossible, we proceed directly to scale-out.
CPU Bottleneck Resolution Order — Why Not Scale Out Immediately
CPU being the bottleneck doesn’t mean immediately adding more servers. In practice, this order is followed:
| Step | Optimization | Applied | Status |
|---|---|---|---|
| Verify real CPU bottleneck | lock / IO wait / GC / context switching can look like CPU | Grafana: CPU 100%, GC 3ms, Lock 0, IO wait none | Real CPU bottleneck confirmed |
| Caching | Caffeine L1 (hit rate 96%) | Caching Strategy | Done |
| Algorithm | LIKE → Lucene BM25 inverted index | Lucene Migration | Done |
| Data optimization | Slice conversion, snippet 150 chars (260KB→3KB) | COUNT(*) Elimination | Done |
| Precompute | Search logs → Trie popularity | Trie Autocomplete | Done |
| JVM/Tomcat tuning | Tomcat thread reduction → backfired | This post | Failed (reverted) |
| Scale up | Impossible due to Free Tier constraints | - | Impossible |
| → Scale out | Redis L2 + Replication + multi-instance | Next | Next |
Scale-out is a “last resort.” It is chosen after completing code optimization, caching, and algorithm improvements, confirming CPU is still the bottleneck, and scale-up is impossible. Not because “Redis is good” or “MSA is trendy,” but because there is concrete evidence: “stress test confirmed CPU 100% + tuning backfired + scale-up impossible.”
Reference: Large-Scale Autocomplete Pipeline Design
Current vs Large-Scale
| Scale | Log Aggregation | Autocomplete Serving |
|---|---|---|
| Single server (current) | SQL GROUP BY | Trie → Redis flat KV |
| Large-scale batch | Spark SQL (hourly) | Redis Cluster |
| Large-scale real-time | Kafka + Flink (per-second) | Redis Cluster + CDC |
On “MapReduce”
“MapReduce” is not the Hadoop MapReduce framework but the thinking pattern of “distribute data → group → aggregate.”
Current industry (2025):
- Hadoop MapReduce is only used in government/legacy enterprise systems
- New projects use Spark SQL or Flink
- Spark SQL uses its own execution engine (DAG + Catalyst Optimizer), not the MapReduce framework
References

댓글
댓글 수정/삭제는 GitHub Discussions에서 가능합니다.