캐싱 전략: Caffeine L1 로컬 캐시로 검색 응답 14배 개선
목차
이전 글
검색 품질 고도화: 구절 검색, 커뮤니티 랭킹, P@10/MAP 평가에서 PhraseQuery(slop=2)로 구절 검색을 구현하고, BM25 + FeatureField(viewCount, likeCount) + RecencyDecay 결합 랭킹을 적용했습니다.
이전 글 요약
이전 글에서 검색 품질을 고도화했습니다.
15개 테스트 쿼리로 P@10/MAP을 측정하여 검색 품질을 정량적으로 평가했습니다.
| 지표 | BM25 only | Full Ranking | 개선율 |
|---|---|---|---|
| P@10 | 0.827 | 0.853 | +3.2% |
| MAP | 0.862 | 0.874 | +1.4% |
개선율이 소폭인 이유: 초기 데이터(위키 덤프) 특성상 대부분의 게시글이 viewCount=0, likeCount=0.
실제 커뮤니티 운영 시 인기도 신호가 쌓이면 차이가 더 커질 것으로 예상.
개요
참고: 정보 검색 13.4장 캐싱
현재 아키텍처
검색 품질 고도화까지의 아키텍처:

현재 요청 흐름:
- 검색: 클라이언트 → API 서버 → Lucene 검색 (JVM 내부, SearcherManager acquire/release)
- 자동완성: 클라이언트 → API 서버 → Lucene PrefixQuery
- 목록 조회: 클라이언트 → API 서버 → MySQL SELECT (Deferred Join)
- 상세 조회: 클라이언트 → API 서버 → MySQL SELECT
검색/자동완성은 Lucene이 JVM 내부에서 처리하므로 MySQL 부하가 아닌 JVM CPU/메모리 부하입니다.
목록/상세 조회는 여전히 MySQL을 직접 거칩니다. 캐싱 레이어는 없습니다.
왜 캐싱이 필요한가
검색 쿼리의 특성: 반복적입니다.
검색 트래픽은 Zipf 분포를 따릅니다. 소수의 인기 검색어가 전체 트래픽의 대부분을 차지합니다. 위키피디아의 경우 상위 1%의 문서가 전체 조회수의 약 80%를 차지합니다.
이 말은 같은 검색어에 대해 Lucene이 같은 검색을 반복 실행하고 있다는 뜻입니다. “대한민국”을 100명이 검색하면, SearcherManager acquire → BM25 검색 → DB에서 Post 엔티티 조회를 100번 반복합니다. 99번은 낭비입니다.

핵심 문제: 부하를 줄여야 비용이 줄어듭니다.
Lucene 전환 이후, 검색 부하의 병목은 두 곳입니다:
- JVM CPU: Lucene BM25 검색, SearcherManager acquire/release, 인덱스 I/O
- MySQL: 검색 결과 Post ID → DB에서 엔티티 조회, 목록/상세 조회
검색 결과를 캐싱하면 Lucene 검색 + DB 엔티티 조회가 모두 스킵됩니다. JVM CPU와 DB 부하가 동시에 줄어듭니다.
속도 향상과 비용 절감은 인과관계입니다. 캐시가 검색 결과를 0.1ms 만에 반환하면, 그 요청은 MySQL의 CPU를 전혀 사용하지 않습니다. CPU를 안 쓰면 같은 인스턴스에서 더 많은 요청을 처리할 수 있고, 그러면 더 비싼 인스턴스로 올릴 필요가 없습니다. 즉, 속도가 빨라지면 비용이 줄어드는 건 당연한 결과입니다.
이 단계의 목표
Caffeine 로컬 캐시(L1)를 도입하여 반복 요청의 Lucene + DB 부하를 80%+ 감소시킵니다.
| # | 내용 | 상태 |
|---|---|---|
| 1. Caffeine 캐시 설정 | @EnableCaching + CacheManager + 캐시별 정책 | 구현 완료 |
| 2. 검색/자동완성 캐싱 | @Cacheable 적용 (search, autocomplete) | 구현 완료 |
| 3. 캐시 무효화 | @CacheEvict (게시글 수정/삭제 시) | 구현 완료 |
| 4. Cache Stampede 방지 | Caffeine의 내장 기능 + 전략 선택 | 구현 완료 |
| 5. 브라우저 캐싱 | Cache-Control 헤더 (자동완성 API) | 구현 완료 |
| 6. 캐시 모니터링 | Actuator + Caffeine recordStats | 구현 완료 |
Caffeine 의존성은 이미 존재:
TokenBlacklist에서 JWT 블랙리스트용으로 사용 중.
Spring Cache 추상화(@Cacheable, CacheManager)는 미적용 상태였습니다.
비용 분석 및 대안 검토
비용 시나리오 분석
실제 AWS 서울 리전 가격 기준으로, DB 비용을 월 20만원 수준으로 사용하고 있다고 가정합니다.
DB 중심 아키텍처의 비용 구조:
현재 구조에서 트래픽이 증가하면 선택지는 두 가지뿐입니다:
- DB 스케일업: 더 비싼 인스턴스로 교체
- Read Replica 추가: 읽기 전용 복제본 추가
둘 다 비용이 선형으로 증가합니다.
AWS RDS MySQL 기준 서울 리전 실제 가격:
| 인스턴스 | vCPU | 메모리 | 월 비용 |
|---|---|---|---|
| db.t4g.medium | 2 | 4 GiB | ~$74 (~10만원) |
| db.t3.medium | 2 | 4 GiB | ~$76 (~10.2만원) |
| db.r6g.large | 2 | 16 GiB | ~$200 (~27만원) |
| db.r6g.xlarge | 4 | 32 GiB | ~$400 (~54만원) |
AWS 공식 벤치마크에서 30,000 QPS를 달성하기 위해:
- RDS만 사용: db.r5.xlarge 1대 + Read Replica 4대 = $1,740/월 (~235만원)
- RDS + ElastiCache: db.r5.xlarge 1대 + ElastiCache 클러스터 = $780/월 (~105만원) → 55% 절감
출처: AWS Database Blog — Optimize cost and boost performance of RDS for MySQL using ElastiCache for Redis
시나리오별 비용 비교
| 시나리오 | DB 비용 | 캐시 비용 | 총 비용 | 절감률 |
|---|---|---|---|---|
| A: DB만 (현재) | ~20만원 | 0원 | ~20만원 | 기준 |
| B: DB + Redis | ~7~8만원 | ~2.4만원 | ~10만원 | ~50% |
| C: DB + CDN | ~10만원 | ~0.5만원 | ~10.5만원 | ~47% |
| D: DB + Caffeine + CDN | ~10만원 | ~0원 | ~10만원 | ~50% |
핵심은 “캐시를 추가하니까 비용이 더 들었다”가 아니라, “캐시 덕분에 DB 부하가 줄어서 DB 스펙을 낮출 수 있었고, 총 비용이 줄었다”는 흐름입니다.
서버가 1대이고 트래픽이 크지 않은 현 시점에서는, 시나리오 D (Caffeine + CDN)가 비용 대비 가장 효율적입니다. 서버가 여러 대로 늘어나면 그때 Redis를 도입하면 됩니다.
대안 검토: Redis vs CDN vs Caffeine
성능 비교
| 레이어 | 레이턴시 | 네트워크 오버헤드 | 일관성 |
|---|---|---|---|
| Caffeine (JVM 내부) | 마이크로초 (< 0.1ms) | 없음 (같은 JVM) | 인스턴스 로컬만 |
| Redis (분산 캐시) | ~0.5-2ms (같은 리전) | TCP 왕복 | 인스턴스 간 공유 |
| CDN 엣지 | ~5-50ms (전세계) | HTTP | 전파 지연 있음 |
| MySQL (캐시 없이) | ~6-500ms (쿼리 종류별) | TCP + 디스크 I/O | Source of Truth |
DB도 InnoDB Buffer Pool이라는 자체 메모리 캐시가 있습니다. Buffer Pool이 뜨거운(warm) 상태라면 디스크 I/O 없이 메모리에서 데이터를 반환하므로, 단순 SELECT는 Redis와 극적인 차이가 나지 않을 수 있습니다. 차이가 나는 건 CPU 집약적인 쿼리(FULLTEXT 검색, 복잡한 JOIN, 정렬)와 동시 접속 수가 많을 때입니다.
어떤 상황에서 어떤 캐시를 쓰는가
| 상황 | 추천 | 이유 |
|---|---|---|
| 서버 1대, 트래픽 소규모 | Caffeine | 비용 0원, 구현 가장 단순 |
| 서버 여러 대, 캐시 일관성 필요 | Redis | 인스턴스 간 캐시 공유 |
| 정적/반정적 콘텐츠 | CDN | 전세계 사용자 대응, DB 부하 분산 |
| 인기 검색어 캐싱 | Caffeine (L1) + Redis (L2) | 2계층 캐시로 최적 성능 |
| 게시글 상세 페이지 | CDN + Caffeine | 내용 변경이 드물고 조회가 빈번 |
| 자동완성 | Caffeine | 상위 N개 결과는 변하지 않음, 초저지연 필요 |
멀티 레이어 캐시 아키텍처
실무에서는 한 가지 캐시만 쓰지 않습니다. 카카오페이, 올리브영 등 국내 기업들이 실제로 사용하는 구조입니다:

카카오페이는 L1(Caffeine) → L2(Redis) → DB 3계층 캐시를 사용하며, Redis Pub/Sub로 L1 캐시 동기화를 처리합니다.
올리브영은 대규모 프로모션 트래픽에서 ElastiCache Network Bytes Out이 포화되는 문제를 겪었고, Caffeine L1 캐시를 추가하여 Redis 네트워크 I/O를 줄였습니다.
출처: 카카오페이 — 분산 시스템에서 로컬 캐시 활용하기, 올리브영 — 로컬 캐시와 Redis로 대규모 증정 행사 관리 최적화
현업 사례
AWS 공식 벤치마크
30,000 QPS 달성 시나리오에서 RDS 단독 대비 RDS + ElastiCache 조합이 55% 비용 절감, 80배 빠른 읽기 성능을 달성했습니다. ElastiCache 노드 1개가 초당 250,000건 이상 처리 가능하므로, Read Replica 4대를 Redis 1대로 대체할 수 있었습니다.
출처: AWS Database Blog — Optimize cost and boost performance of RDS for MySQL using ElastiCache for Redis
채널톡 (channel.io)
분산 캐시 도입으로 RDB 조회를 1,500 TPS에서 100 TPS 미만으로 줄였습니다. 93% 감소. 캐시 히트율은 거의 100%에 도달했습니다. Probabilistic Early Expiration으로 TTL 만료 직전에 미리 캐시를 갱신하여 Cache Stampede를 방지했습니다.
Kicker (독일 축구 미디어)
월 20억 페이지뷰, 연 15% 성장하는 트래픽에서 Redis Enterprise 도입 후 웹 서버 비용 40% 절감, DB 서버 비용 60% 절감을 달성했습니다. 기존 하드웨어를 완전히 퇴역시켰습니다.
카카오톡
초당 400만 건 이상의 데이터 접근 요청을 처리합니다. 기존에 256대의 물리 서버에서 Memcached를 운영하다가, Kubernetes + Redis 캐시 팜 아키텍처로 전환했습니다. hostNetwork을 사용하여 Kubernetes Ingress/Service 레이어를 제거하고, Redis 노드가 직접 통신하도록 하여 네트워크 오버헤드를 최소화했습니다.
출처: 카카오 테크 — 카카오톡 캐싱 시스템의 진화, 카카오 테크 — 쿠버네티스에 레디스 캐시 클러스터 구축기
네이버페이
로컬 캐시 솔루션으로 Ehcache와 Caffeine을 비교 평가했습니다. Caffeine의 Window TinyLfu 캐시 축출 정책이 Ehcache의 LRU/LFU보다 벤치마크에서 우수했고, 읽기/쓰기 모두 Caffeine이 더 빨랐습니다.
1. Caffeine 캐시 설정
목표
- Spring Cache 추상화 활성화 (
@EnableCaching) - 캐시 대상별 독립 정책 (TTL, 최대 크기, 축출 전략)
- Caffeine
recordStats()로 히트율 수집
현재 상태
Caffeine 의존성: O (build.gradle에 caffeine:3.2.0)Spring Cache: X (@EnableCaching 미설정, CacheManager 미등록)@Cacheable: X (어디에도 미사용)TokenBlacklist는 Caffeine을 직접 사용(Cache<String, Boolean>)하지만,
Spring Cache 추상화(@Cacheable)를 쓰지 않는 수동 방식이었습니다.
이번 단계에서 Spring Cache 추상화를 도입하여 선언적 캐싱을 적용합니다.
캐싱 대상 분석
Lucene 전환에서 검색을 Lucene으로 전환했으므로, 포스팅 리스트는 Lucene이 MMapDirectory + OS page cache로 내부 캐싱합니다.
앱 레벨에서 캐싱할 대상은 3가지입니다:

포스팅 리스트 캐싱: Lucene MMapDirectory가 OS page cache를 활용하므로 별도 앱 캐시가 필요 없습니다
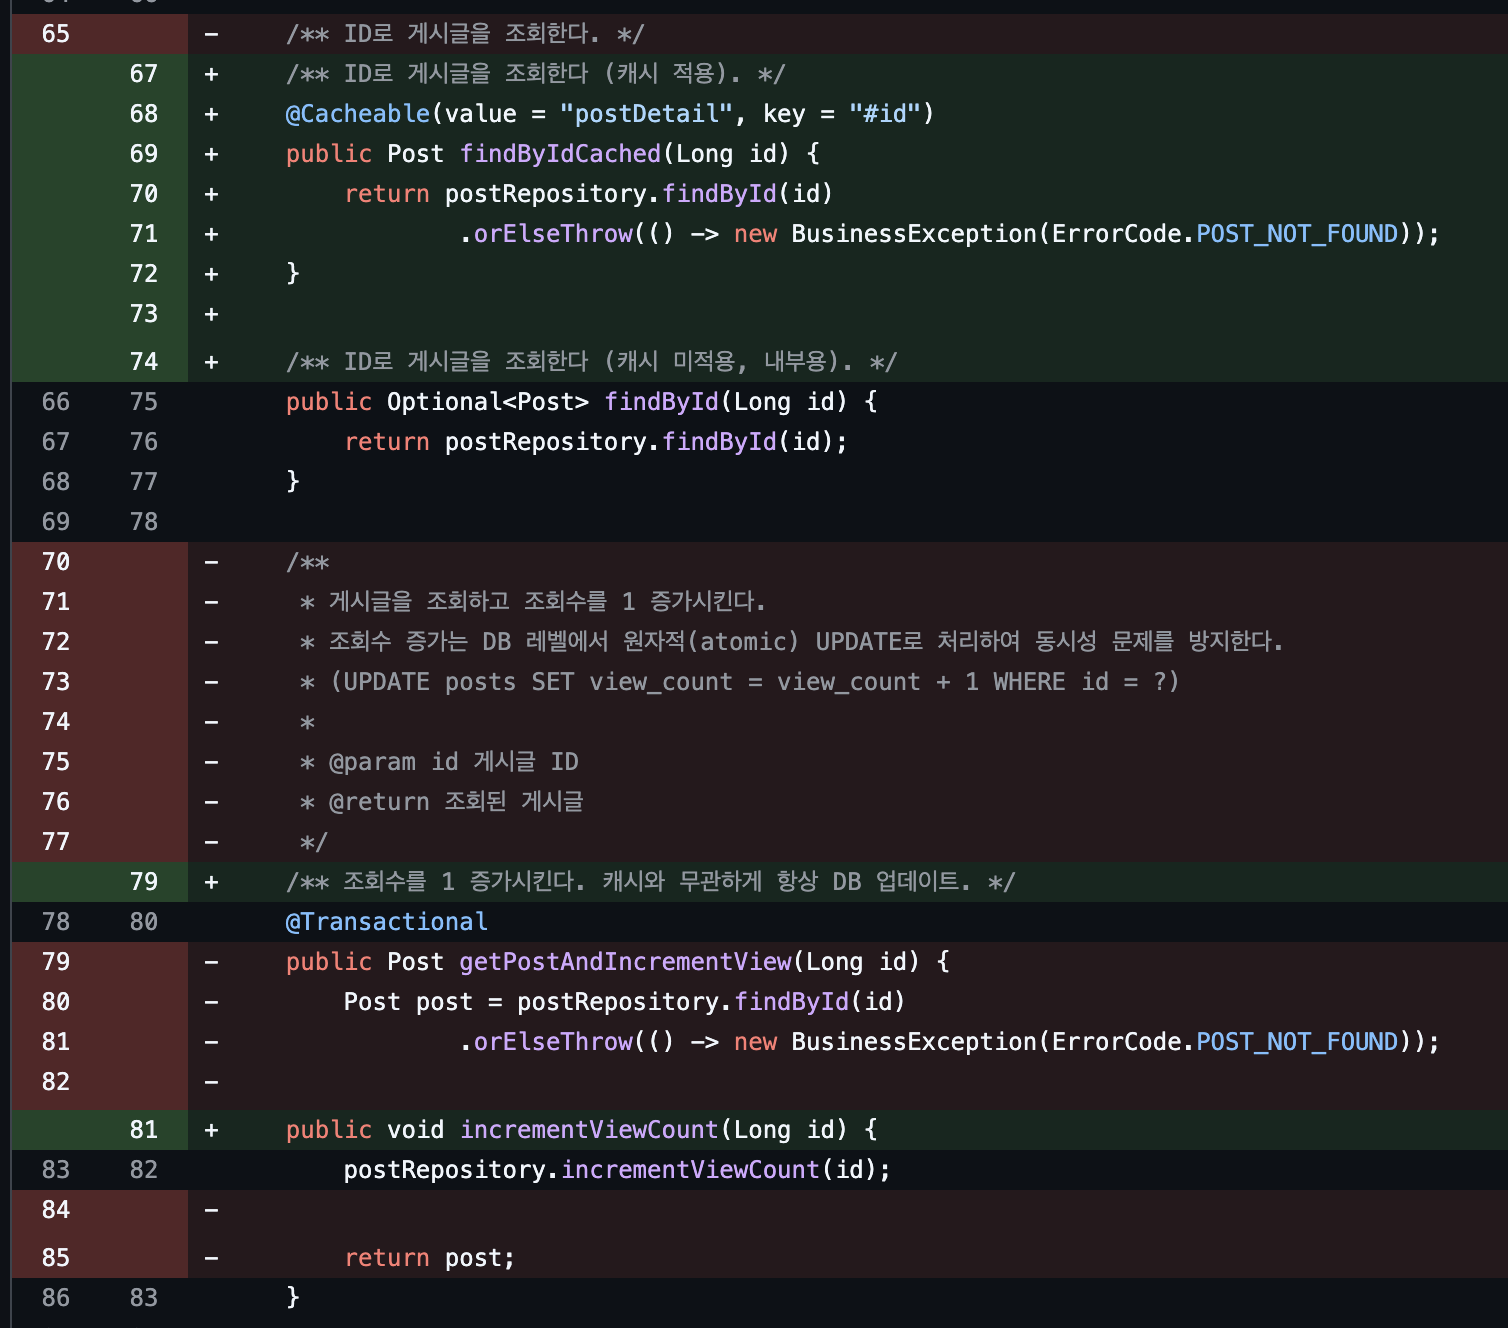
게시글 상세 캐싱 설계 결정
문제: getPostAndIncrementView()는 조회와 동시에 viewCount를 증가시킵니다.
이 메서드에 @Cacheable을 걸면 캐시 히트 시 viewCount가 증가하지 않습니다.
선택지:
| 방안 | 장점 | 단점 |
|---|---|---|
| A. 캐싱하지 않음 | viewCount 정확 | DB 매번 조회 |
| B. 읽기/쓰기 분리 | viewCount 정확 + 캐시 | 코드 복잡 |
| C. 캐싱 + 비동기 viewCount | 캐시 히트 + count 반영 | 약간의 오차 |
B안 (읽기/쓰기 분리) 채택:
// 읽기: 캐싱 대상@Cacheable(value = "postDetail", key = "#id")public Post findById(Long id) { ... }
// 쓰기: viewCount 증가만 (캐시와 무관)public void incrementViewCount(Long id) { postRepository.incrementViewCount(id); }컨트롤러에서 두 메서드를 조합:
Post post = postService.findByIdCached(id); // 캐시 히트 가능postService.incrementViewCount(id); // 항상 DB 업데이트캐시 정책 설계
| 캐시 | 최대 크기 | TTL | 축출 정책 | 이유 |
|---|---|---|---|---|
| searchResults | 10,000 | 5분 (expireAfterWrite) | W-TinyLFU | 검색어+페이지 조합이 다양, CPU 집약적인 Lucene 검색을 캐싱 |
| autocomplete | 10,000 | 10분 (expireAfterWrite) | W-TinyLFU | prefix 종류가 제한적, 결과가 자주 안 변함 |
| postDetail | 50,000 | 30분 (expireAfterAccess) | W-TinyLFU | 인기 게시글 반복 조회가 많음, 수정/삭제 시 즉시 무효화 |
W-TinyLFU: Caffeine의 기본 축출 정책. LRU + LFU를 결합하여 최근성과 빈도를 모두 고려합니다.
네이버페이 벤치마크에서 Ehcache(LRU)보다 Caffeine(W-TinyLFU)이 히트율과 처리속도 모두 우수했습니다.
TTL에 랜덤 편차(예: 기본 TTL +/- 10%)를 추가하면, 동일 시점에 대량의 캐시가 동시 만료되는 Cache Stampede를 방지할 수 있습니다. Instagram이 피드 캐싱에서 이 기법을 사용합니다.
캐시 크기 vs 히트율 트레이드오프
| 캐시 크기 | 메모리 사용 | 예상 히트율 | 비고 |
|---|---|---|---|
| 1K entries | ~10MB | ~30% | 너무 작음 |
| 10K entries | ~100MB | ~60% | 균형점 |
| 100K entries | ~1GB | ~85% | 메모리 부담 |
| 무제한 | OOM 위험 | 100% | 실용적이지 않음 |
검색 쿼리는 롱테일(Zipf) 분포를 따르므로, 상위 1,000개 검색어만 캐싱해도 상당한 히트율을 달성할 수 있습니다.
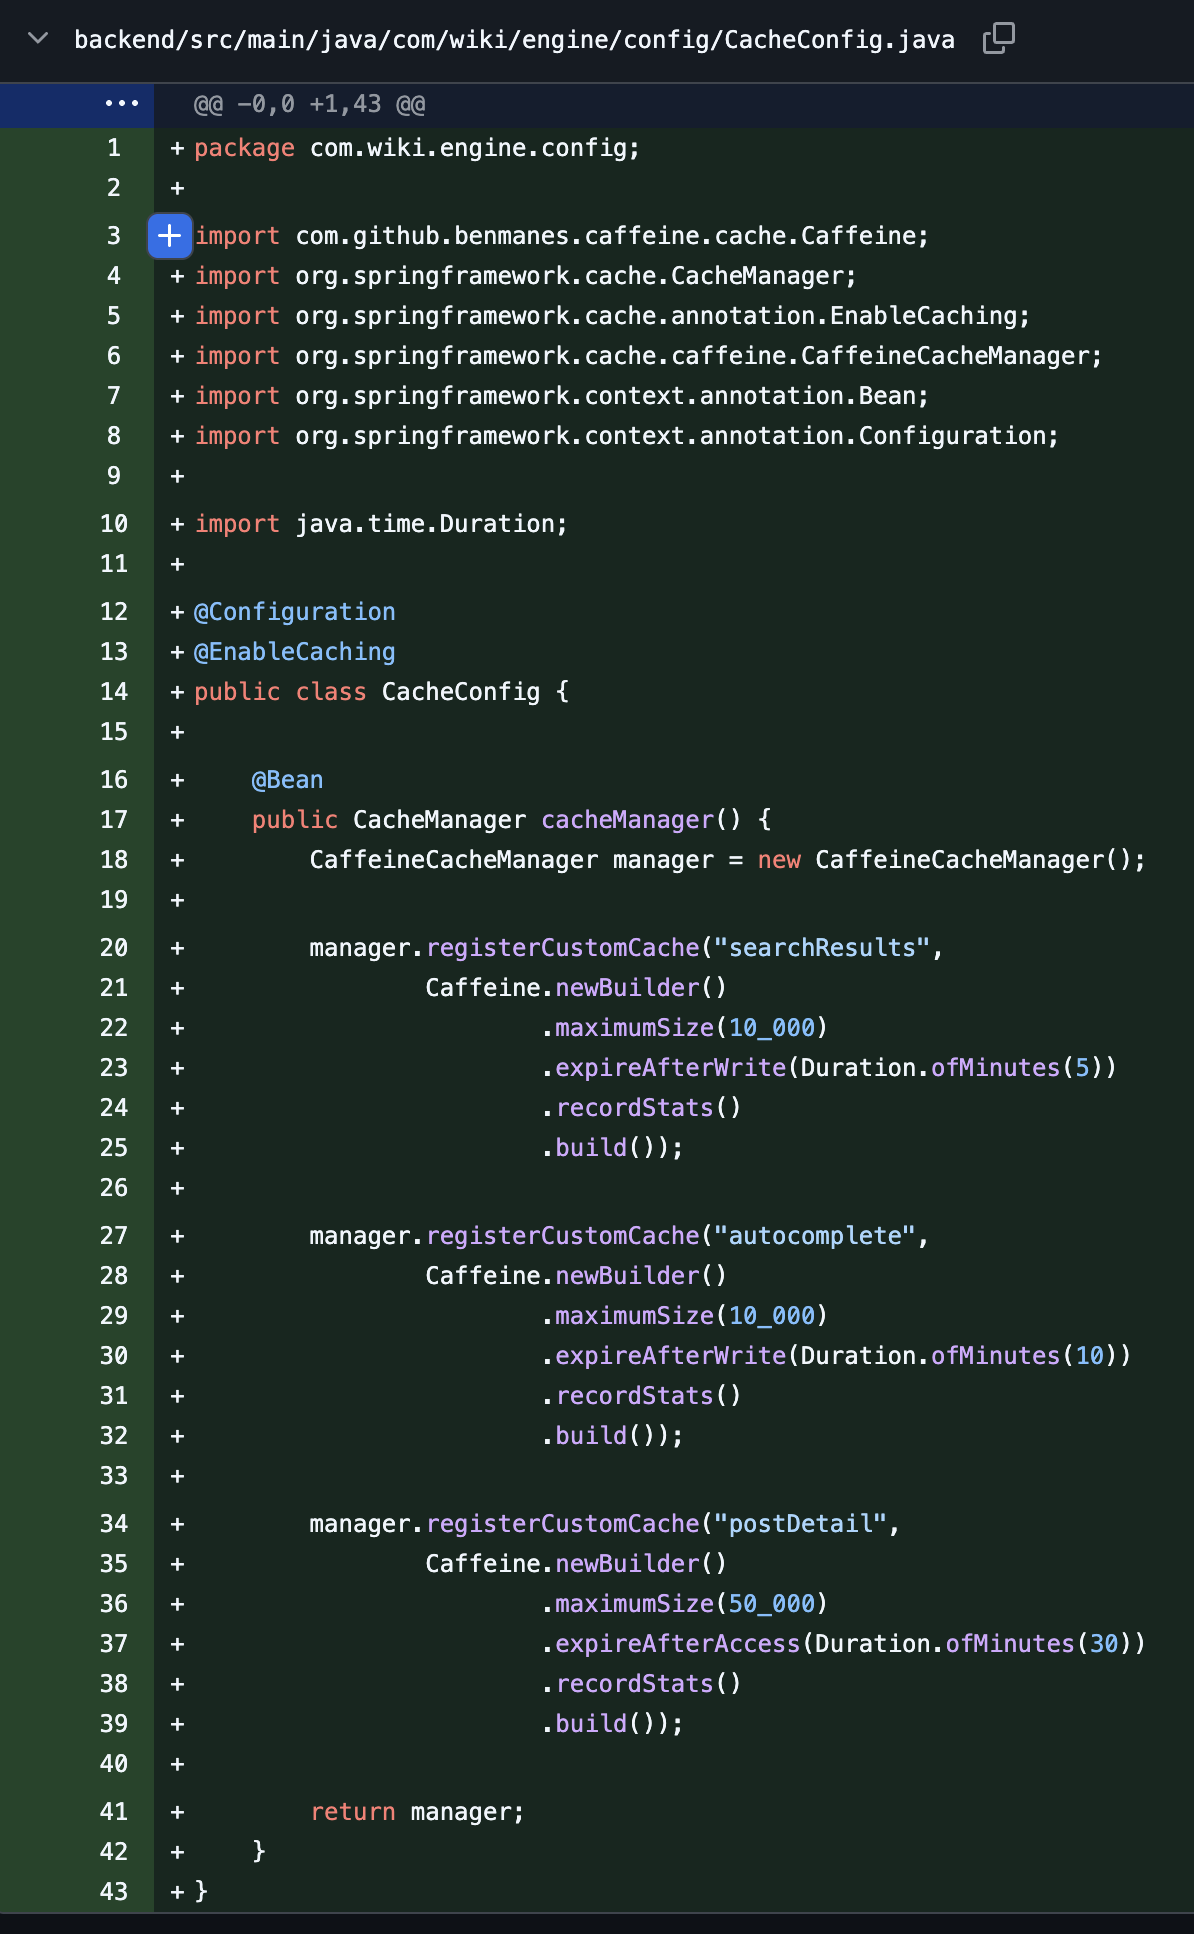
구현
@Configuration@EnableCachingpublic class CacheConfig {
@Bean public CacheManager cacheManager() { CaffeineCacheManager manager = new CaffeineCacheManager();
// 1. 검색 결과 캐시 (검색어+페이지 → Page<Post>) manager.registerCustomCache("searchResults", Caffeine.newBuilder() .maximumSize(10_000) .expireAfterWrite(Duration.ofMinutes(5)) .recordStats() .build());
// 2. 자동완성 캐시 (prefix → title 목록) manager.registerCustomCache("autocomplete", Caffeine.newBuilder() .maximumSize(10_000) .expireAfterWrite(Duration.ofMinutes(10)) .recordStats() .build());
// 3. 게시글 상세 캐시 (postId → Post 엔티티) manager.registerCustomCache("postDetail", Caffeine.newBuilder() .maximumSize(50_000) .expireAfterAccess(Duration.ofMinutes(30)) .recordStats() .build());
return manager; }}2. 검색/자동완성 캐싱 (@Cacheable)
Cache-Aside 패턴
검색에서 가장 일반적인 캐싱 전략은 Cache-Aside(Lazy Loading)입니다. 애플리케이션이 캐시와 DB를 명시적으로 관리합니다.

캐시 적용
@Cacheable(value = "searchResults", key = "#keyword + ':' + #pageable.pageNumber + ':' + #pageable.pageSize")public Page<Post> search(String keyword, Pageable pageable) { validatePageLimit(pageable, MAX_SEARCH_PAGE); try { return luceneSearchService.search(keyword, pageable); } catch (IOException e) { throw new UncheckedIOException(e); }}
@Cacheable(value = "autocomplete", key = "#prefix")public List<String> autocomplete(String prefix) { try { return luceneSearchService.autocomplete(prefix, 10); } catch (IOException e) { throw new UncheckedIOException(e); }}캐시 키 설계
| 캐시 | 키 패턴 | 예시 |
|---|---|---|
| searchResults | {keyword}:{page}:{size} | "삼성전자:0:20" |
| autocomplete | {prefix} | "삼성" |
| postDetail | {postId} | 12345 |
주의: 검색 캐시 키에 pageSize도 포함해야 합니다. 같은 keyword + page=0이라도 size=10과 size=20은 다른 결과입니다.
@Cacheable과 @Transactional 충돌 주의
현재 PostService는 클래스 레벨에 @Transactional(readOnly = true)가 걸려있습니다.
@Cacheable은 AOP 프록시 기반이므로 같은 클래스 내 다른 메서드에서 호출하면 캐시가 동작하지 않습니다(self-invocation 문제).
현재 search()와 autocomplete()는 컨트롤러에서 직접 호출되므로 문제없습니다.
단, getPostAndIncrementView() 내부에서 캐시된 findById()를 호출하면 self-invocation이 되므로,
컨트롤러에서 분리 호출해야 합니다.
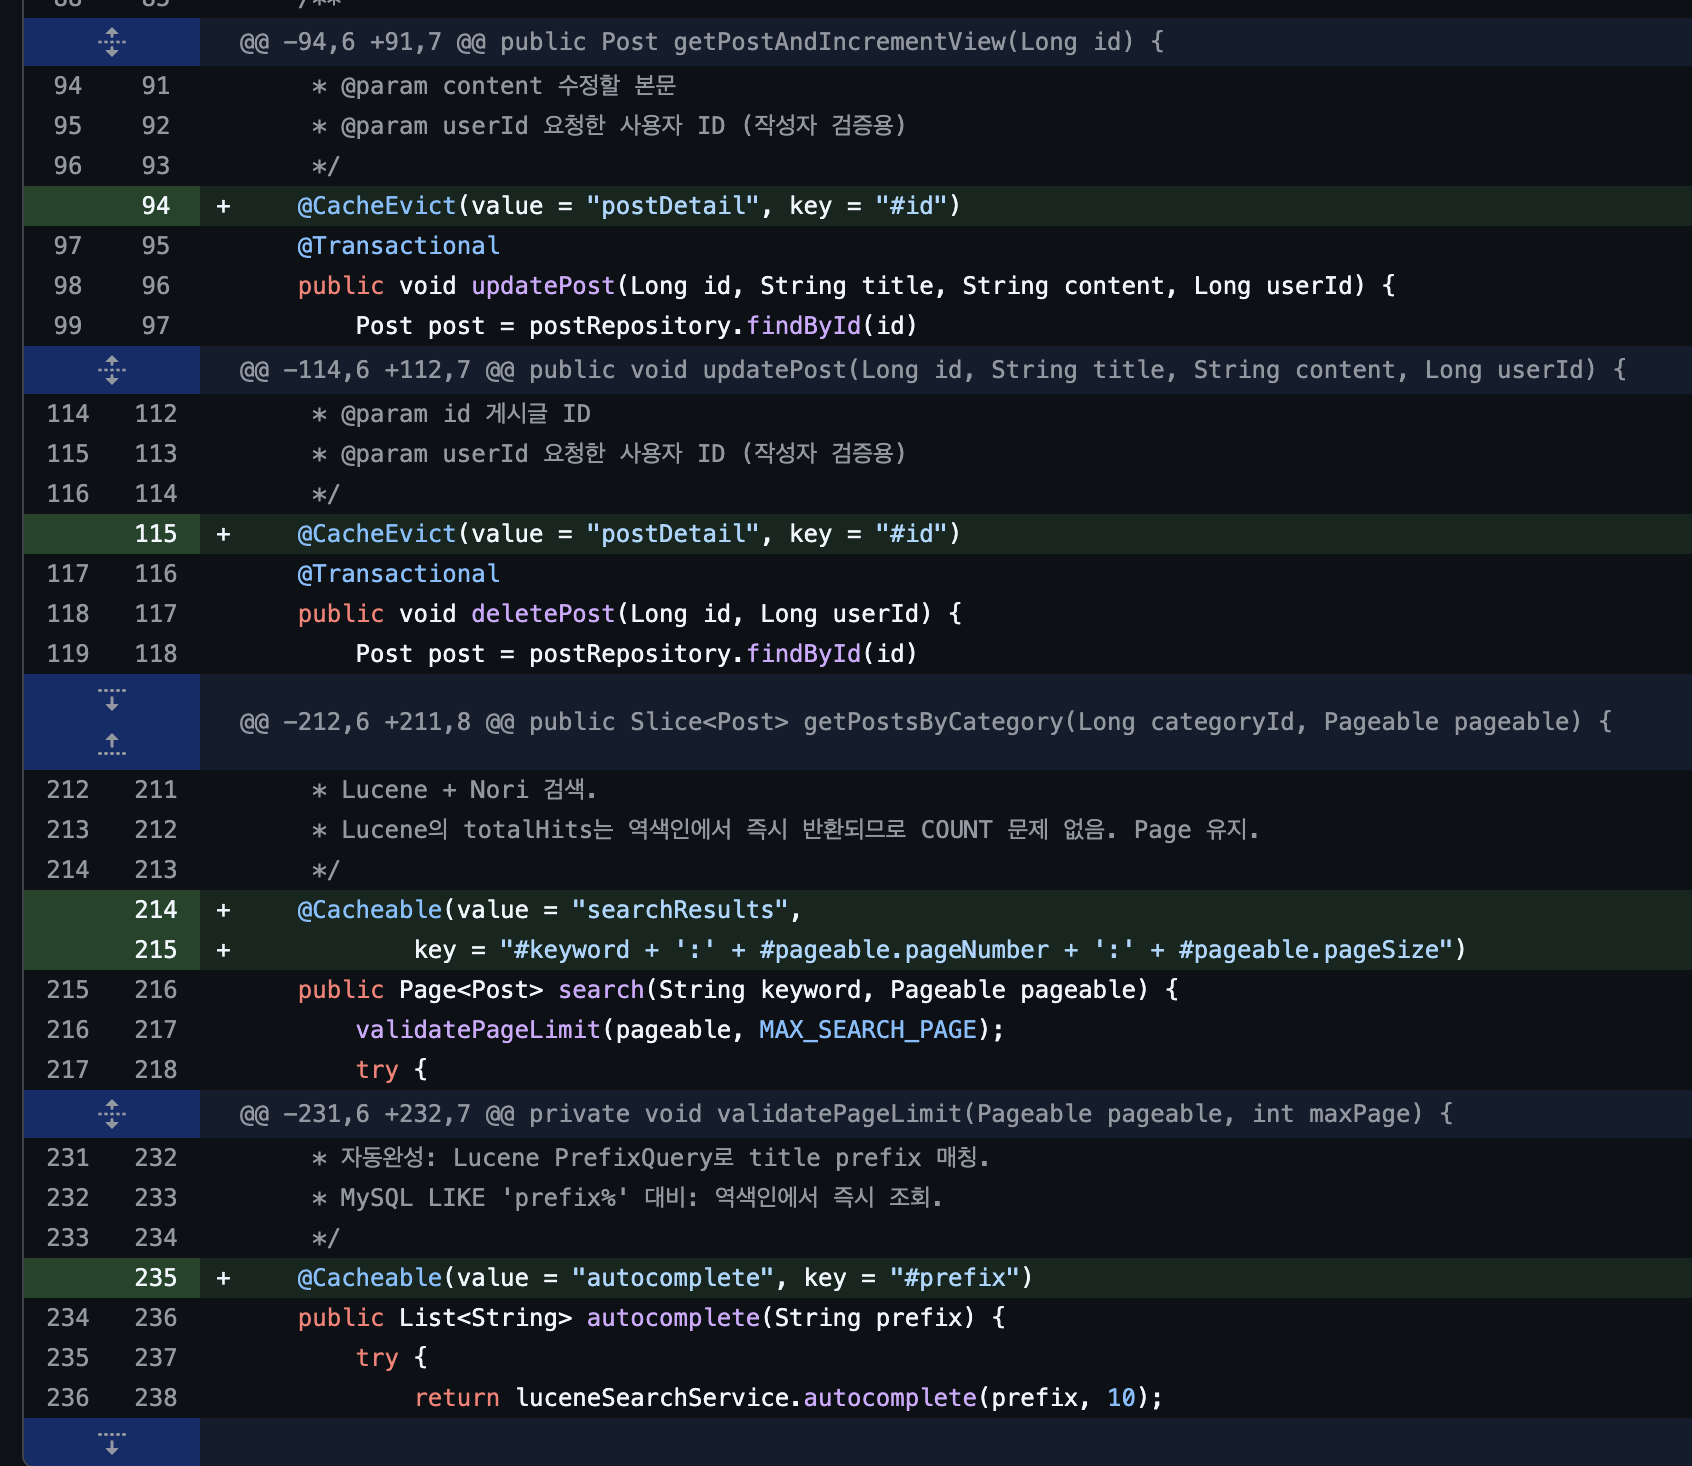
3. 캐시 무효화 (@CacheEvict)
무효화 전략
| 캐시 | 무효화 방식 | 이유 |
|---|---|---|
| searchResults | TTL 만료 (5분) | 검색어별 키가 너무 다양, 게시글 1건 수정으로 어떤 검색 결과에 영향이 있는지 특정 불가 |
| autocomplete | TTL 만료 (10분) | prefix별로 결과가 다양, 제목 변경 시 영향 범위 특정 어려움 |
| postDetail | 즉시 무효화 (@CacheEvict) | 게시글 ID로 정확히 특정 가능, 수정/삭제 후 이전 데이터 노출은 사용자 경험에 직접 영향 |
구현
// 게시글 수정 시 해당 캐시 즉시 제거@CacheEvict(value = "postDetail", key = "#id")@Transactionalpublic void updatePost(Long id, String title, String content, Long userId) { Post post = postRepository.findById(id) .orElseThrow(() -> new BusinessException(ErrorCode.POST_NOT_FOUND)); if (!post.getAuthorId().equals(userId)) { throw new BusinessException(ErrorCode.ACCESS_DENIED); } post.update(title, content); indexSafely(post);}
// 게시글 삭제 시 해당 캐시 즉시 제거@CacheEvict(value = "postDetail", key = "#id")@Transactionalpublic void deletePost(Long id, Long userId) { // ... 기존 로직}캐시 일관성과 허용 가능한 지연
- 검색 결과: 게시글 수정 후 최대 5분간 이전 검색 결과가 반환될 수 있습니다. 커뮤니티 서비스에서 허용 가능한 수준입니다 (Google 검색도 크롤링 갱신에 시간이 걸립니다).
- 자동완성: 새 게시글이 추가되어도 최대 10분간 자동완성에 나타나지 않을 수 있습니다. prefix 기반이므로 영향이 제한적입니다.
- 게시글 상세:
@CacheEvict로 즉시 무효화. 수정/삭제 후 다음 요청에서 DB 최신 데이터를 반환합니다.
4. Cache Stampede 방지
문제
인기 검색어 “삼성전자”의 캐시가 TTL 만료되는 순간, 동시에 100개 요청이 모두 캐시 미스 → Lucene 검색 100회 + DB 조회 100회가 동시 발생합니다.
시간 T: "삼성전자" 캐시 만료 ↓동시 100개 요청 → 모두 캐시 미스 → Lucene 100회 + DB 100회 ↓JVM CPU 스파이크, DB 과부하방지 방법
| 방법 | 설명 | 적용 시점 |
|---|---|---|
| TTL 랜덤화 | 기본 TTL에 +/- 10% 편차 추가 | 즉시 |
| Probabilistic Early Expiration | TTL 만료 전에 일정 확률로 미리 갱신 | 채널톡 사례 |
| Mutex Lock | 캐시 미스 시 하나의 스레드만 DB 조회, 나머지는 대기 | 고트래픽 |
refreshAfterWrite | Caffeine 내장: TTL 만료 전 비동기 갱신 | 부하 테스트 후 |
Caffeine의 내장 해결: refreshAfterWrite
Caffeine은 refreshAfterWrite를 설정하면 TTL 만료 전에 비동기로 캐시를 갱신합니다.
갱신 중에도 이전 값을 반환하므로 Stampede가 발생하지 않습니다.
// refreshAfterWrite: 3분 후 백그라운드 갱신 시작// expireAfterWrite: 5분 후 강제 만료 (안전장치)manager.registerCustomCache("searchResults", Caffeine.newBuilder() .maximumSize(10_000) .refreshAfterWrite(Duration.ofMinutes(3)) // 3분 후 비동기 갱신 .expireAfterWrite(Duration.ofMinutes(5)) // 5분 후 강제 만료 .recordStats() .buildAsync(key -> loadFromLucene(key)) // 비동기 로더 .synchronous());단, @Cacheable + CaffeineCacheManager 조합에서는 buildAsync 대신
CacheLoader를 별도 등록해야 합니다. 복잡도가 올라가므로:
실용적 선택: 단일 서버 환경에서는 Stampede 영향이 제한적입니다.
expireAfterWrite TTL만 설정하고, 부하 테스트에서 실제 문제가 관측되면 그때 refreshAfterWrite를 추가합니다.
5. 브라우저 캐싱 (Cache-Control)
서버 캐시(Caffeine) 외에 브라우저 캐싱도 적용하여 네트워크 요청 자체를 줄입니다.
CDN이 없는 단일 서버 환경에서도 브라우저가 캐시 역할을 합니다.
적용 대상
| API | Cache-Control | 이유 |
|---|---|---|
자동완성 (/posts/autocomplete) | max-age=300, stale-while-revalidate=60 | 제안어 목록이 분 단위로 변하지 않음. 5분 캐싱 적절 |
검색 (/posts/search) | max-age=60 | 검색 결과는 비교적 자주 변할 수 있으므로 짧은 캐싱 |
게시글 상세 (/posts/{id}) | max-age=300 | 자주 수정되지 않는 게시글은 5분 캐싱 |
게시글 목록 (/posts) | no-cache 또는 미설정 | 최신 게시글 목록은 실시간성이 중요 |
구현
// PostController: 자동완성 — 5분 브라우저 캐싱@GetMapping("/autocomplete")public ResponseEntity<List<String>> autocomplete(@RequestParam String prefix) { List<String> suggestions = postService.autocomplete(prefix); return ResponseEntity.ok() .cacheControl(CacheControl.maxAge(Duration.ofMinutes(5)) .staleWhileRevalidate(Duration.ofSeconds(60))) .body(suggestions);}stale-while-revalidate 동작

6. 캐시 모니터링 (Actuator)
캐시를 도입하고 나면 “실제로 효과가 있는가”를 지속 측정해야 합니다.
히트율이 80% 미만이면 TTL, 키 설계, 최대 크기를 재검토합니다.
모니터링 지표
| 지표 | 목표 | 의미 |
|---|---|---|
| 캐시 히트율 | >= 80% | 80% 미만이면 TTL 또는 키 설계 재검토 |
| 캐시 메모리 사용량 | JVM 힙의 10-20% | 초과 시 maximumSize 조정 |
| 축출(eviction) 횟수 | 낮을수록 좋음 | 높으면 maximumSize 부족 |
| Lucene 검색 TPS | 캐싱 전 대비 50%+ 감소 | 감소하지 않으면 캐시 미동작 |
Caffeine recordStats + Actuator 노출
// CacheConfig에서 이미 recordStats() 설정Caffeine.newBuilder() .maximumSize(10_000) .expireAfterWrite(Duration.ofMinutes(5)) .recordStats() // 히트율 등 통계 수집 .build()Spring Actuator 엔드포인트:
/actuator/caches: 등록된 캐시 목록/actuator/metrics/cache.gets: 캐시 히트/미스 횟수/actuator/metrics/cache.evictions: 축출 횟수/actuator/metrics/cache.size: 현재 캐시 엔트리 수
Grafana 대시보드 연동
기존 Prometheus + Grafana 모니터링에 캐시 메트릭을 추가:
management: metrics: tags: application: wikiengine endpoints: web: exposure: include: caches, metrics, health, prometheusGrafana에서 cache_gets_total{result="hit"} / cache_gets_total 비율을 대시보드에 추가하면
실시간 히트율을 모니터링할 수 있습니다.
부하 테스트 및 결과
측정 원칙
- Before/After 동일 조건: 같은 k6 프로필(load), 같은 VU(100), 같은 duration(20분)
- k6 InfluxDB 출력:
--out influxdb=http://localhost:8086/k6(Grafana k6 대시보드 연동) - Grafana 시간 범위 통일: 대시보드 캡처 시 동일 시간 범위로 맞추기
Before (캐시 없음 baseline)
측정일시: 2026-03-14 16:20~16:45 KST
테스트 환경: ARM 2코어 / 12GB RAM — Spring Boot JVM 1GB + MySQL InnoDB BP 2GB
k6 프로필: load (100 VU, 20분)
k6 콘솔 결과
k6 run --out influxdb=http://localhost:8086/k6 \ -e PROFILE=load -e BASE_URL=https://api.studywithtymee.com \ /home/rocky/k6/baseline-load-test.js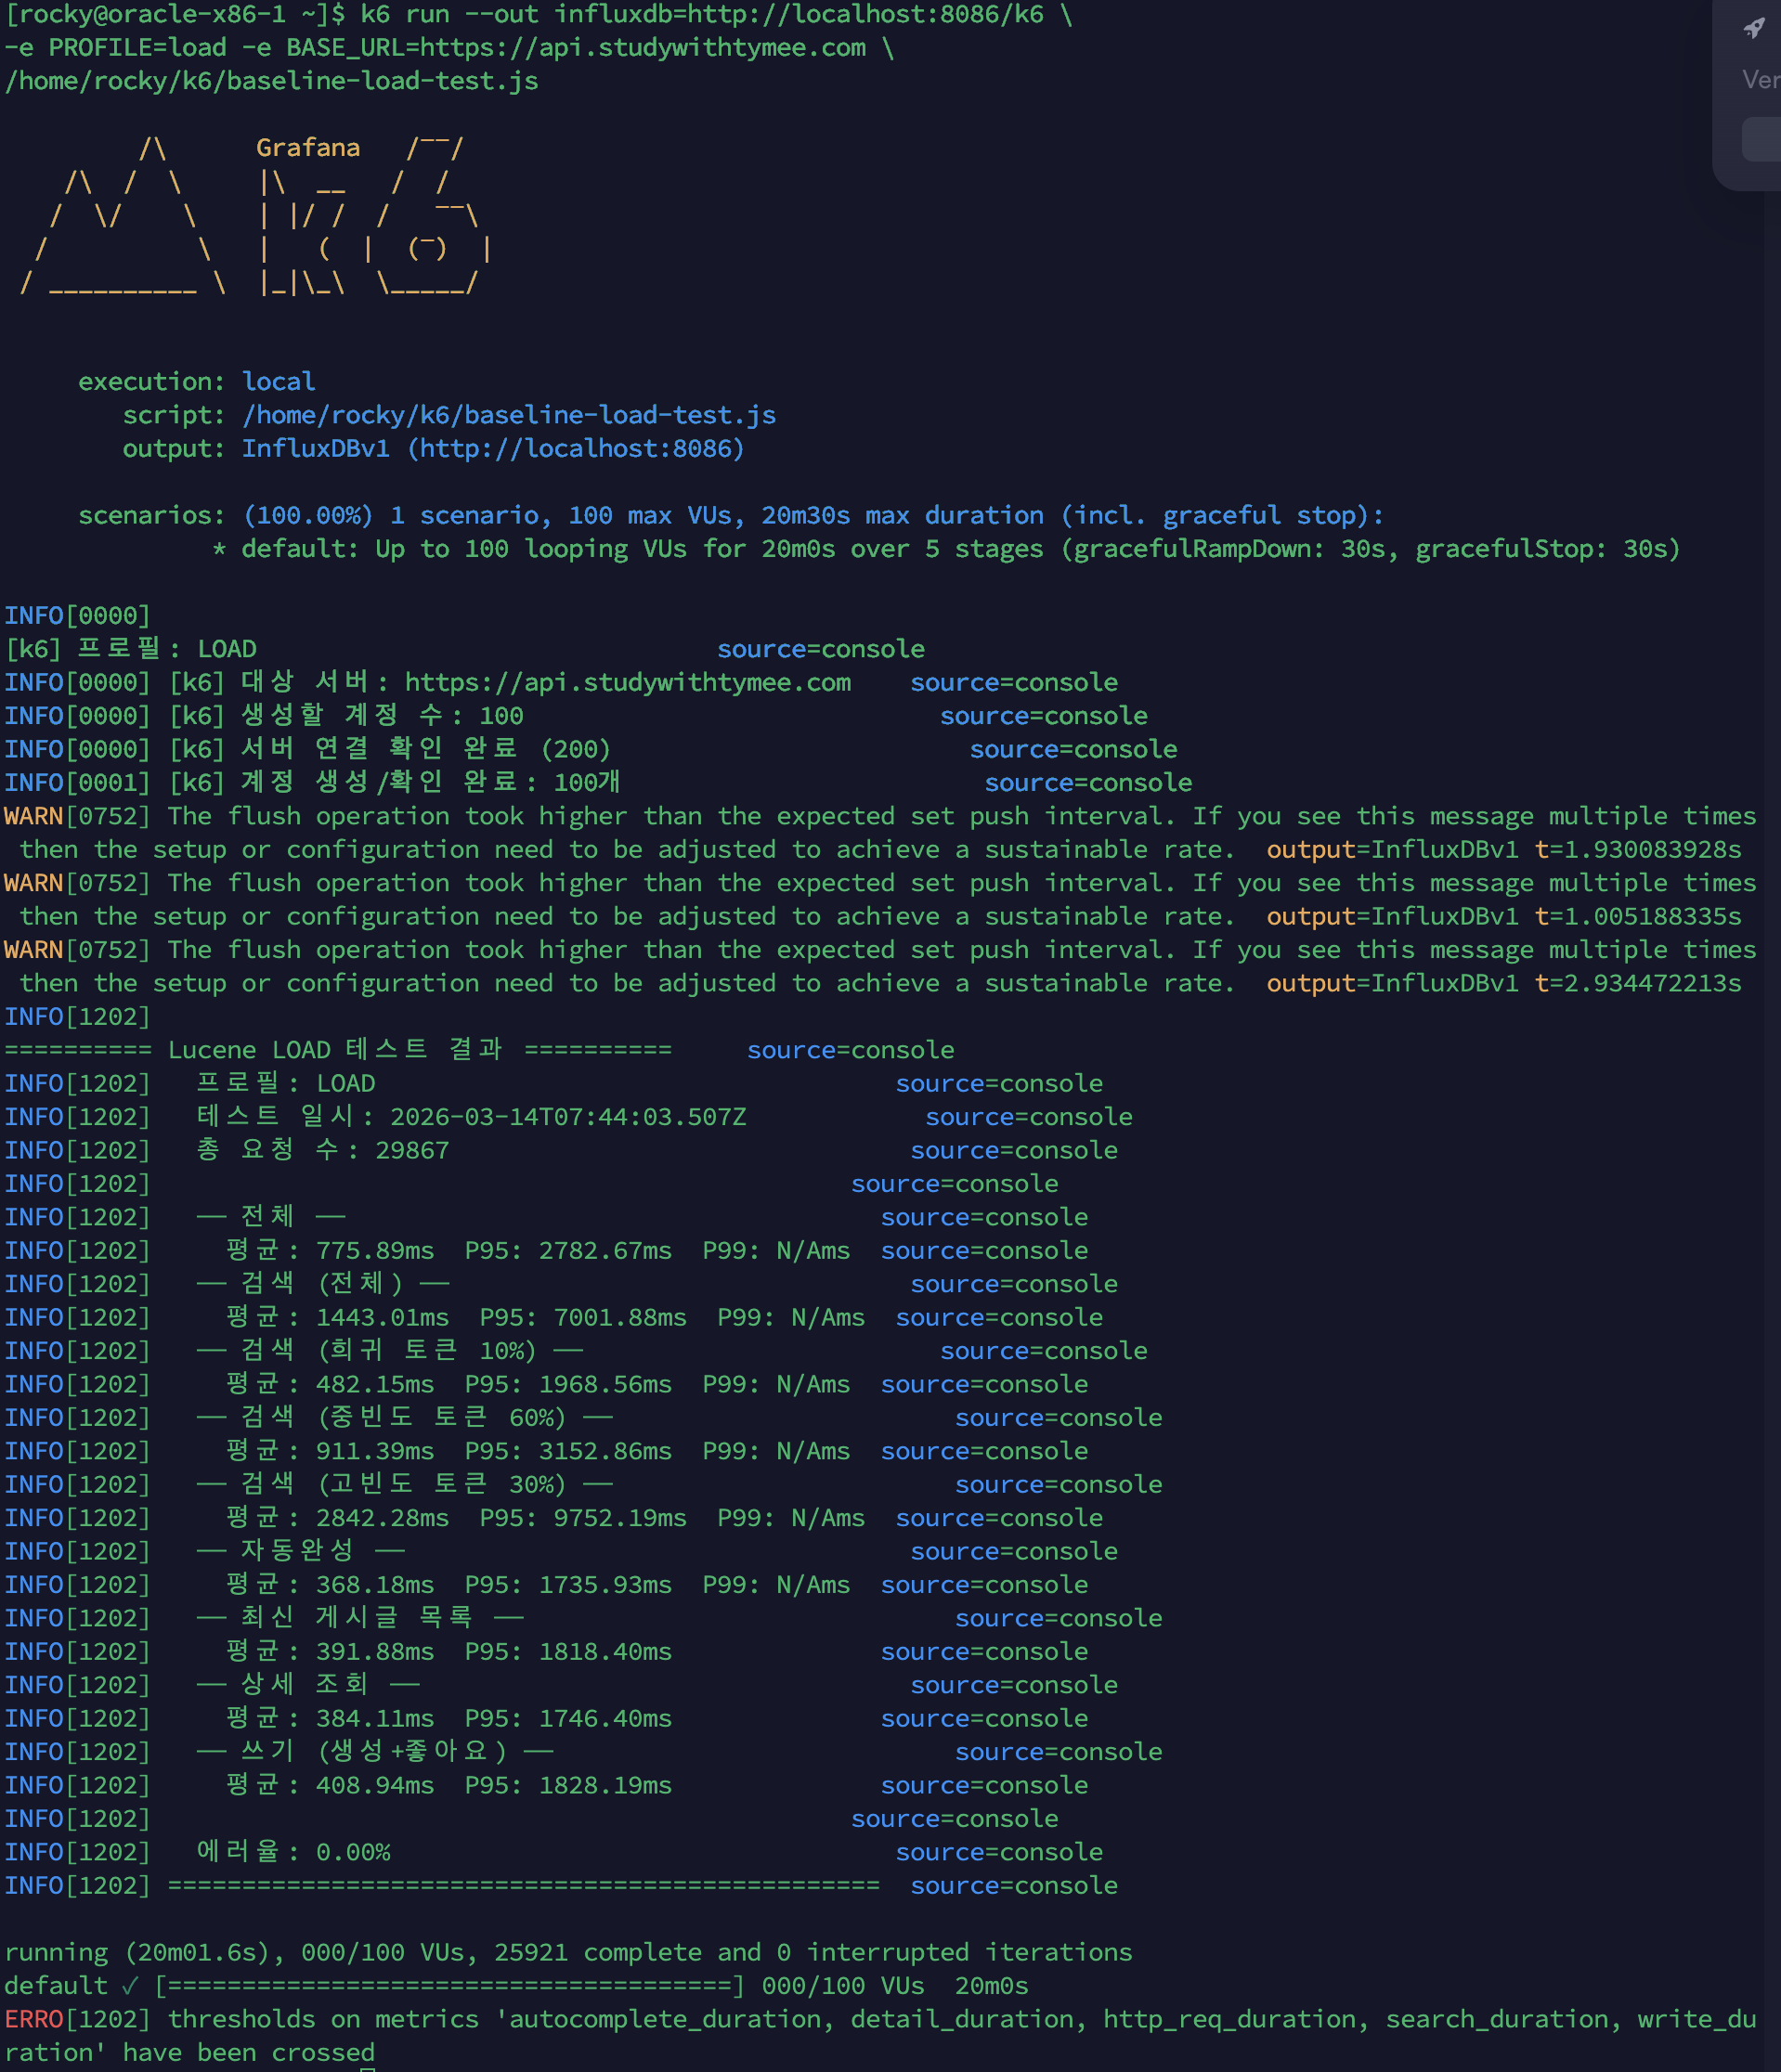
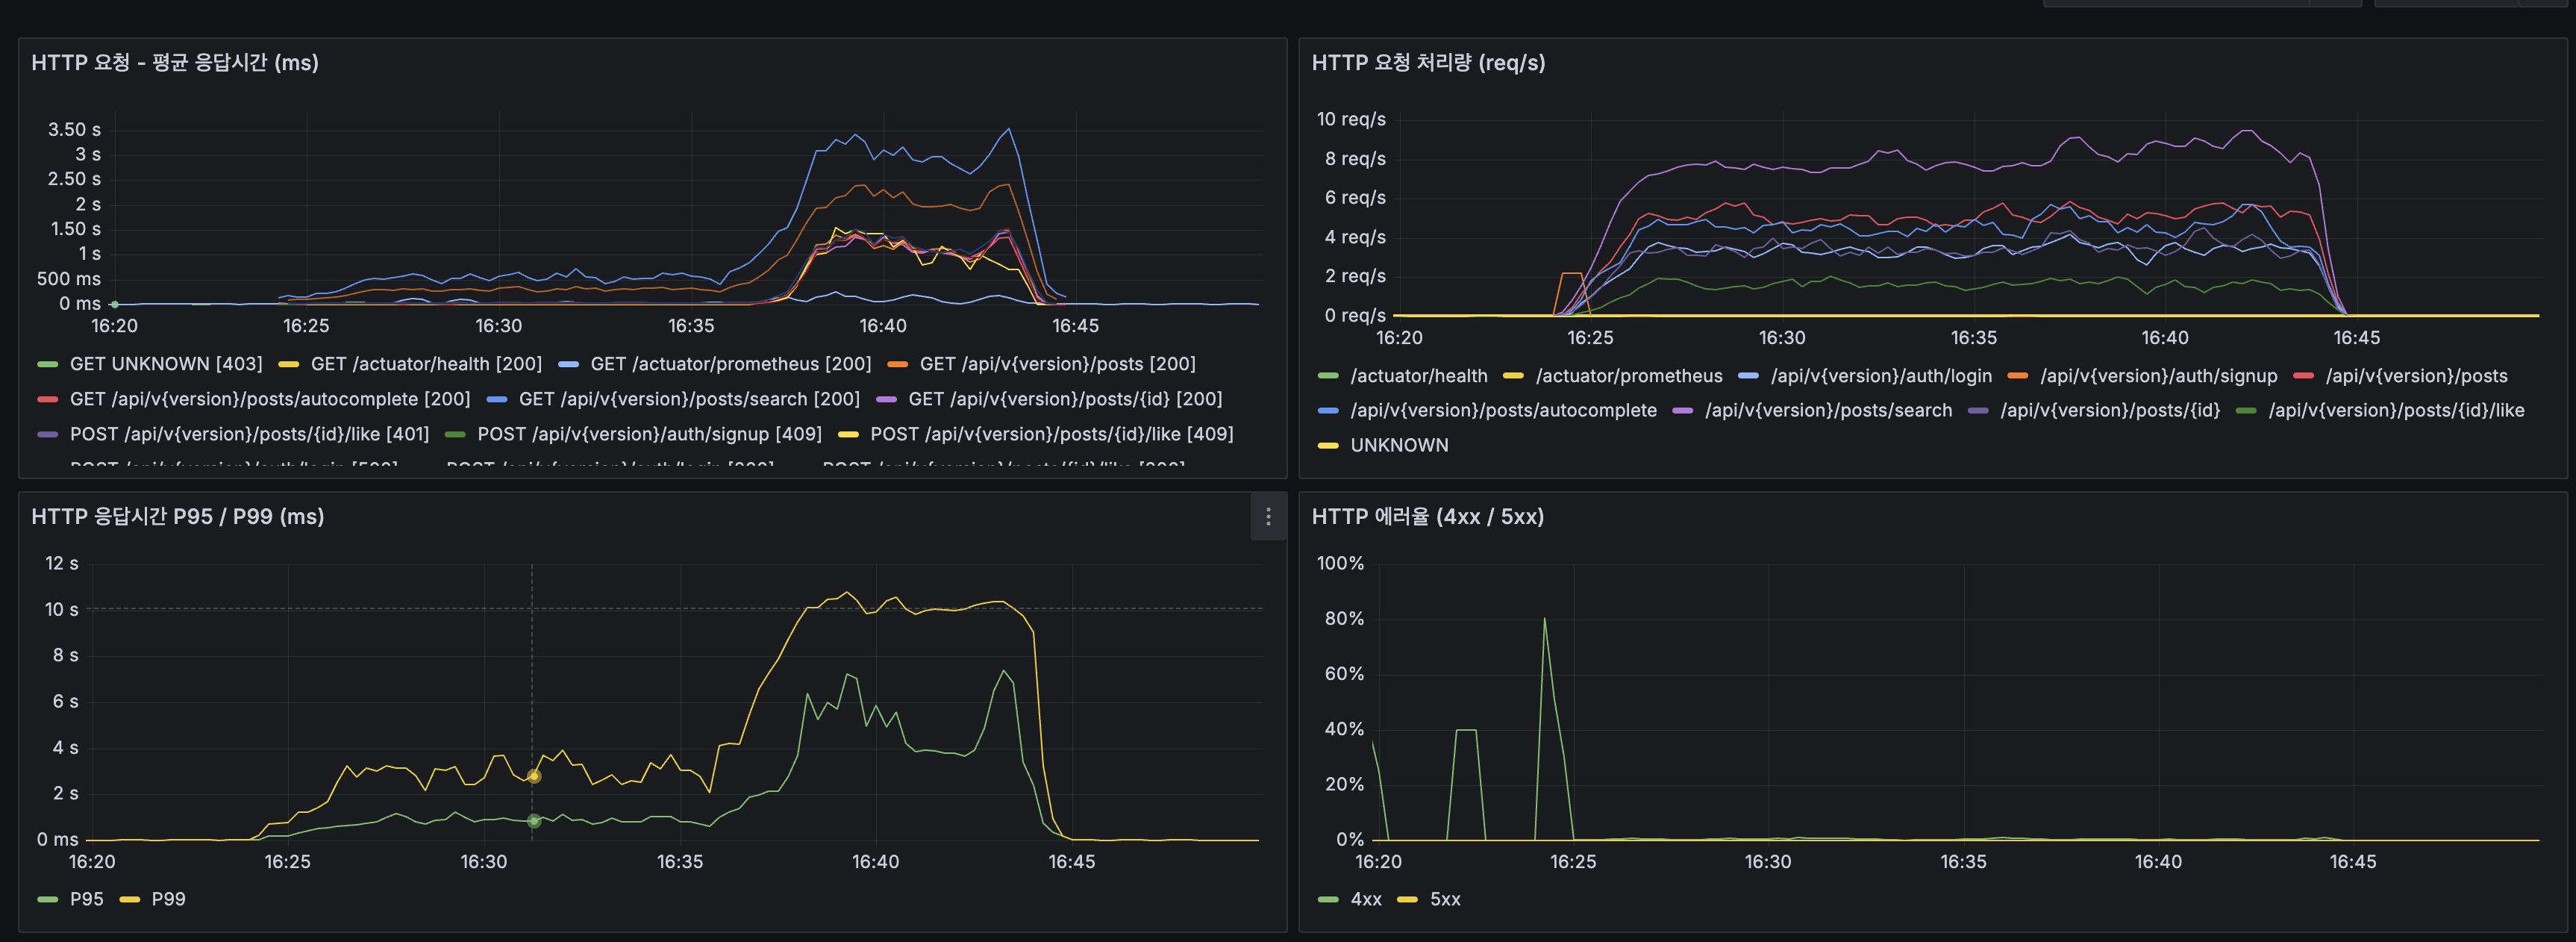
| 시나리오 | 평균 | P95 |
|---|---|---|
| 전체 | 775.89ms | 2,782.67ms |
| 검색 (전체) | 1,443.01ms | 7,001.88ms |
| 검색 (희귀 토큰 10%) | 482.15ms | 1,968.56ms |
| 검색 (중빈도 토큰 60%) | 911.39ms | 3,152.86ms |
| 검색 (고빈도 토큰 30%) | 2,842.28ms | 9,752.19ms |
| 자동완성 | 368.18ms | 1,735.93ms |
| 최신 게시글 목록 | 391.88ms | 1,818.40ms |
| 상세 조회 | 384.11ms | 1,746.40ms |
| 쓰기 (생성+좋아요) | 408.94ms | 1,828.19ms |
| 항목 | 값 |
|---|---|
| 총 요청 수 | 29,867건 |
| 에러율 | 0.00% |
k6 Grafana 대시보드
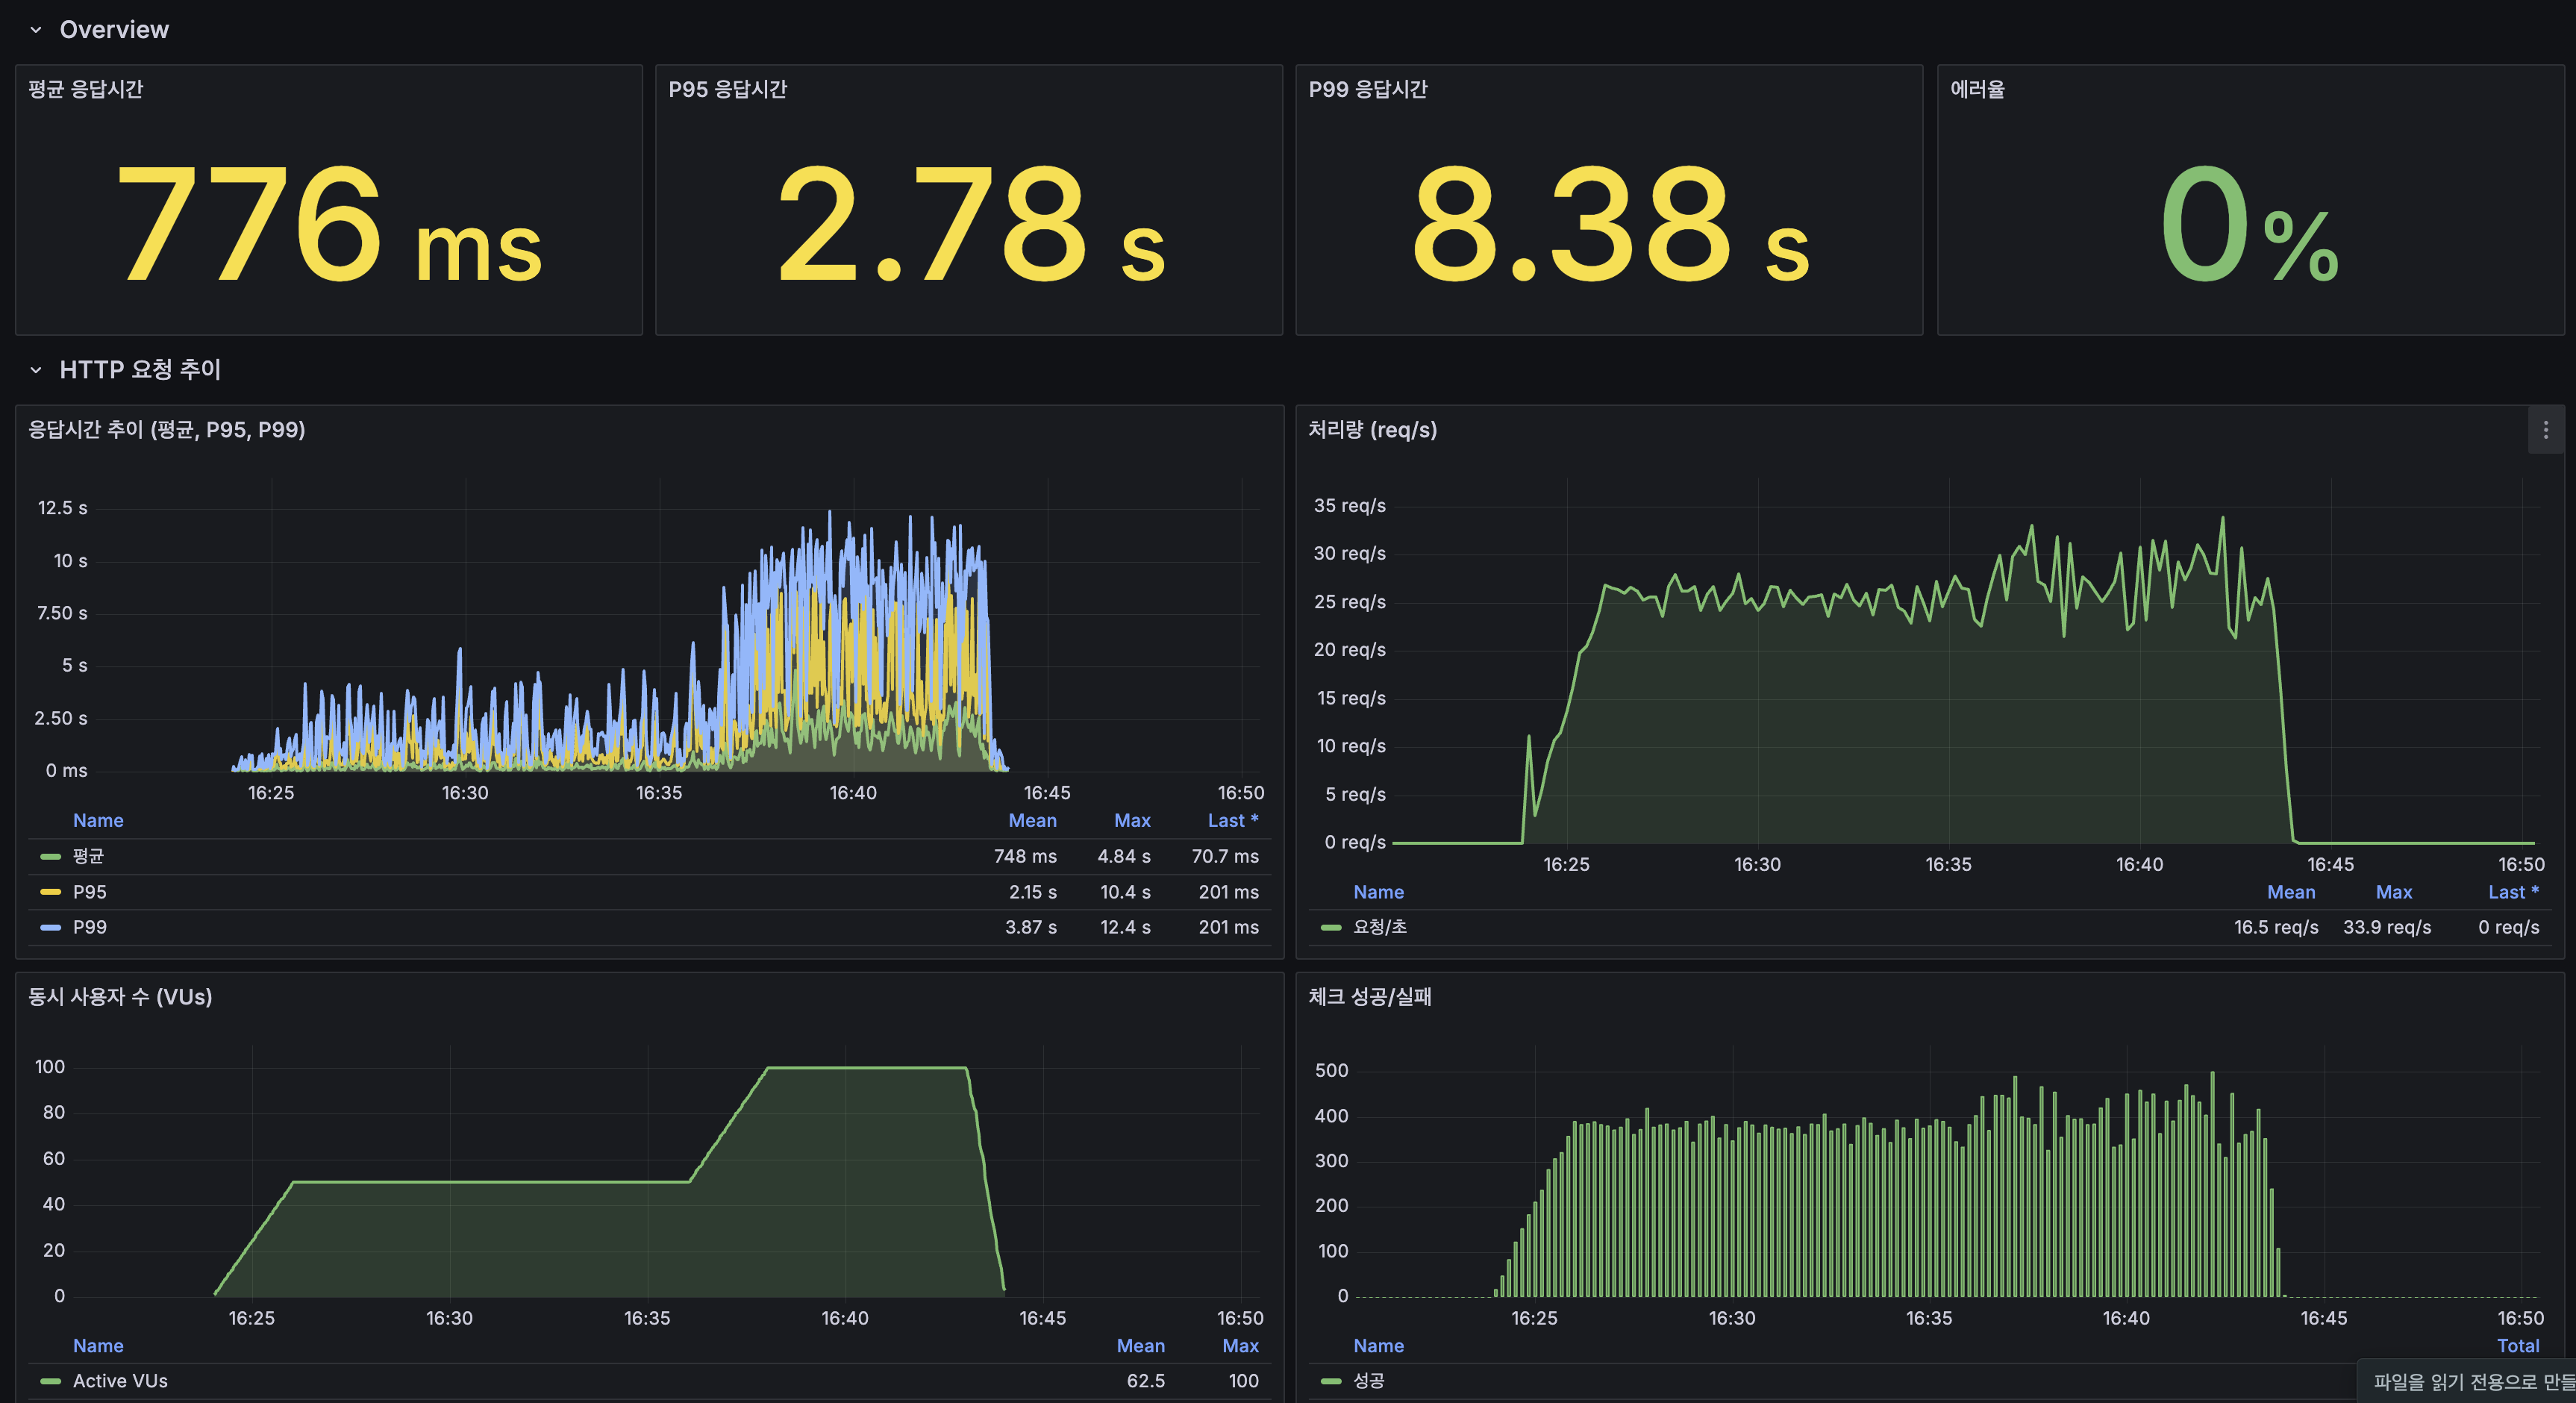
| 지표 | 값 |
|---|---|
| 평균 응답시간 | 776ms |
| P95 응답시간 | 2.78s |
| P99 응답시간 | 8.38s |
| 에러율 | 0% |
| 처리량 (평균 / 최대) | 16.5 req/s / 33.9 req/s |
| 동시 사용자 (평균 / 최대) | 62.5 / 100 VU |
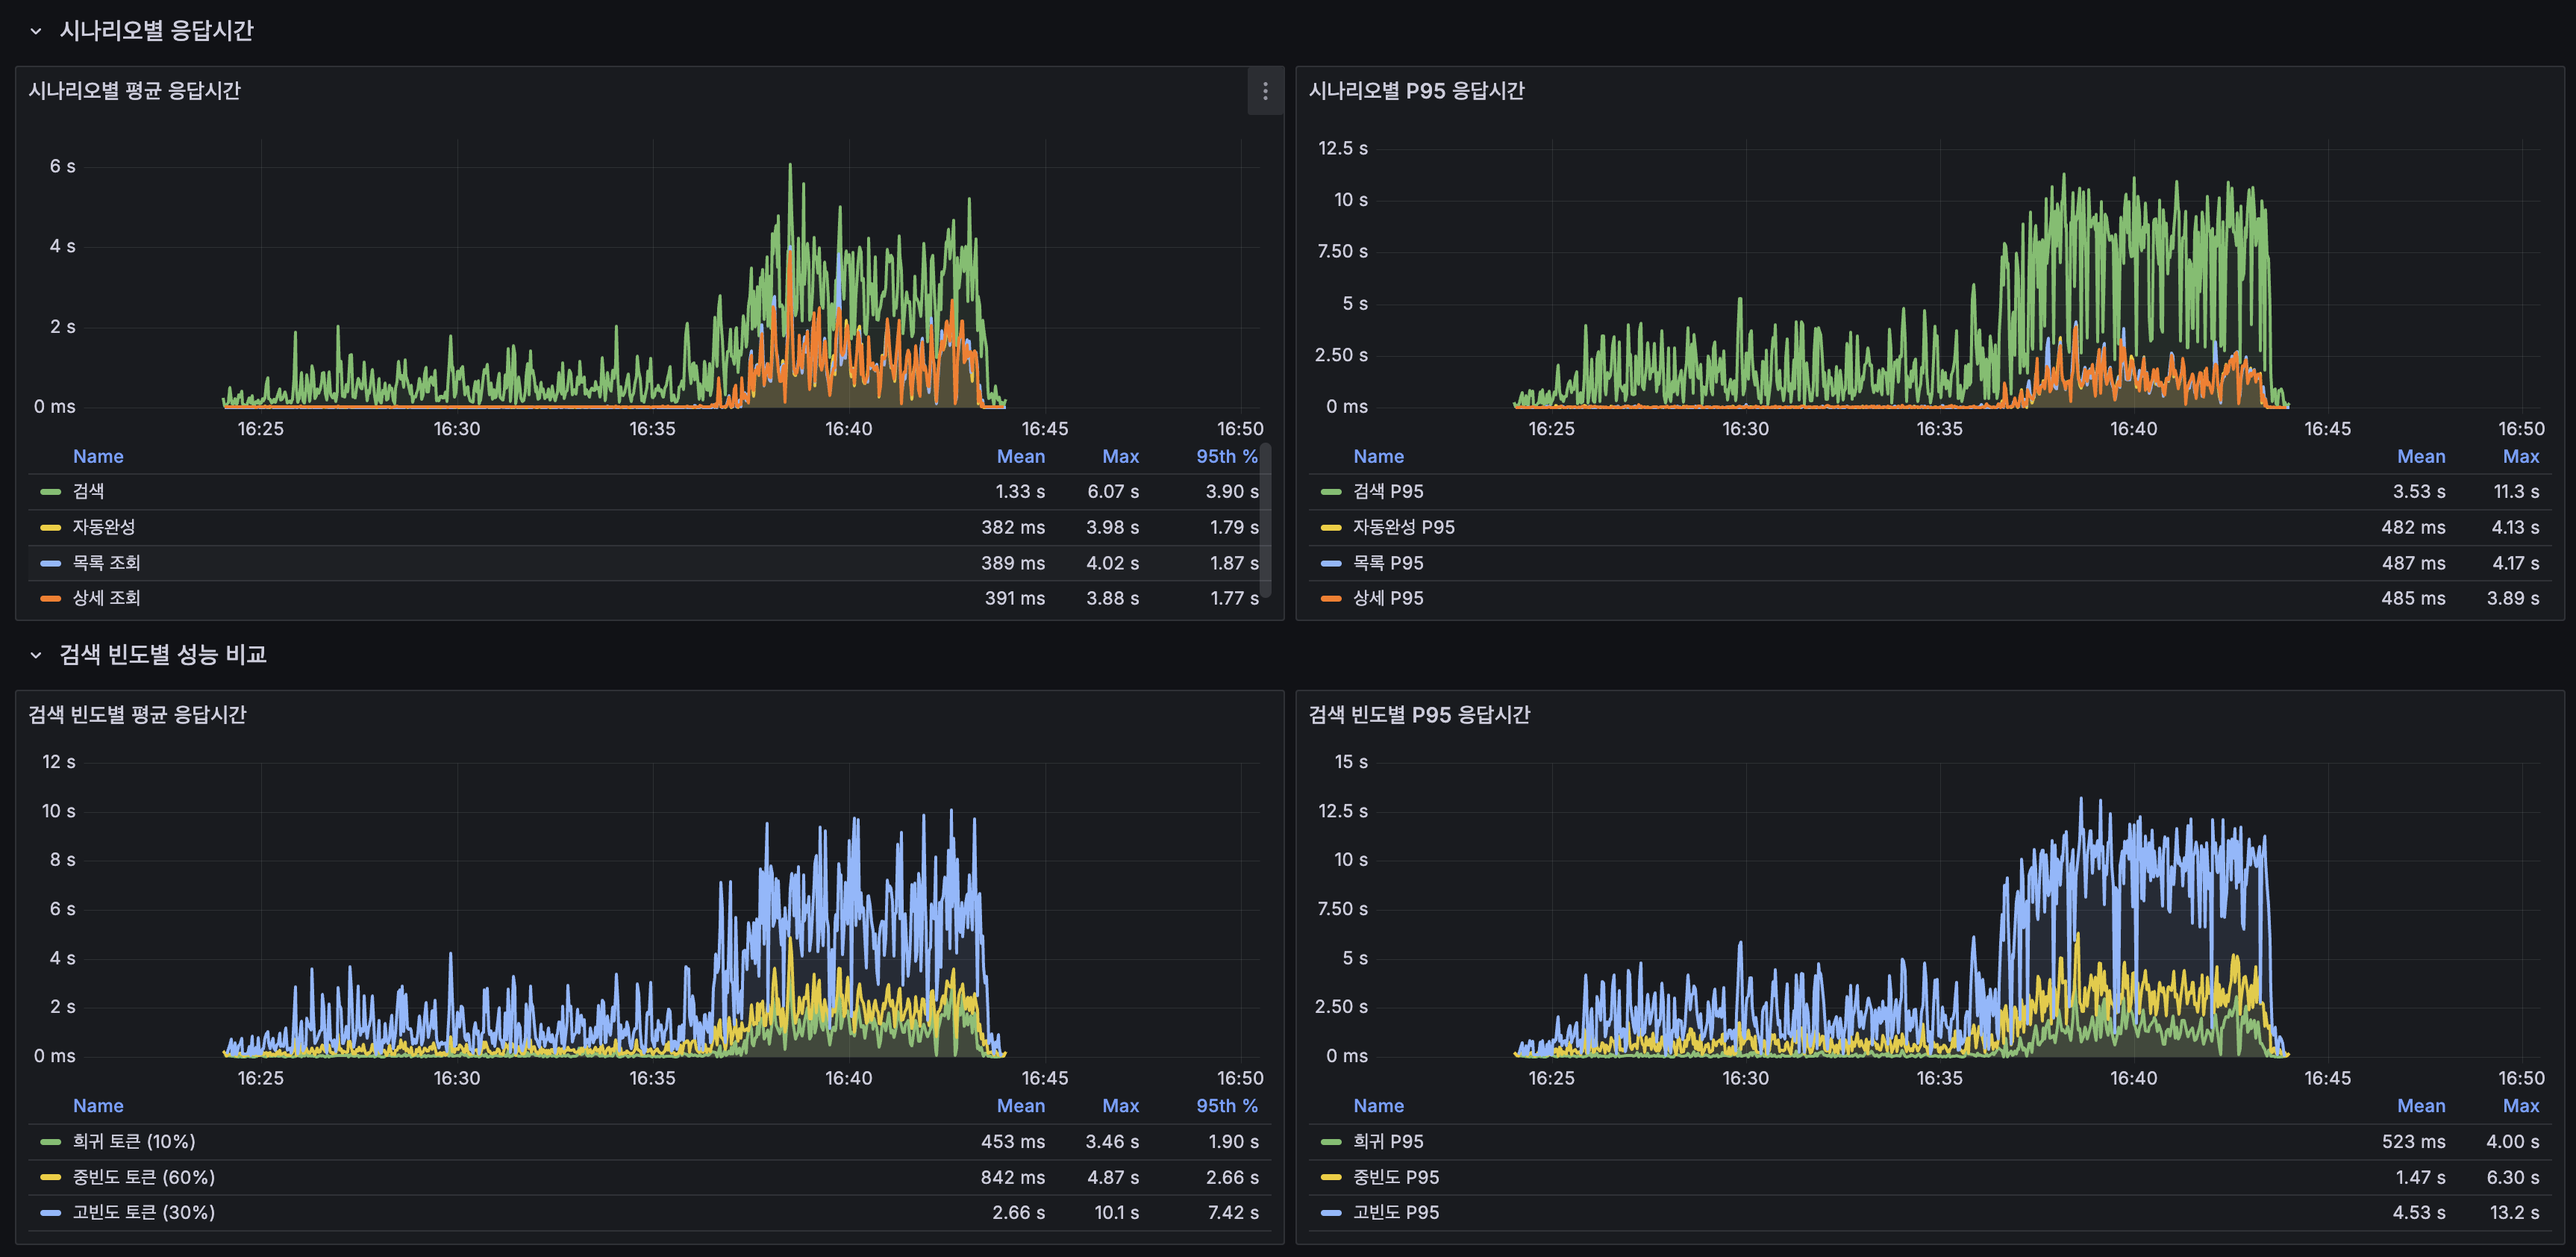
시나리오별 (Grafana):
| 시나리오 | Mean | Max | 95th |
|---|---|---|---|
| 검색 | 1.33s | 6.07s | 3.90s |
| 자동완성 | 382ms | 3.98s | 1.79s |
| 목록 조회 | 389ms | 4.02s | 1.87s |
| 상세 조회 | 391ms | 3.88s | 1.77s |
검색 빈도별 (Grafana):
| 빈도 | Mean | Max | 95th |
|---|---|---|---|
| 희귀 토큰 (10%) | 453ms | 3.46s | 1.90s |
| 중빈도 토큰 (60%) | 842ms | 4.87s | 2.66s |
| 고빈도 토큰 (30%) | 2.66s | 10.1s | 7.42s |
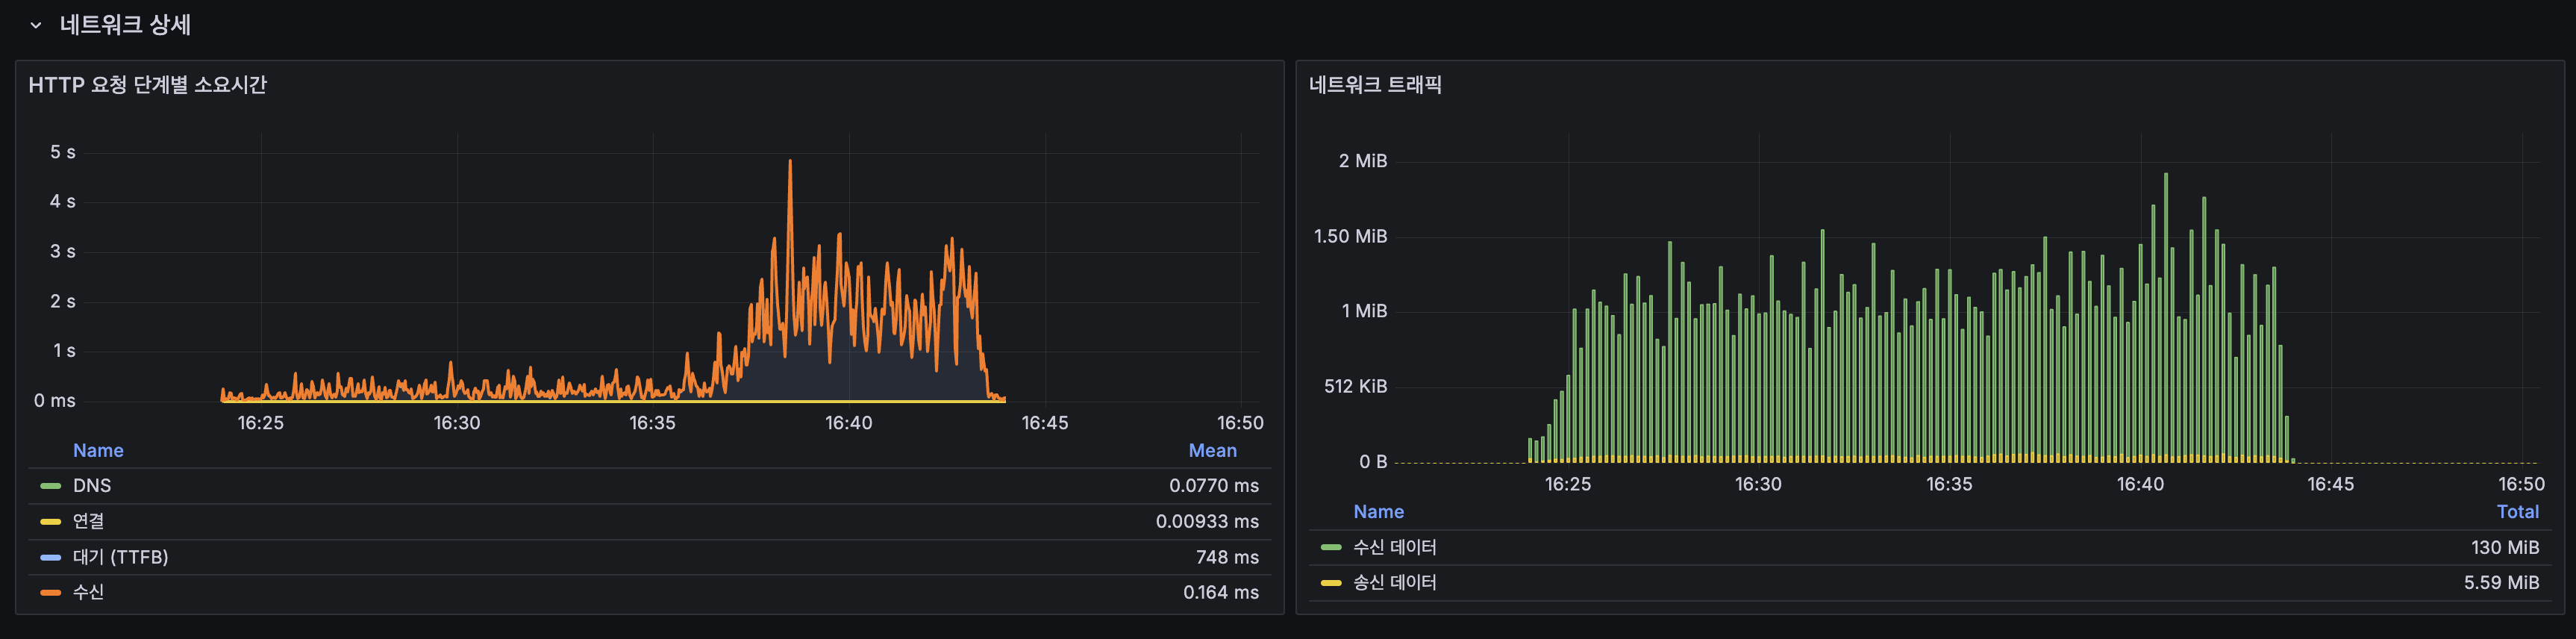
네트워크 상세:
| 단계 | Mean |
|---|---|
| DNS | 0.077ms |
| 연결 | 0.009ms |
| 대기 (TTFB) | 748ms |
| 수신 | 0.164ms |
| 네트워크 트래픽 | 수신 130 MiB / 송신 5.59 MiB |
서버 Grafana
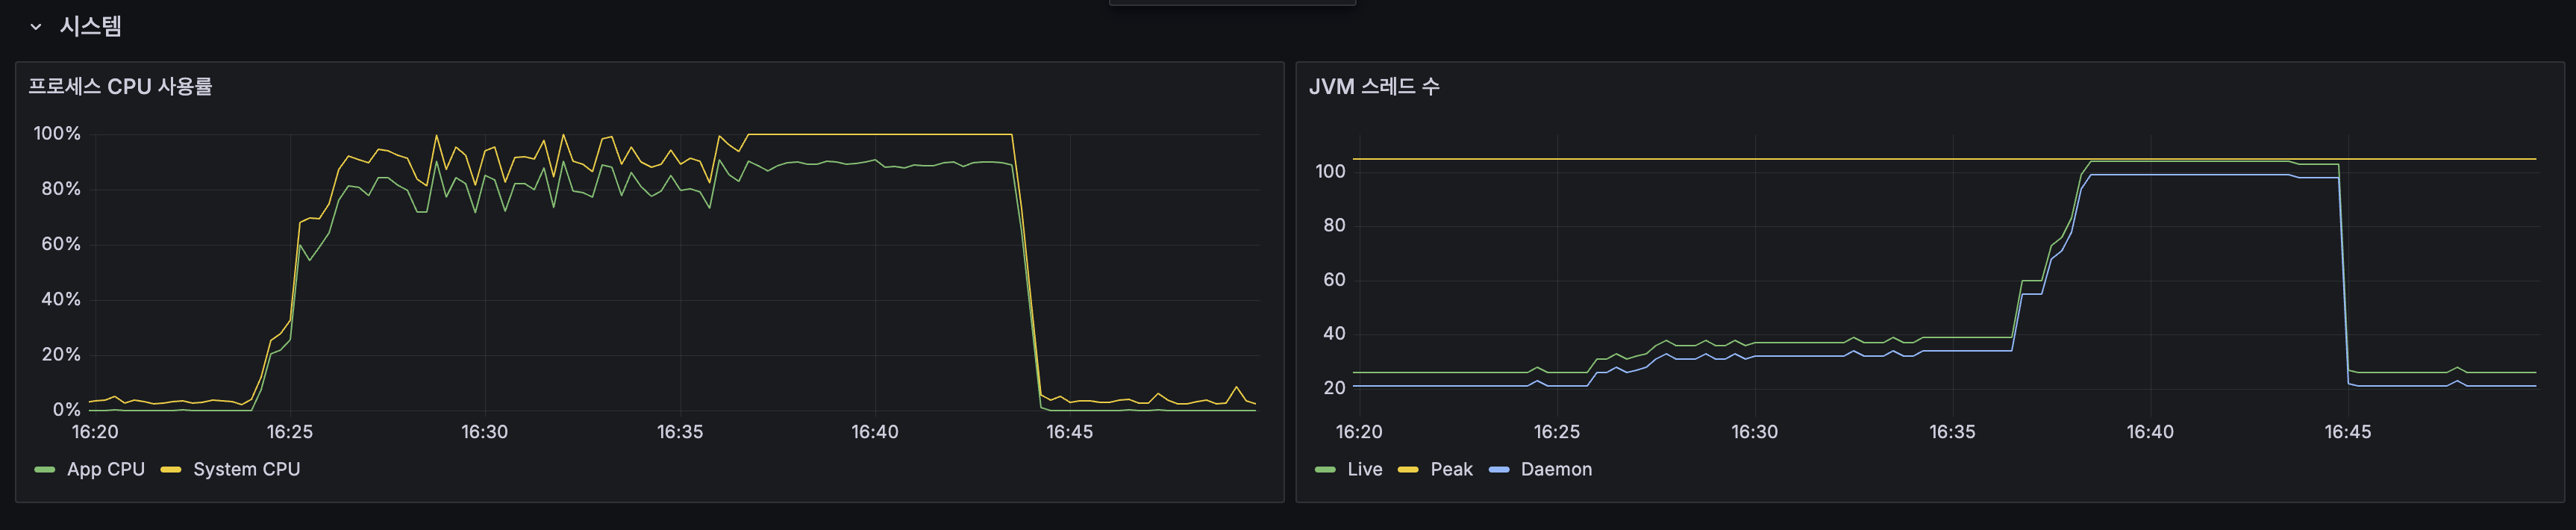
Spring Boot:
| 지표 | 값 |
|---|---|
| App CPU | 80~100% 포화 |
| JVM 스레드 | 20 -> 100+ 폭증 |
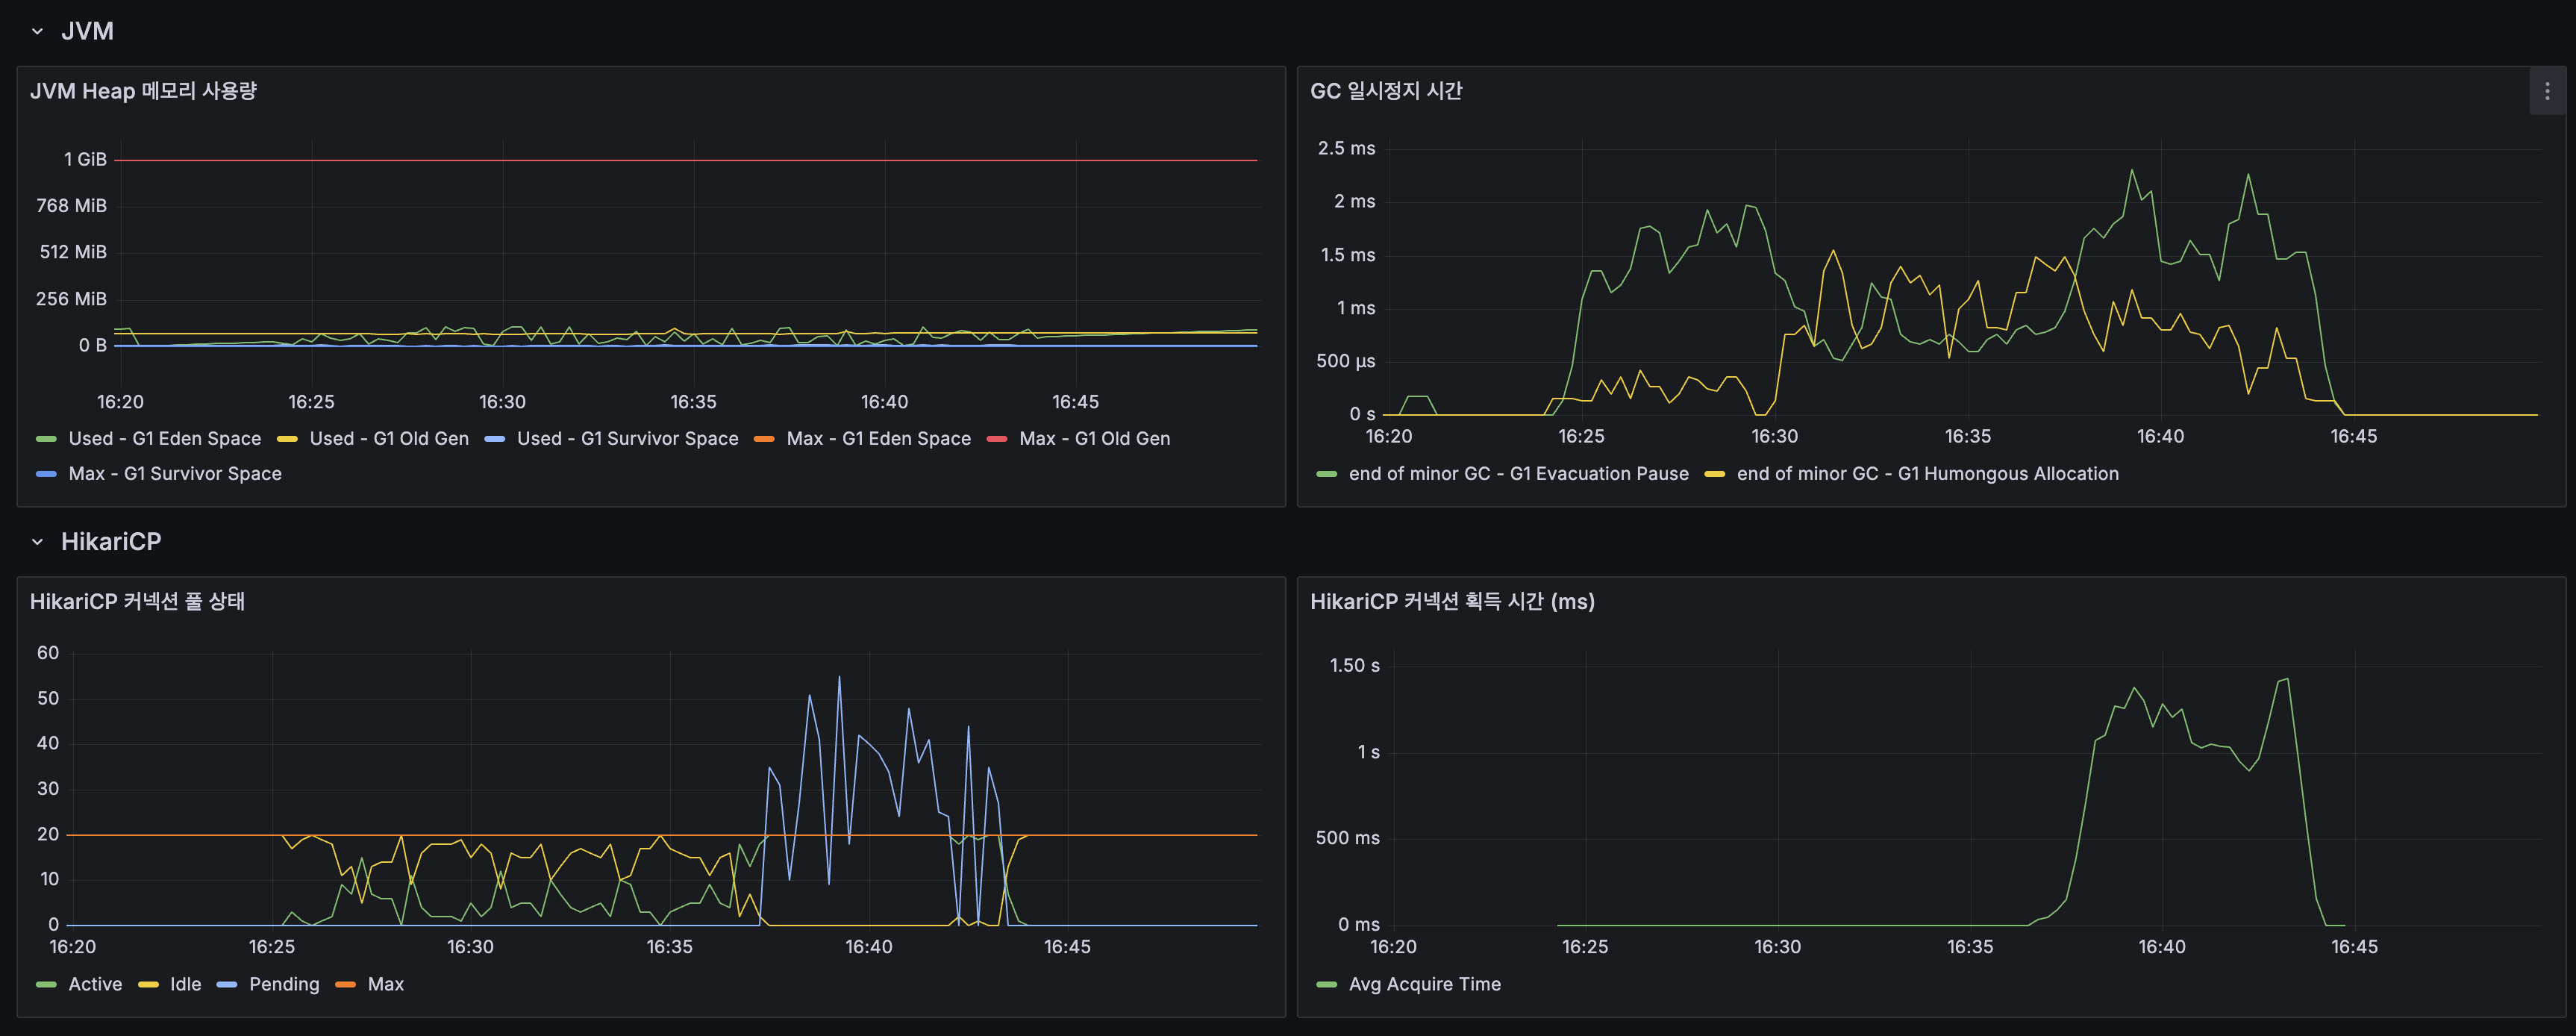
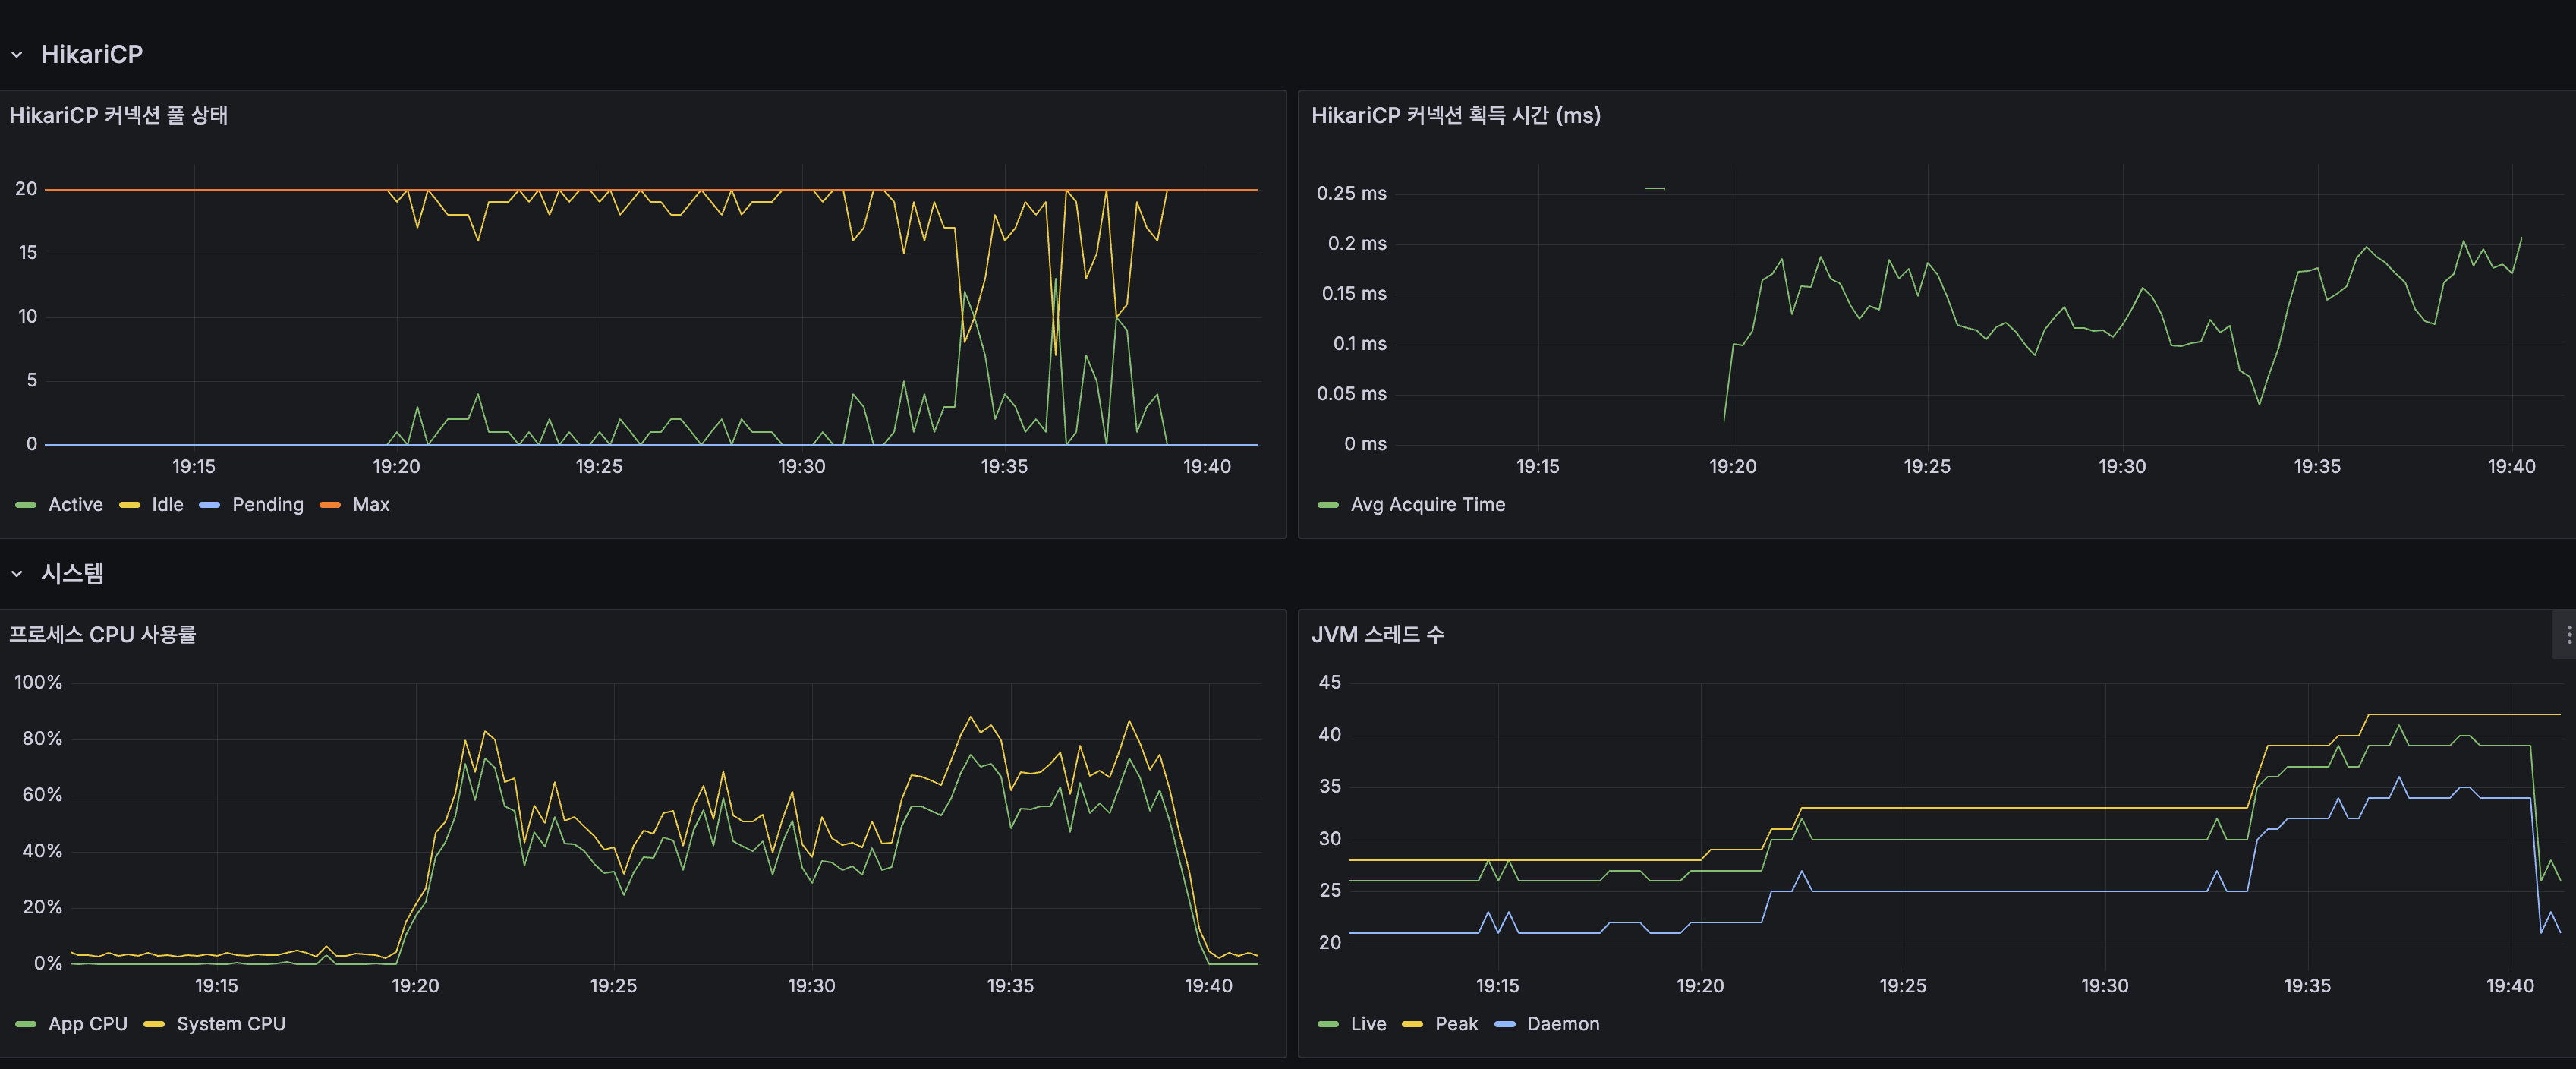
| JVM Heap | Max 1 GiB, 사용량 안정 |
| GC Pause | 1~2.5ms |
| HikariCP Pending | 최대 ~50 |
| HikariCP 획득 시간 | 최대 ~1.5s |
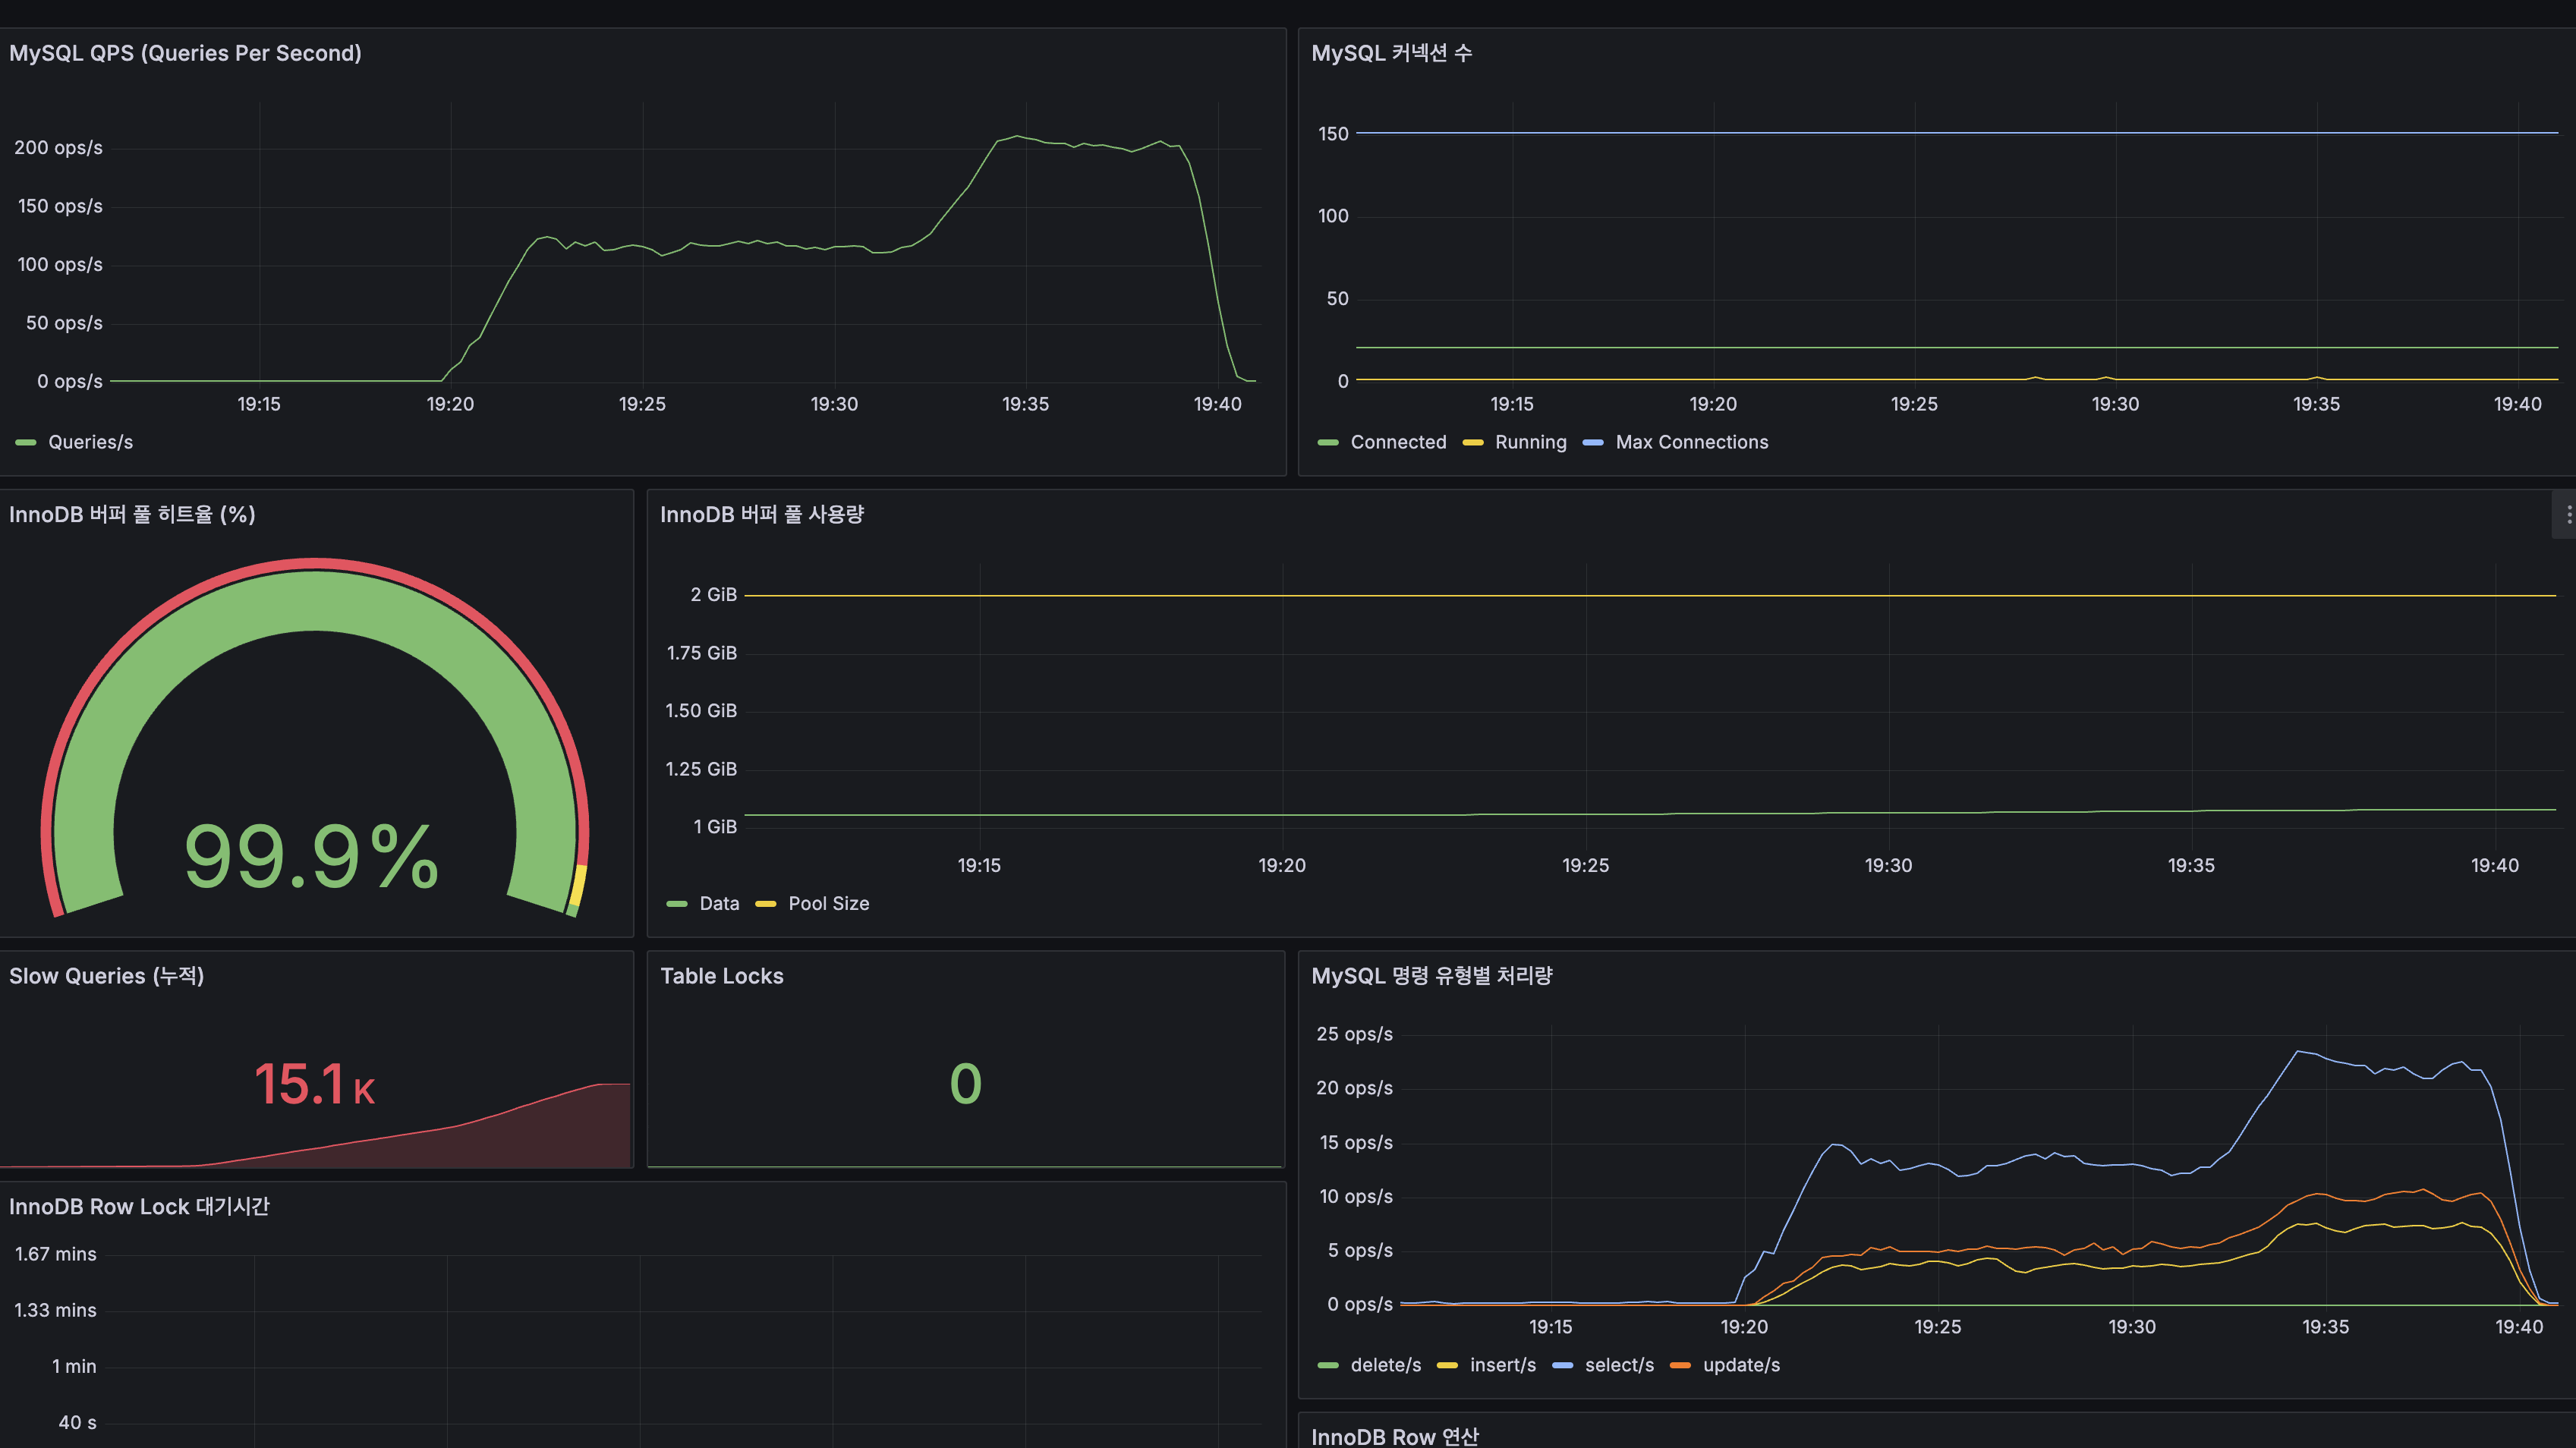
MySQL:
| 지표 | 값 |
|---|---|
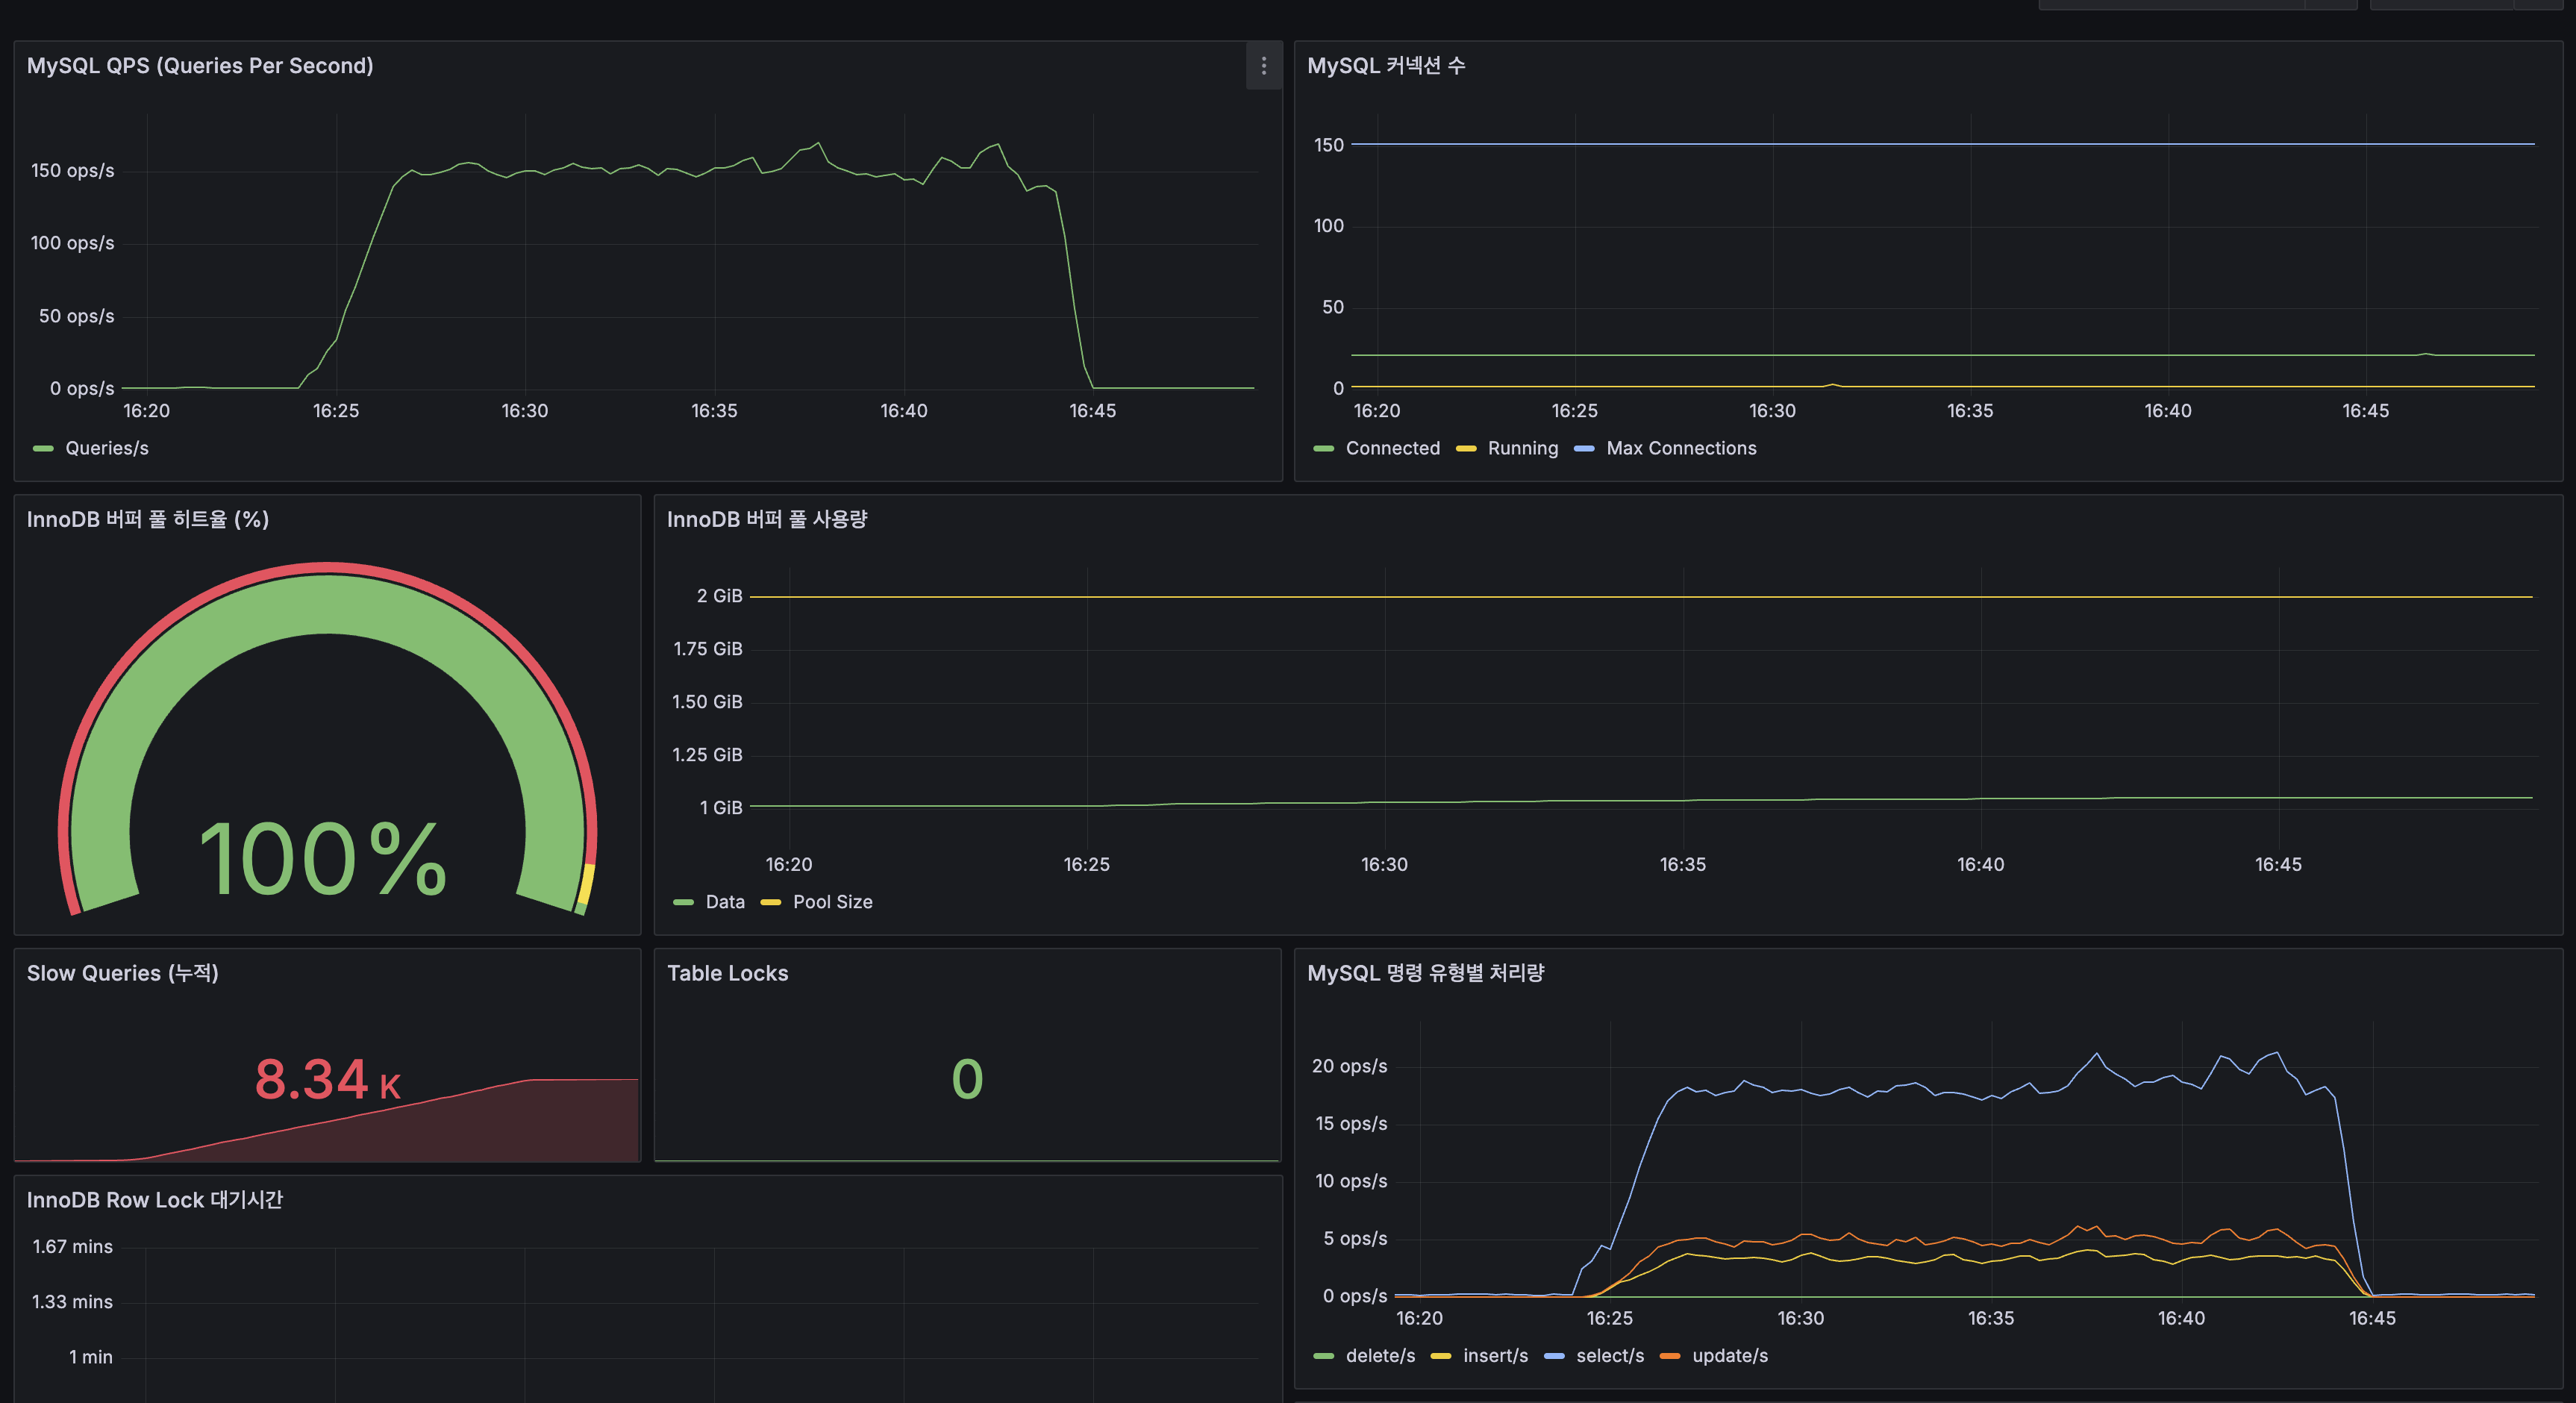
| QPS | 피크 ~150 ops/s |
| 커넥션 수 | ~30 Connected |
| InnoDB Buffer Pool 히트율 | 100% |
| InnoDB Buffer Pool 사용량 | ~1 GiB |
| Slow Queries (누적) | 8.34K |
| Table Locks | 0 |
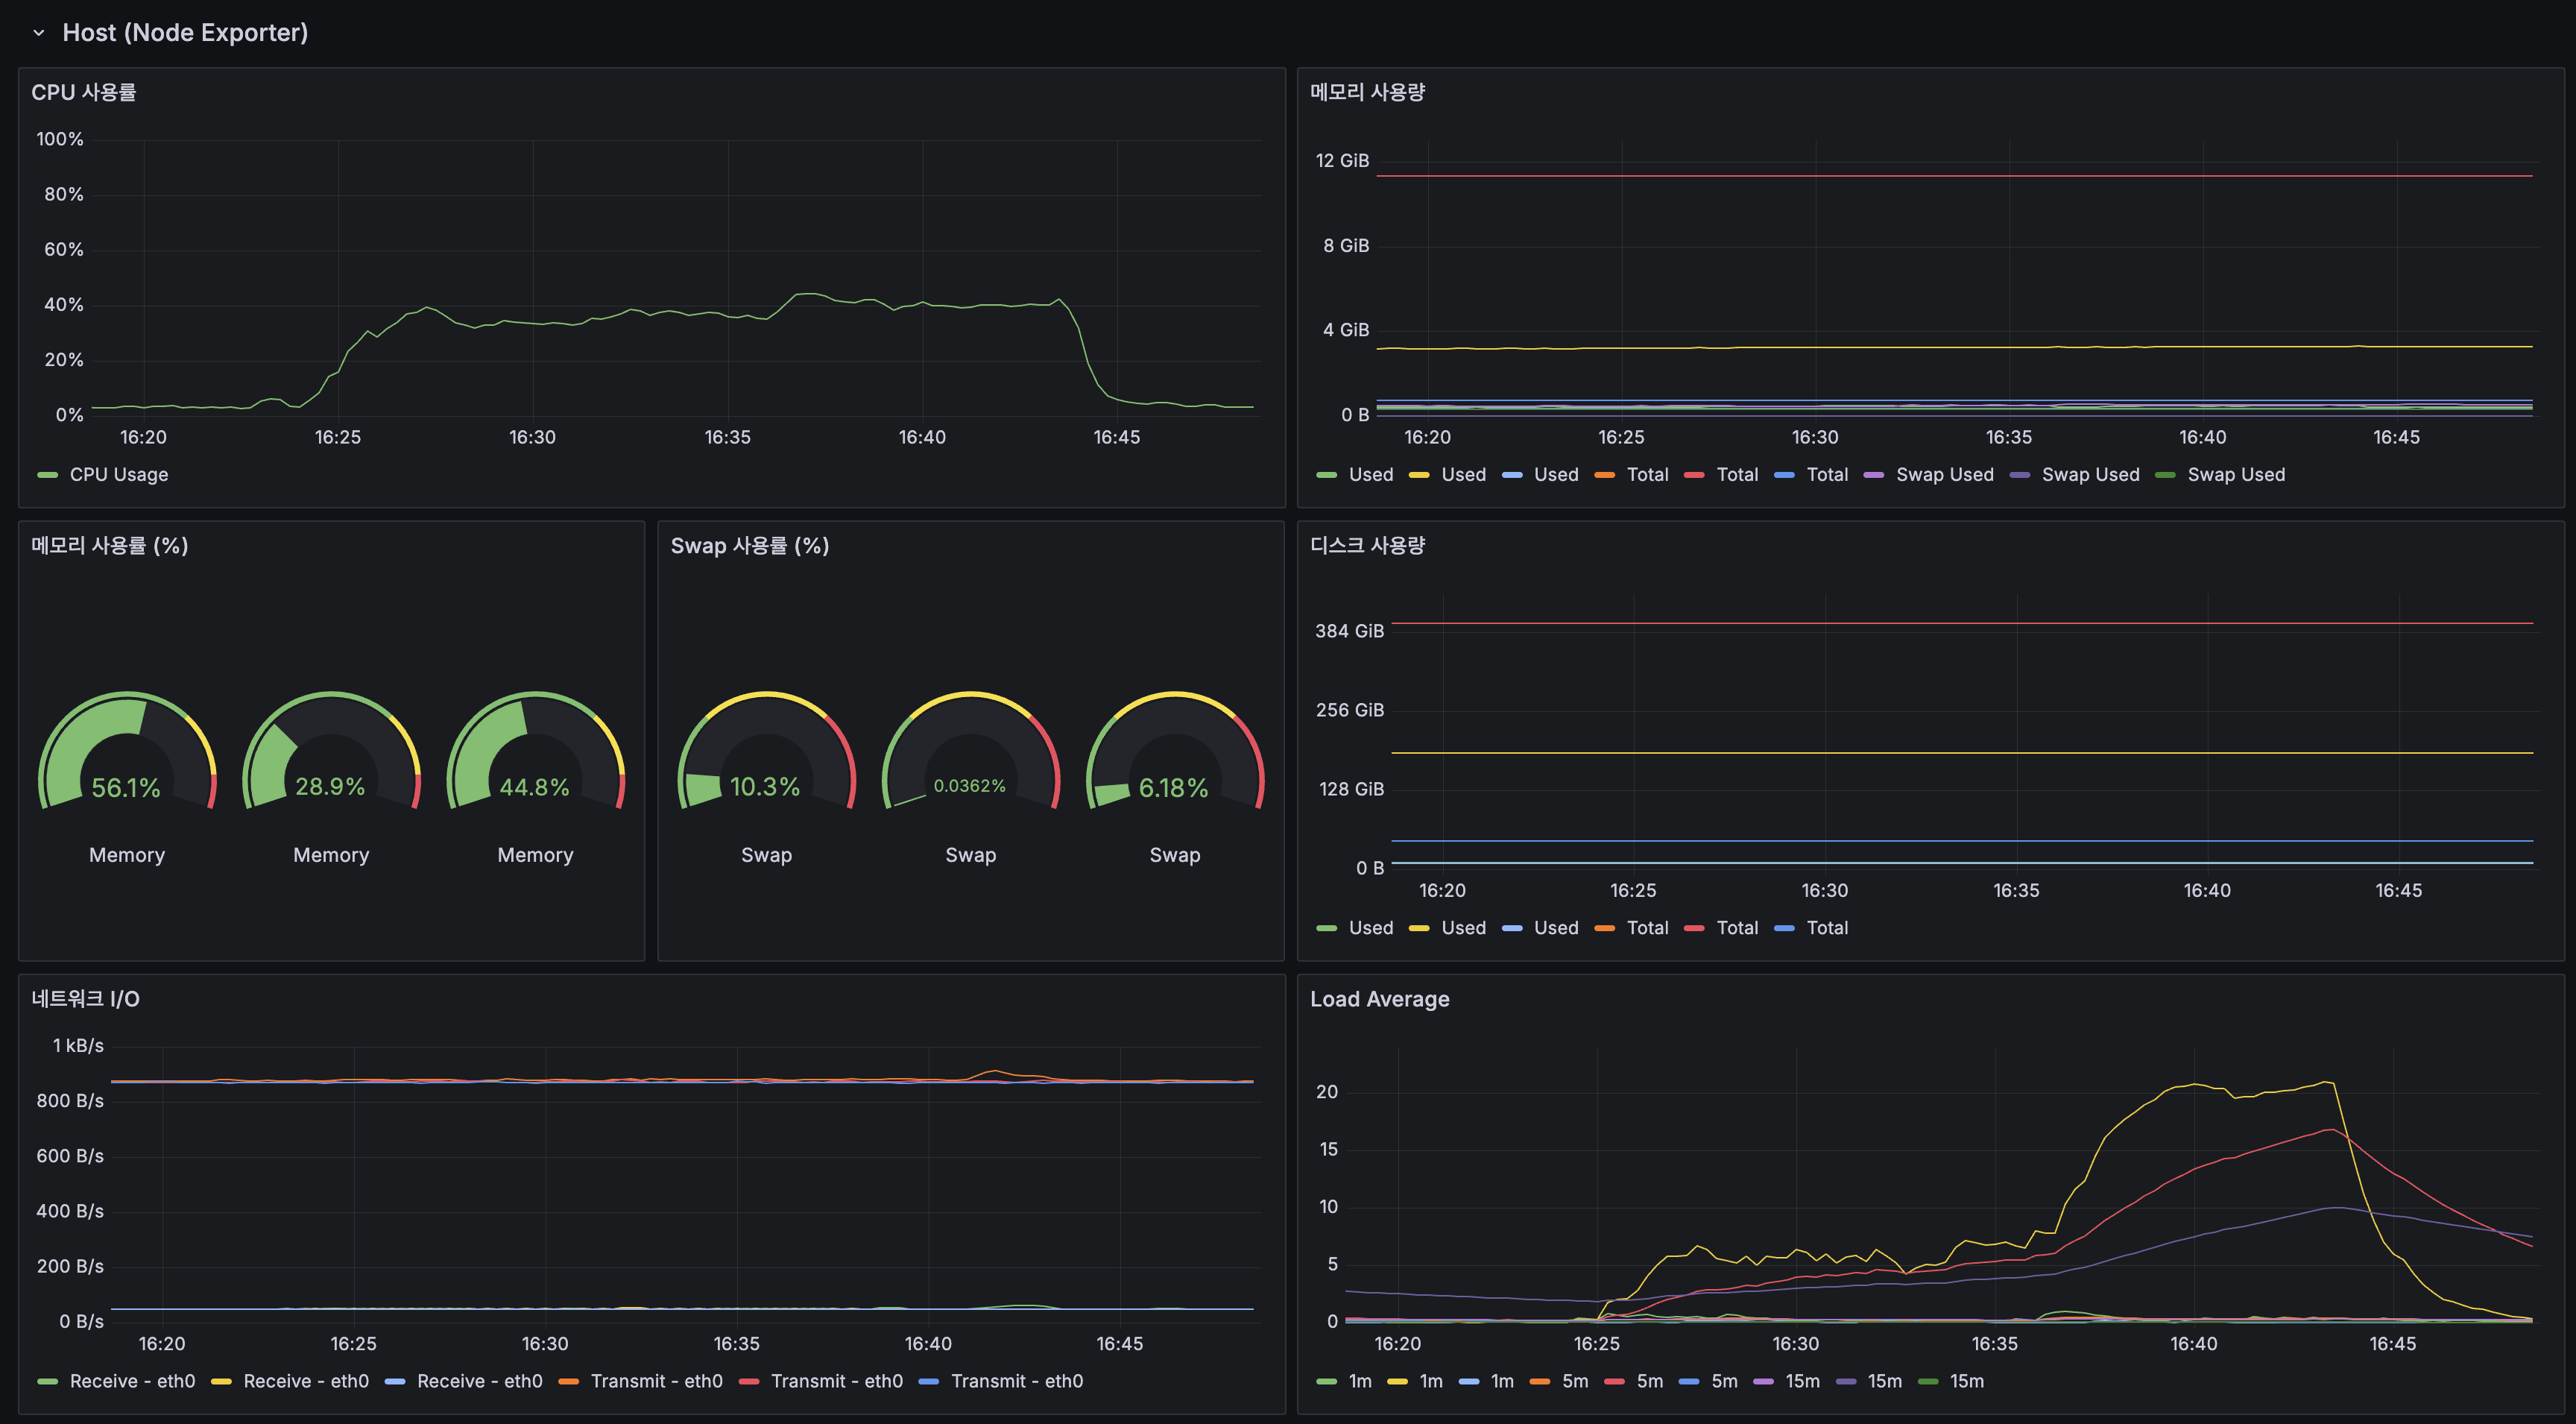
호스트:
| 지표 | 값 |
|---|---|
| CPU 사용률 | 피크 ~40% |
| Load Average (1m) | 피크 ~22 |
| 메모리 사용률 | 56.1% / 28.9% / 44.8% |
| 컨테이너 CPU (wiki-mysql-prod) | 피크 ~170% |
이전 글 대비 성능 변화: 왜 70배 느려졌는가
무엇이 바뀌었나
이전 글까지는 BM25 스코어링만 사용했습니다.
Lucene은 BM25 단독 스코어링에서 Block-Max WAND 최적화를 적용할 수 있어서,
posting list 전체를 순회하지 않고 top-k 결과를 빠르게 추출합니다.
검색 품질 고도화에서 검색 품질을 올리기 위해 3개의 추가 스코어링 요소를 도입했습니다:
| 추가 요소 | 역할 | 비용 |
|---|---|---|
| FeatureField(viewCount) | 조회수 기반 인기도 부스팅 | 매칭 문서마다 DocValues 1회 읽기 |
| FeatureField(likeCount) | 좋아요 기반 인기도 부스팅 | 매칭 문서마다 DocValues 1회 읽기 |
| RecencyDecay(createdAt) | 최신 게시글 가중치 부여 | 매칭 문서마다 DocValues 1회 읽기 + decay 계산 |
왜 검색이 느려졌나
“대한민국” 같은 고빈도 토큰은 수만~수십만 건이 매칭됩니다.
이전 글 (BM25만): "대한민국" 검색 -> posting list 순회 + BM25 score만 계산 -> WAND 최적화로 일부만 평가 -> ~25ms
검색 품질 고도화 후 (BM25 + FeatureField + RecencyDecay): "대한민국" 검색 -> posting list 순회 + BM25 score 계산 + viewCount DocValues 읽기 (매칭 문서마다) + likeCount DocValues 읽기 (매칭 문서마다) + createdAt DocValues 읽기 + decay 계산 (매칭 문서마다) -> 복합 스코어링으로 WAND 최적화 제한 -> ~2,800mssmoke(5 VU)에서 이를 확인할 수 있습니다:
| 시나리오 | 이전 글 smoke | 품질 고도화 후 smoke | 변화 |
|---|---|---|---|
| 검색 (전체) | 66ms | 184ms | 2.8배 |
| 희귀 토큰 | — | 21ms | 빠름 (posting list 짧음) |
| 고빈도 토큰 | — | 389ms | 느림 (posting list 길음) |
| 자동완성 | 25ms | 5ms | 오히려 빠름 |
| 목록 조회 | 8.33ms | 8.50ms | 동일 |
| 상세 조회 | 15.06ms | 12.49ms | 동일 |
5 VU에서는 검색만 2.8배 느려졌고, 나머지 API는 동일합니다.
왜 검색 외에 전부 느려졌나 (100 VU)
| 시나리오 | 이전 글 load (100 VU) | 품질 고도화 후 load (100 VU) | 변화 |
|---|---|---|---|
| 검색 평균 | 20.51ms | 1,443ms | 70배 |
| 자동완성 평균 | 5.91ms | 368ms | 62배 |
| 목록 평균 | 8.33ms | 392ms | 47배 |
| 상세 조회 평균 | 15.06ms | 384ms | 25배 |
| 총 요청 수 | 42,401건 | 29,867건 | -30% |
자동완성/목록/상세는 스코어링과 무관한데 62배/47배/25배 느려졌습니다.
이것은 검색 자체가 느려진 게 아니라, CPU 포화로 인한 cascade failure입니다.
원인 체인:
1. 품질 고도화 후 검색 = BM25 + DocValues 3회 -> 검색 1건당 CPU 시간 증가2. 100 VU 동시 검색 -> 2코어 CPU 포화 (App CPU 80~100%)3. CPU 대기열 형성 -> 모든 요청이 CPU 순번을 기다림4. 자동완성/목록/상세도 CPU 대기열에 갇힘 -> 전체 응답시간 폭증5. HikariCP 커넥션 대기 (Pending ~50) -> DB 접근도 병목6. JVM 스레드 20 -> 100+ 폭증 -> 컨텍스트 스위칭 오버헤드 추가이것은 이전 글에서 deep OFFSET이 CPU를 포화시켜 전체 API가 무너졌던 것과 동일한 패턴입니다.
단일 병목(이번엔 검색 스코어링)이 공유 자원(CPU)을 독점하면, 무관한 API까지 연쇄 지연됩니다.
왜 캐싱이 해답인가
검색 결과를 캐싱하면:
- 캐시 히트 시 Lucene 검색 + DocValues 읽기가 통째로 스킵됩니다
- CPU 사용이 0에 수렴 → 2코어로도 100 VU를 처리할 여유 확보
- cascade failure 해소 → 자동완성/목록/상세도 원래 속도로 복귀
검색 트래픽은 Zipf 분포를 따르므로, 상위 인기 검색어만 캐싱해도 히트율 80%+를 기대할 수 있습니다.
캐시 히트율 80% = 검색 CPU 부하 80% 감소 = cascade failure 임계점 이하로 복귀.
구현 확인
코드 변경 diff
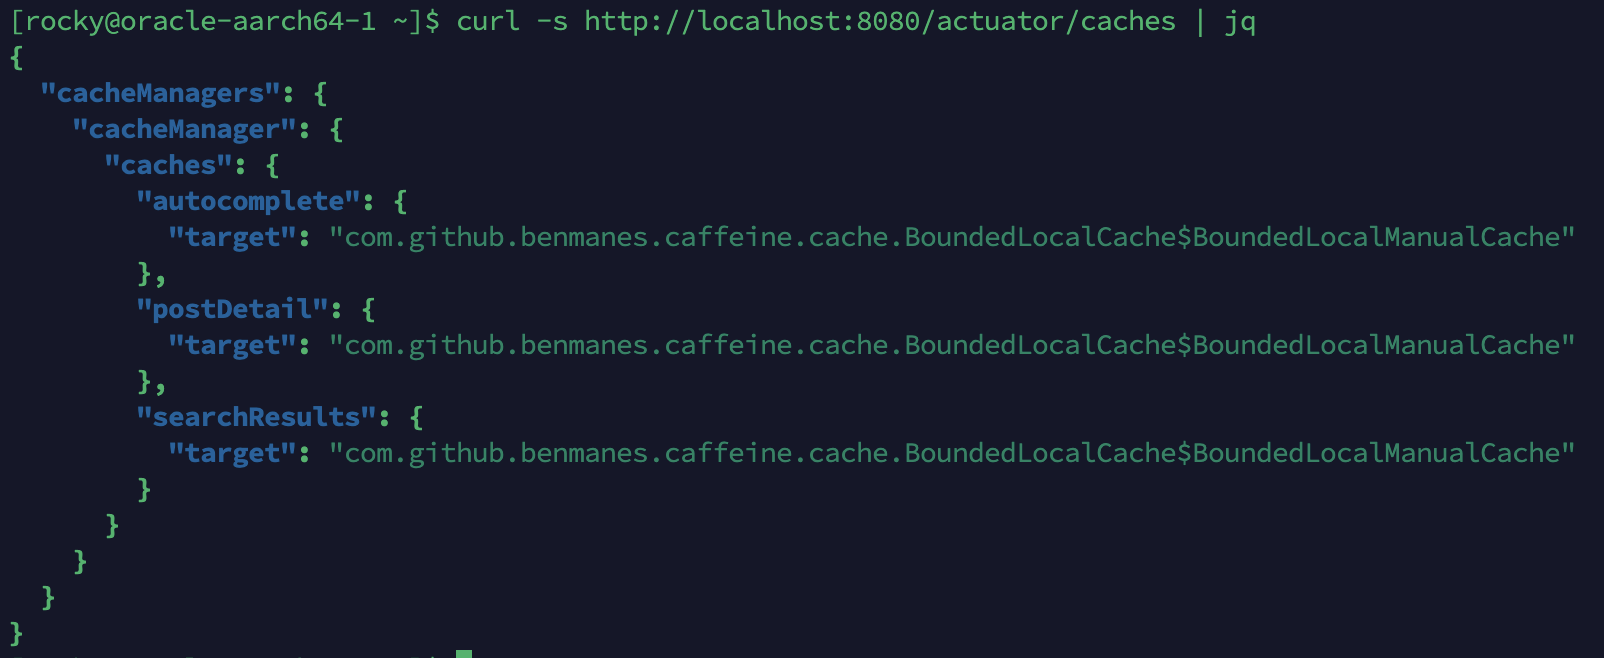
/actuator/caches 응답
참고: 외부(Nginx) 경로는 403 Forbidden이 반환되므로 앱 서버에서 localhost:8080으로 직접 확인합니다.
캐시 히트/미스 응답시간 비교
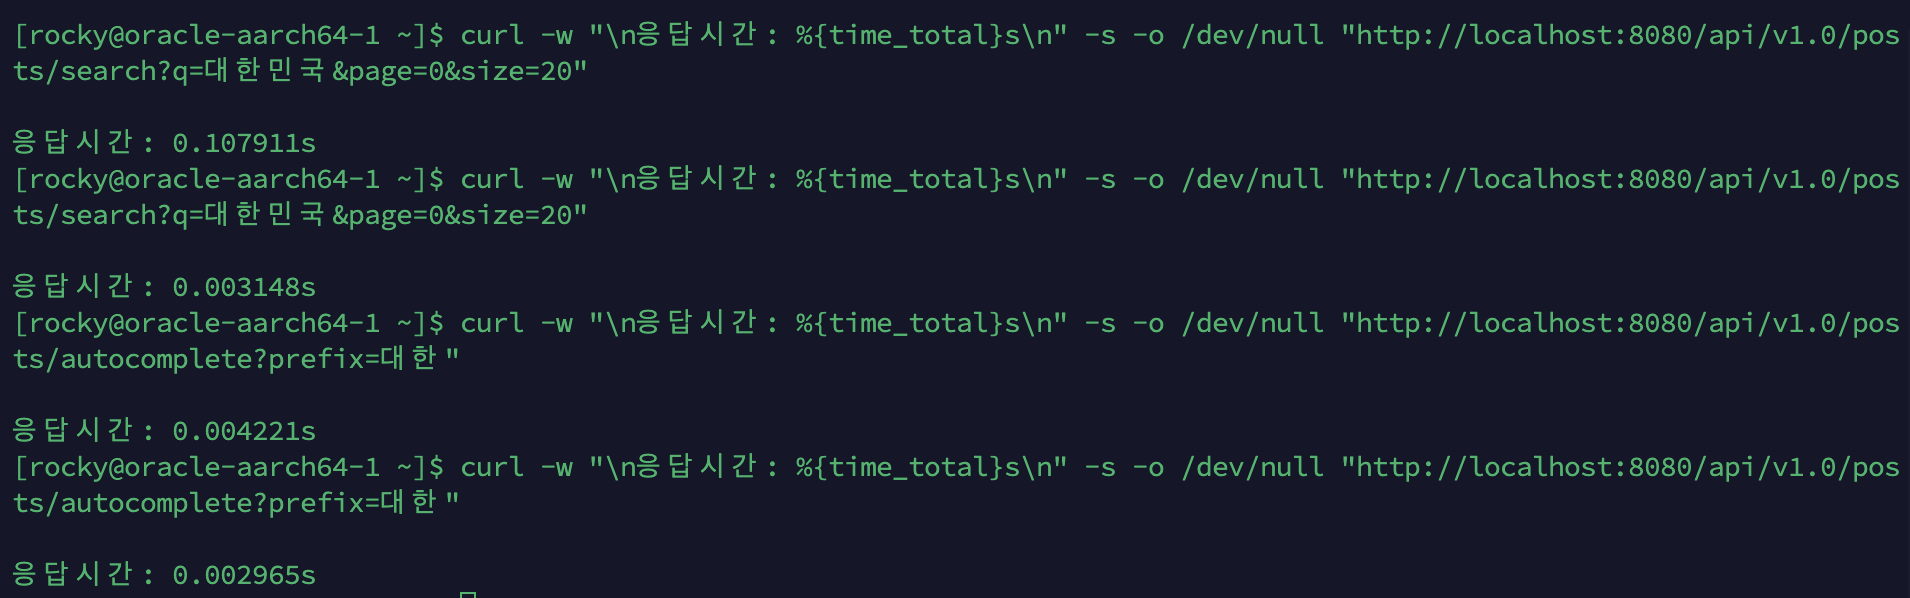
| API | 1차 (캐시 미스) | 2차 (캐시 히트) | 개선율 |
|---|---|---|---|
검색 (q=대한민국) | 107.9ms | 3.1ms | 34배 |
자동완성 (prefix=대한) | 4.2ms | 2.9ms | 1.4배 |
검색은 Lucene BM25 + DocValues 3회 읽기가 통째로 스킵되어 극적인 차이.
자동완성은 원래 Lucene PrefixQuery 자체가 빨라서 차이가 작지만, 부하 테스트 시 CPU 포화 환경에서는 캐시 효과가 크게 나타납니다.
Cache-Control 헤더 확인
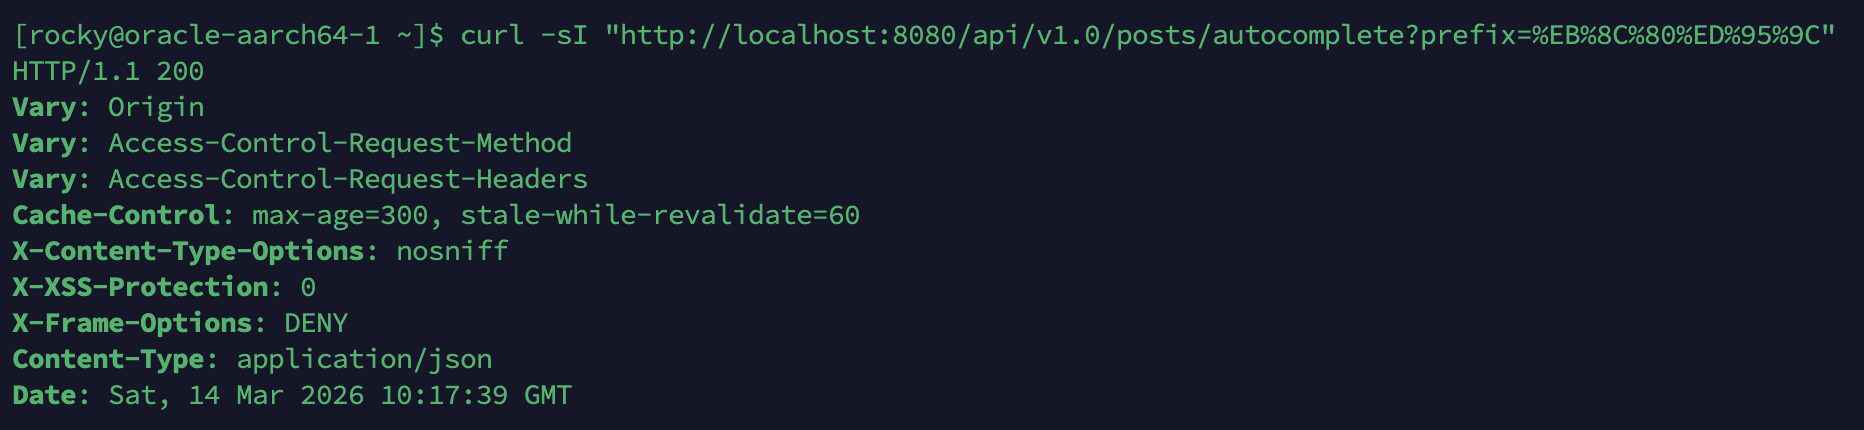
자동완성 API 응답에 Cache-Control: max-age=300, stale-while-revalidate=60 헤더가 포함되어, 브라우저가 5분간 캐시하고 만료 후 60초간 이전 응답을 반환하면서 백그라운드 갱신합니다.
After (캐시 적용 후 측정)
캐싱 구현 완료 후, Before와 동일한 조건으로 다시 측정합니다.
측정일시: 2026-03-14 19:20~19:40 KST
테스트 환경: Before와 동일 (ARM 2코어 / 12GB RAM)
k6 프로필: load (100 VU, 20분)
K6_INFLUXDB_PUSH_INTERVAL=10s k6 run --out influxdb=http://localhost:8086/k6 \ -e PROFILE=load -e BASE_URL=https://api.studywithtymee.com \ /home/rocky/k6/baseline-load-test.jsInfluxDB 쓰기 부하로 k6 Grafana 대시보드 데이터가 유실됨 (InfluxDB 128MB 메모리 제한).
k6 콘솔 결과 + Prometheus 기반 서버 Grafana로 비교.
k6 콘솔 결과
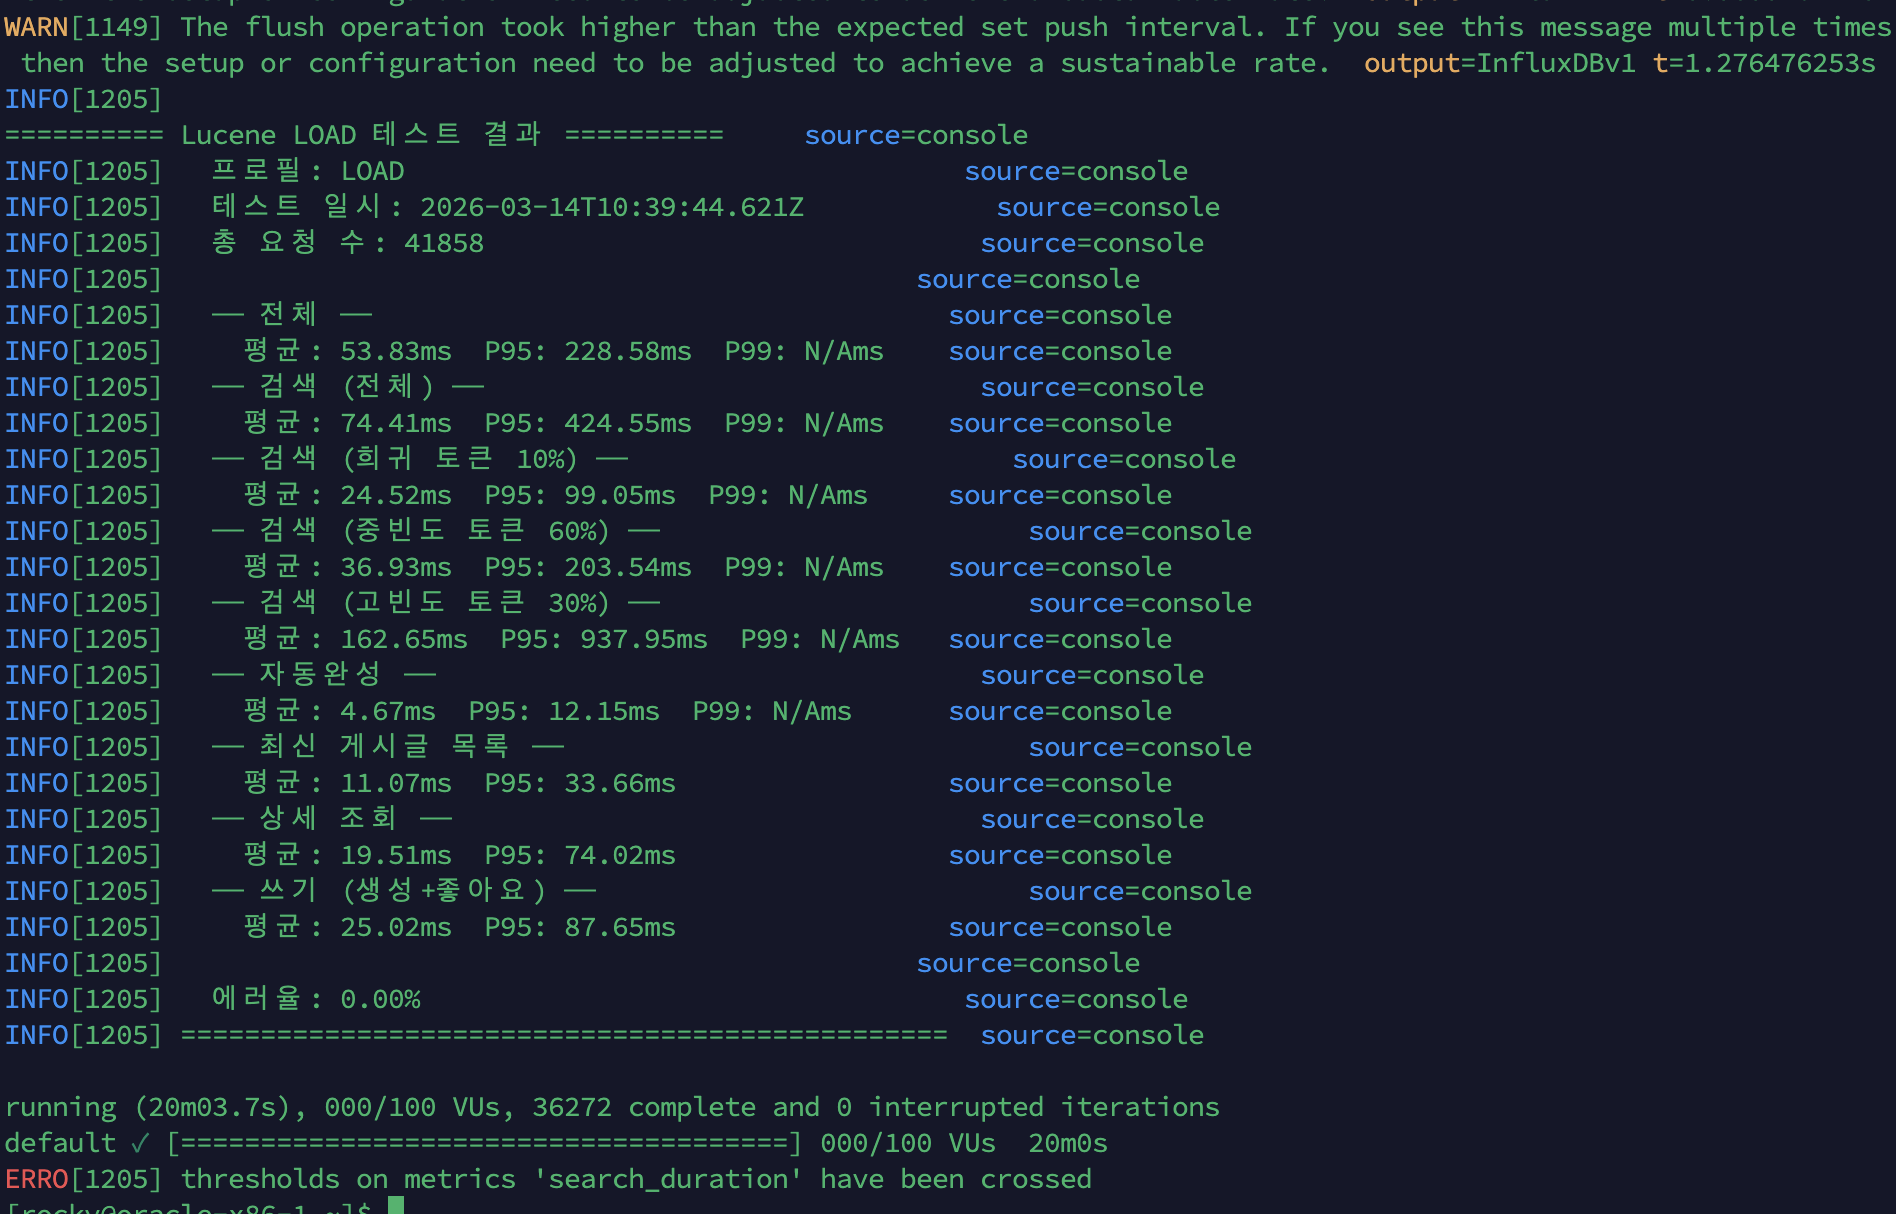
| 시나리오 | 평균 | P95 |
|---|---|---|
| 전체 | 53.83ms | 228.58ms |
| 검색 (전체) | 74.41ms | 424.55ms |
| 검색 (희귀 토큰 10%) | 24.52ms | 99.05ms |
| 검색 (중빈도 토큰 60%) | 36.93ms | 203.54ms |
| 검색 (고빈도 토큰 30%) | 162.65ms | 937.95ms |
| 자동완성 | 4.67ms | 12.15ms |
| 최신 게시글 목록 | 11.07ms | 33.66ms |
| 상세 조회 | 19.51ms | 74.02ms |
| 쓰기 (생성+좋아요) | 25.02ms | 87.65ms |
| 항목 | 값 |
|---|---|
| 총 요청 수 | 41,858건 |
| 에러율 | 0.00% |
서버 Grafana (After)
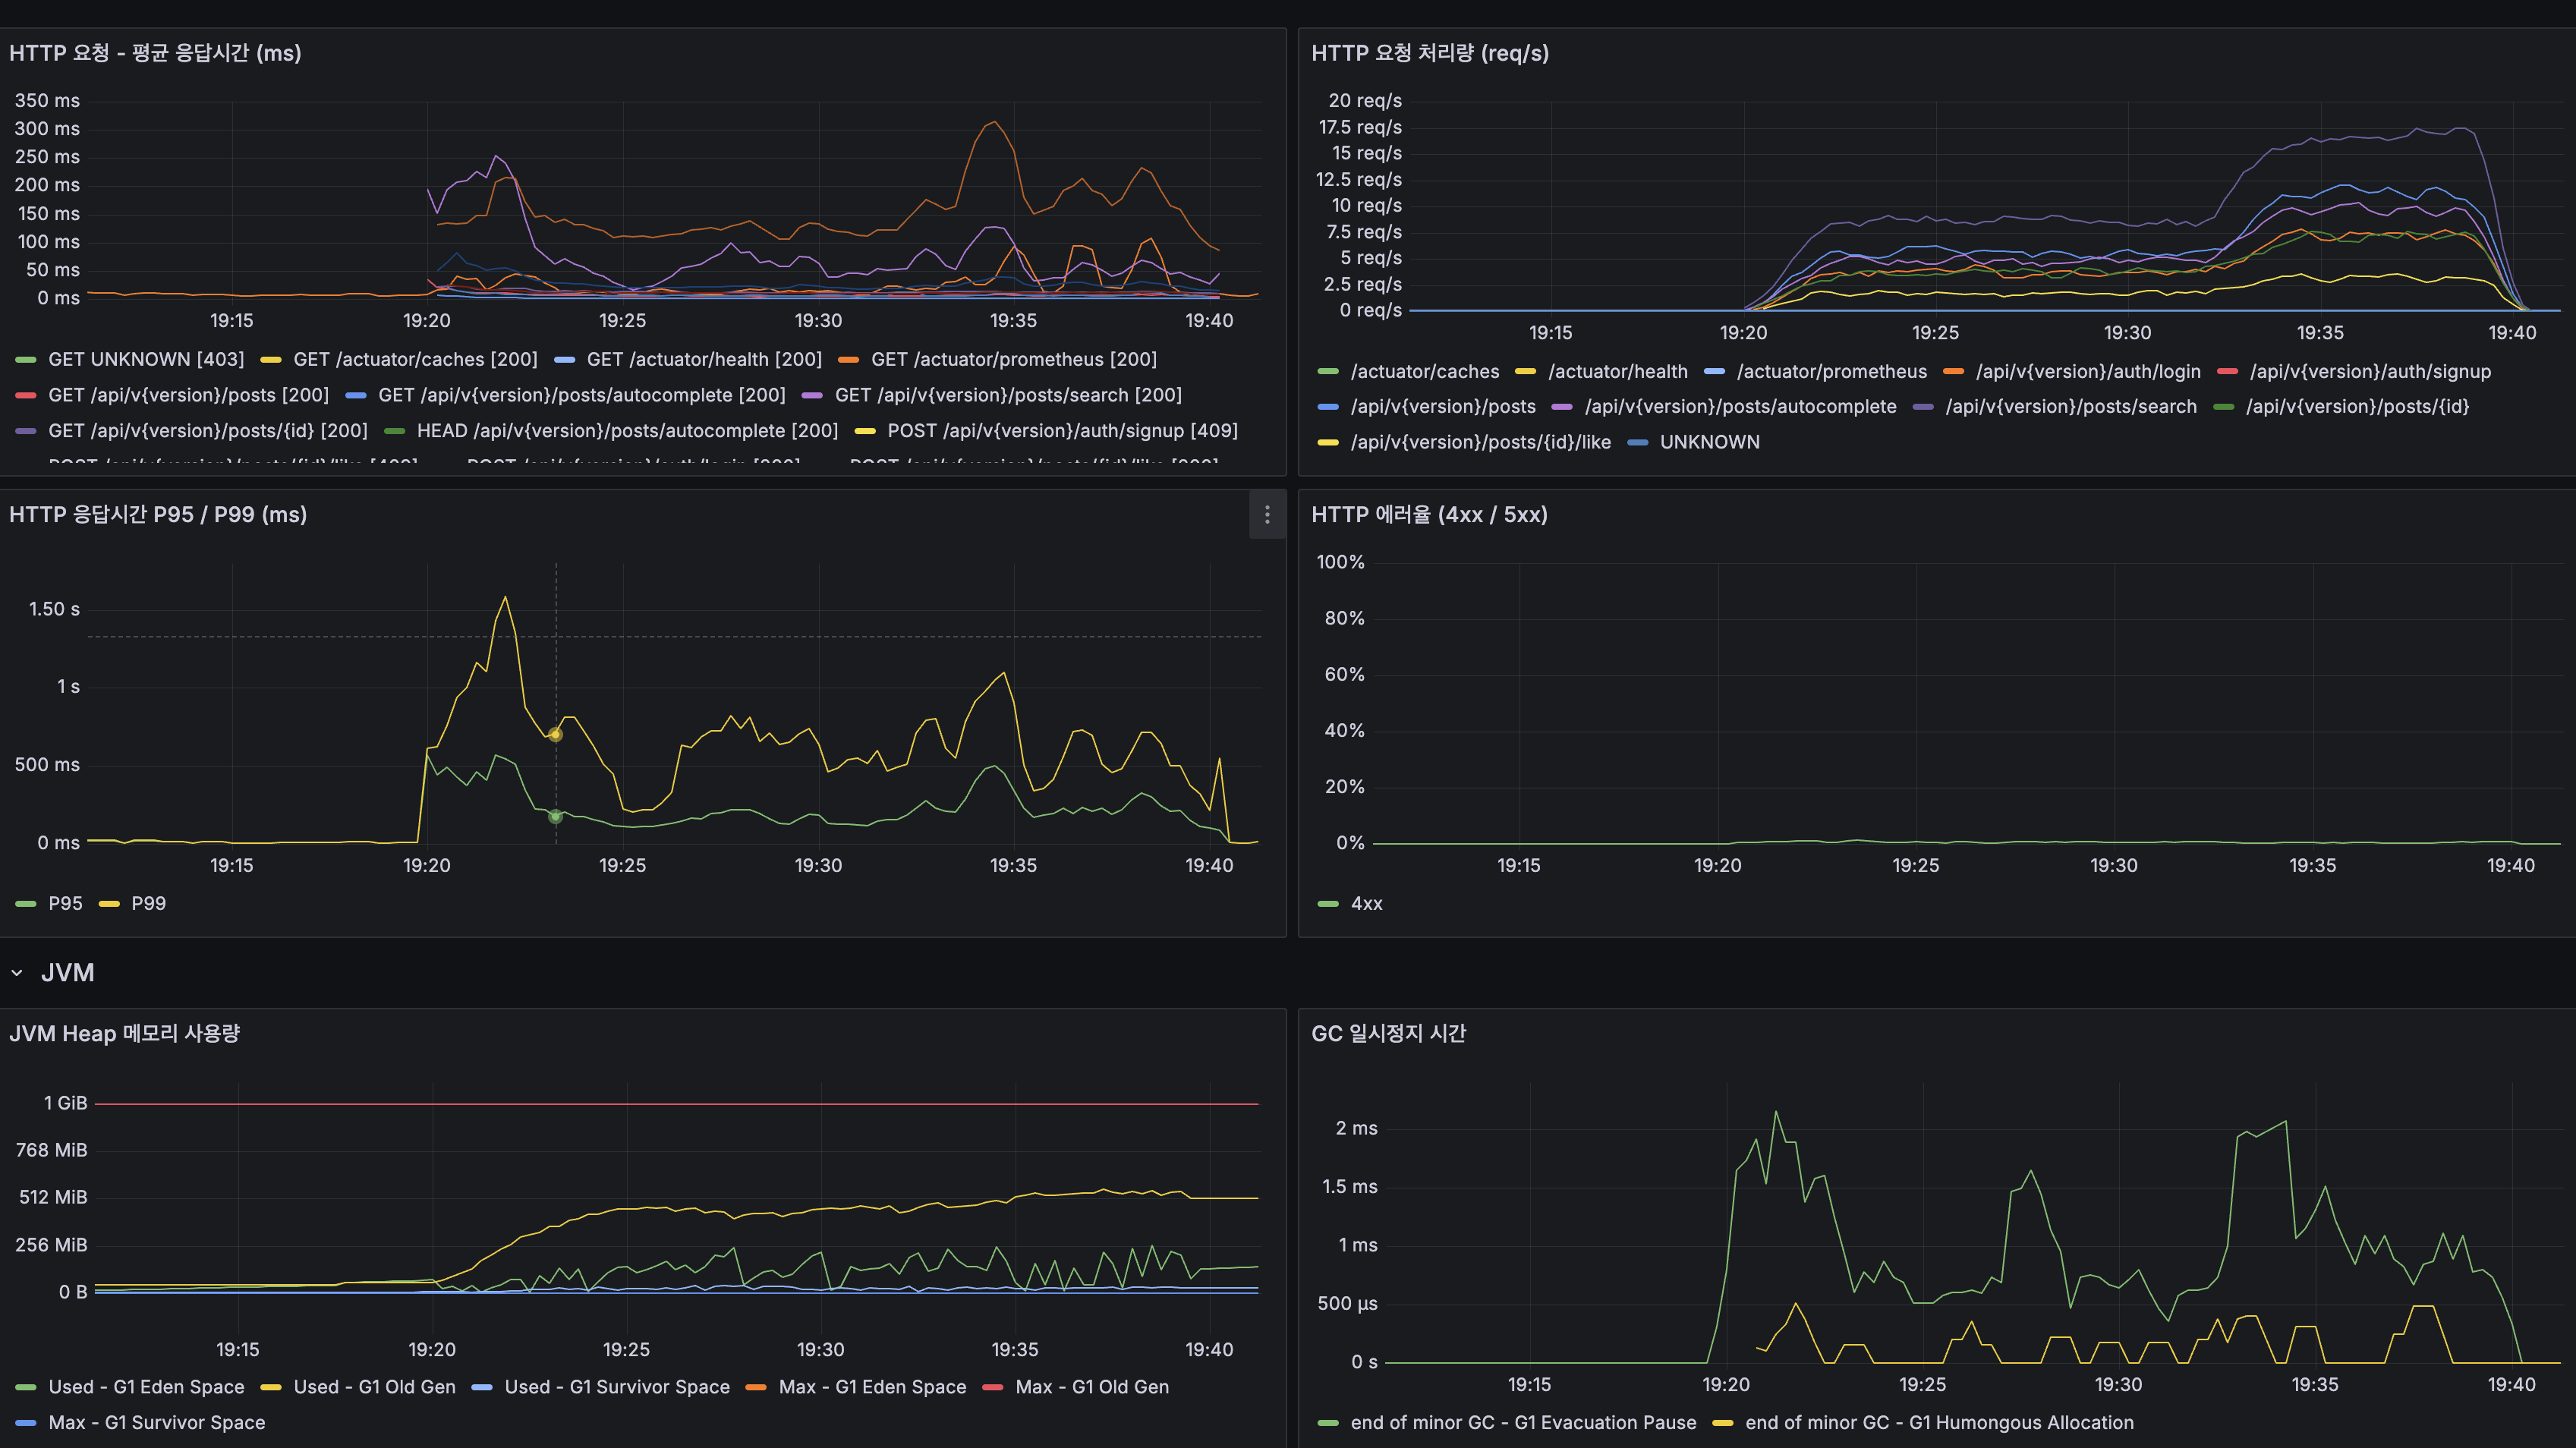
Spring Boot:
| 지표 | 값 |
|---|---|
| App CPU | 20~40% (Before: 80~100%) |
| JVM 스레드 | 30~40 (Before: 100+) |
| JVM Heap | Max 1 GiB, 사용량 안정 |
| GC Pause | ~1ms |
| HikariCP Active | ~1~2 |
| HikariCP Pending | 0 (Before: ~50) |
| HikariCP 획득 시간 | ~0.1~0.2ms (Before: ~1.5s) |
Caffeine Cache:
| 지표 | 값 |
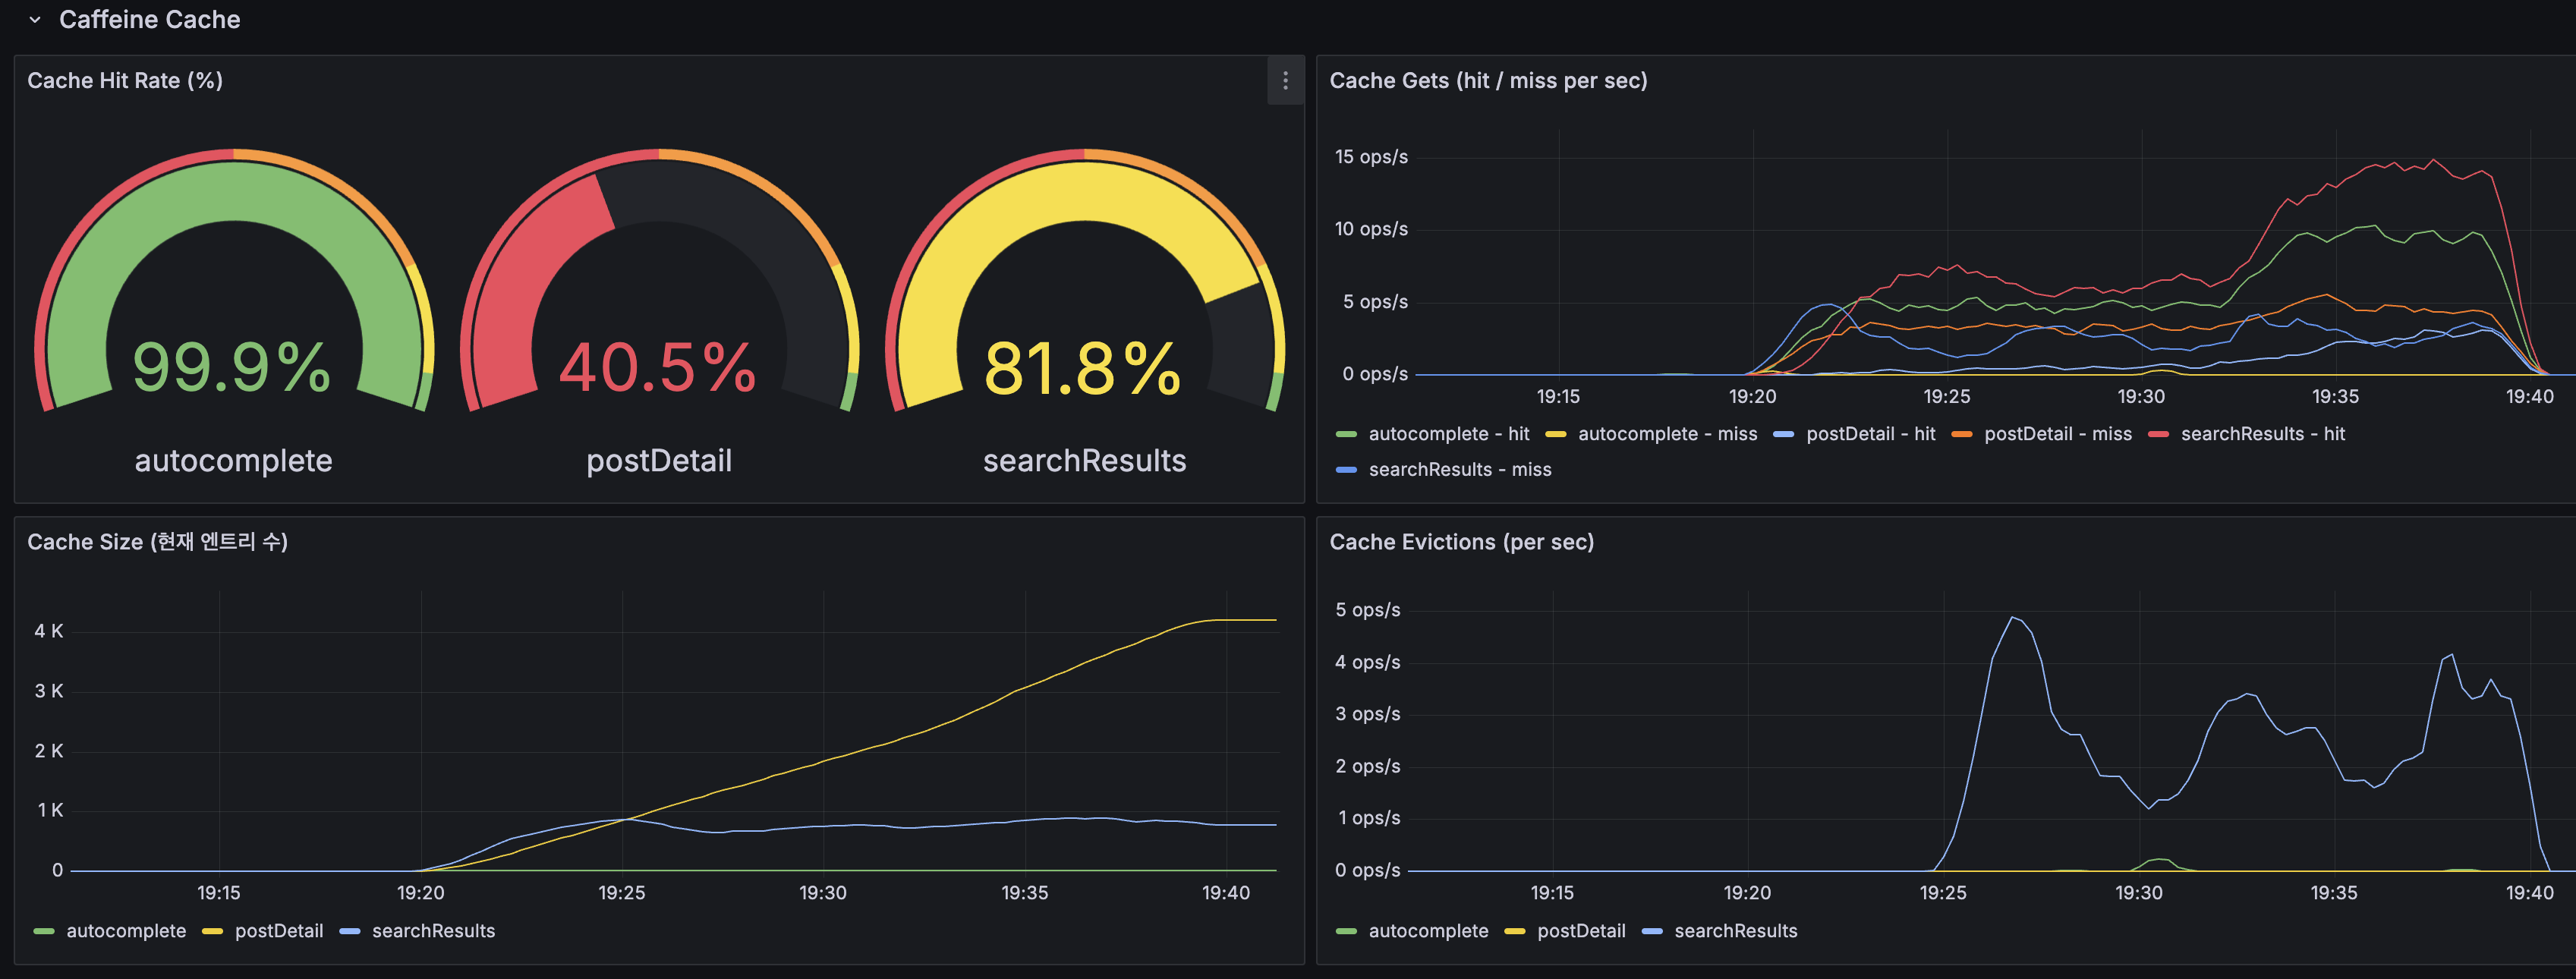
|---|---|
| searchResults 히트율 | 81.8% |
| autocomplete 히트율 | 99.9% |
| postDetail 히트율 | 40.5% |
| Cache Size (최대) | ~4K entries |
| Evictions | searchResults ~4 ops/s (TTL 5분 만료) |
MySQL:
| 지표 | 값 |
|---|---|
| QPS | 피크 ~200 ops/s |
| 커넥션 수 | ~1~2 (Before: ~30) |
| InnoDB Buffer Pool 히트율 | 99.9% |
| Slow Queries (누적) | 15.1K |
| Table Locks | 0 |
호스트:
| 지표 | 값 |
|---|---|
| CPU 사용률 | 피크 ~40% (Before: ~40%) |
| Load Average (1m) | 피크 ~6 (Before: ~22) |
| 메모리 사용률 | 48.7% / 35.7% / 45.2% |
Before vs After 비교
k6 핵심 지표 비교표
| 지표 | Before (캐시 없음) | After (Caffeine) | 개선율 |
|---|---|---|---|
| 전체 평균 | 775.89ms | 53.83ms | 93% (14.4x) |
| 전체 P95 | 2,782.67ms | 228.58ms | 92% (12.2x) |
| 검색 평균 | 1,443.01ms | 74.41ms | 95% (19.4x) |
| 검색 P95 | 7,001.88ms | 424.55ms | 94% (16.5x) |
| 고빈도 검색 평균 | 2,842.28ms | 162.65ms | 94% (17.5x) |
| 고빈도 검색 P95 | 9,752.19ms | 937.95ms | 90% (10.4x) |
| 자동완성 평균 | 368.18ms | 4.67ms | 99% (78.8x) |
| 목록 평균 | 391.88ms | 11.07ms | 97% (35.4x) |
| 상세 조회 평균 | 384.11ms | 19.51ms | 95% (19.7x) |
| 쓰기 평균 | 408.94ms | 25.02ms | 94% (16.3x) |
| 총 요청 수 (20분) | 29,867건 | 41,858건 | +40% |
| 에러율 | 0.00% | 0.00% | 동일 |
서버 리소스 비교표
| 항목 | Before | After | 변화 |
|---|---|---|---|
| App CPU | 80~100% 포화 | 20~40% | 60%p 감소 |
| JVM 스레드 | 100+ 폭증 | 30~40 | 60% 감소 |
| HikariCP Pending | ~50 | 0 | 완전 해소 |
| HikariCP 획득 시간 | ~1.5s | ~0.1ms | 15,000x |
| Load Average (1m) | ~22 | ~6 | 73% 감소 |
| MySQL QPS | ~150 | ~200 | 아래 설명 참조 |
| MySQL 커넥션 | ~30 | ~1~2 | 93% 감소 |
MySQL QPS가 150→200으로 증가한 이유: 캐싱으로 CPU 경합이 해소되면서 총 처리량이 29,867→41,858건(+40%)으로 늘어났습니다. 캐시 미스 요청 + 쓰기 요청(생성/좋아요)의 절대 수가 증가했기 때문에 QPS도 증가한 것입니다. 요청당 DB 접근 횟수는 캐시 히트에 의해 감소했지만, 전체 처리량 증가가 이를 상쇄했습니다. Slow Queries 누적값(8.34K→15.1K)도 같은 원인입니다.
캐시 효과 요약
| 항목 | 값 |
|---|---|
| 캐시 히트율 (searchResults) | 81.8% |
| 캐시 히트율 (autocomplete) | 99.9% |
| 캐시 히트율 (postDetail) | 40.5% |
postDetail 히트율이 40.5%인 이유: k6 부하 테스트가 1,477만 건 중 랜덤 postId를 조회하므로 캐시 재적중 확률이 낮습니다. 실제 운영에서는 Zipf 분포에 따라 인기 게시글에 트래픽이 집중되므로 히트율이 더 높을 것으로 예상됩니다.
cascade failure 해소
Before에서 검색 CPU 포화로 인해 검색과 무관한 API(자동완성, 목록, 상세)까지 전부 느려졌던 cascade failure가 완전히 해소되었습니다.
| 시나리오 | Before (cascade) | After (캐시) | 원래 속도 (smoke 5VU) |
|---|---|---|---|
| 자동완성 | 368ms | 4.67ms | 5ms |
| 최신 목록 | 392ms | 11.07ms | 8.5ms |
| 상세 조회 | 384ms | 19.51ms | 12.5ms |
캐시로 검색 CPU 부하를 제거하자, 자동완성/목록/상세가 smoke 테스트(5 VU)와 거의 동일한 속도로 복귀했습니다. 이것이 캐싱의 진짜 효과입니다. 직접 캐싱된 API뿐 아니라, CPU 경합이 해소되면서 전체 API가 원래 성능을 되찾았습니다.
OOM 안전성 검증
Caffeine은 JVM 힙 안에서 동작하므로, 캐시가 힙을 잠식하면 OOM으로 서버가 죽을 수 있습니다. 부하 테스트(100 VU, 20분) 중 실측값으로 안전성을 확인했습니다.
| 항목 | 설정 상한 | 부하 중 실측 | 판단 |
|---|---|---|---|
| searchResults 엔트리 수 | 10,000 | ~4,000 | 상한의 40%, 여유 있음 |
| autocomplete 엔트리 수 | 10,000 | 수백 | 충분 |
| postDetail 엔트리 수 | 50,000 | 수백 | 충분 |
| JVM Heap 사용량 | Max 1 GiB | 부하 중 안정 (Eden + Old Gen 변동 정상) | OOM 위험 없음 |
| Evictions (searchResults) | - | ~4 ops/s | TTL 5분 만료에 의한 정상 축출 |
searchResults의 엔트리 수가 ~4,000에서 안정된 이유: TTL 5분이므로 5분 이내에 들어온 고유 검색어 수만큼 쌓이고, 이전 엔트리는 만료되어 자연 축출됩니다. maximumSize(10,000)에 도달하기 전에 TTL이 먼저 동작하여 메모리가 자연스럽게 관리되고 있습니다.
Evictions 그래프에서 축출이 발생하는 건 캐시가 정상적으로 오래된 엔트리를 버리고 있다는 증거이며, 축출 빈도가 급증하지 않으므로 maximumSize가 적절하게 설정되어 있다고 판단할 수 있습니다.
근거: Grafana Caffeine Cache 패널 + JVM Heap 패널
알려진 한계와 주의사항
캐시 일관성 (Cache Consistency)
캐시를 도입하면 DB와 캐시 사이에 데이터 불일치가 발생할 수 있습니다. DB에는 최신 값이 반영됐는데 캐시에는 이전 값이 남아서, 사용자가 stale data를 보게 되는 문제입니다.
예를 들어 상품 가격을 10,000원에서 8,000원으로 수정하고 DB에 반영했는데, 캐시에 이전 데이터(10,000원)가 남아있으면 사용자는 여전히 10,000원을 봅니다. 결제까지 갔다가 가격이 달라지면 사용자 신뢰를 잃습니다.
캐시 무효화는 실무에서 가장 성가신 문제입니다. TTL을 짧게 잡으면 캐시 미스가 잦아져 DB 부하가 줄지 않고, 길게 잡으면 사용자가 오랫동안 stale data를 봅니다. 정답은 없고, 데이터의 성격에 따라 개발자가 적절한 수준을 판단해야 합니다. 이것이 도메인 지식이 필요한 이유입니다.
| 데이터 성격 | TTL 전략 | 이유 |
|---|---|---|
| 변경이 드물고 stale해도 무방 | 긴 TTL (10~30분) | 자동완성, 카테고리 목록 등 |
| 변경 시 즉각 반영 필요 | 즉시 무효화 (@CacheEvict) | 게시글 상세, 상품 가격, 사용자 프로필 |
| 변경이 잦고 정확성 중요 | 캐싱하지 않음 | 재고 수량, 실시간 잔액 |
| 변경이 잦지만 근사값 허용 | 짧은 TTL (1~5분) | 검색 결과, 인기 랭킹 |
이 프로젝트에서의 판단:
- 검색 결과 캐시 (TTL 5분): 게시글 수정 후 최대 5분간 이전 결과가 반환될 수 있습니다. 커뮤니티 검색에서 허용 가능한 수준입니다 (Google 검색도 인덱스 갱신에 시간이 걸립니다)
- 게시글 상세 캐시 (즉시 무효화): 수정/삭제 시
@CacheEvict로 즉시 캐시를 제거합니다. 수정한 내용이 바로 반영되지 않으면 사용자 경험에 직접 영향을 줍니다 - 자동완성 캐시 (TTL 10분): 새 게시글이 추가되어도 10분간 자동완성에 나타나지 않을 수 있습니다. 자동완성은 “제안”이므로 즉각 반영이 필수는 아닙니다
Cache Stampede
TTL이 동시에 만료되면 대량의 요청이 동시에 DB로 몰립니다. (위 4번 섹션에서 상세 설명)
로컬 캐시와 OOM (Out of Memory)
Caffeine은 JVM 힙 메모리 안에서 동작하는 로컬 캐시입니다. 캐시 엔트리가 힙을 과도하게 차지하면 GC 압력이 증가하고, 최악의 경우 OOM으로 서버가 죽습니다. Redis(외부 프로세스)와 달리 앱과 캐시가 같은 메모리를 공유하기 때문에, 캐시가 커지면 앱이 쓸 메모리가 줄어드는 구조입니다.
이 프로젝트에서의 방어:
| 설정 | 값 | 효과 |
|---|---|---|
maximumSize | searchResults 10K, autocomplete 10K, postDetail 50K | 엔트리 수 상한으로 무한 성장 방지 |
| JVM 힙 | -Xmx1g | 전체 힙 크기 고정 |
| 캐시 예상 메모리 | ~100~200MB (전체 힙의 10~20%) | 나머지 80%를 앱 로직에 사용 |
maximumSize를 설정하지 않으면 인기 검색어가 계속 쌓이면서 힙을 잠식합니다. 특히 검색 결과 캐시는 Page<Post> 객체(엔티티 리스트)를 통째로 저장하므로 엔트리당 크기가 큽니다. Caffeine의 W-TinyLFU 축출 정책이 maximumSize 초과 시 가장 가치 낮은 엔트리를 제거하여 메모리를 관리합니다.
모니터링에서 cache_size(현재 엔트리 수)와 cache_evictions_total(축출 횟수)을 함께 봐야 합니다. 축출이 빈번하면 maximumSize가 작은 것이고, cache_size가 maximumSize에 한참 못 미치면 메모리를 낭비하는 것입니다.
Cold Start
서버 재시작 시 Caffeine 캐시가 비어있으므로, 모든 요청이 DB를 직접 hit합니다. 트래픽이 많은 시점에 배포하면 일시적으로 DB 부하가 급증할 수 있습니다.
완화 방법:
- 배포 직후 인기 검색어 목록으로 캐시를 미리 채우는 Warm-Up 스크립트
- Blue-Green 배포로 트래픽을 점진적으로 전환
검토했지만 별도 적용하지 않은 항목
| 항목 | 결론 | 이유 |
|---|---|---|
| Redis 분산 캐시 (L2) | 향후 단계로 연기 | 현재 단일 서버, Caffeine만으로 충분. 서버 다중화 시 도입 |
| CDN (CloudFront) | 별도 단계로 | CDN은 인프라 설정이 필요, 캐싱 효과 측정 후 판단 |
| Probabilistic Early Recomputation | 부하 테스트 후 결정 | Stampede가 실제 관측되면 적용 |
| 게시글 목록 캐싱 | SKIP | 최신 게시글 목록은 실시간성이 중요, 쓰기 빈도가 높은 커뮤니티 특성상 TTL을 극히 짧게 잡아야 해서 ROI 낮음 |
참고 자료
- Caffeine GitHub Wiki
- Baeldung — Spring Boot Caffeine Caching
- 네이버페이 — 니들이 Caffeine 맛을 알아?
- 카카오페이 — 분산 시스템에서 로컬 캐시 활용하기
- 올리브영 — 로컬 캐시와 Redis로 대규모 증정 행사 관리 최적화
- 채널톡 — Distributed Cache 도입기: RDB 조회 90% 감소시키기
- AWS — Database Caching Strategies Using Redis
- AWS Database Blog — RDS + ElastiCache 벤치마크
- Redis — Why Your Cache Hit Ratio Strategy Needs an Update
- 카카오 테크 — 카카오톡 캐싱 시스템의 진화
- Redis Customer Case Study — Kicker
Previous Post
In Search Quality Enhancement — Phrase Search, Community Ranking, and P@10/MAP Evaluation, we implemented phrase search with PhraseQuery(slop=2) and applied a combined ranking of BM25 + FeatureField(viewCount, likeCount) + RecencyDecay.
Previous Post Summary
In the previous post, we enhanced search quality.
We measured P@10/MAP across 15 test queries to quantitatively evaluate search quality.
| Metric | BM25 only | Full Ranking | Improvement |
|---|---|---|---|
| P@10 | 0.827 | 0.853 | +3.2% |
| MAP | 0.862 | 0.874 | +1.4% |
The modest improvement is due to the nature of the initial data (wiki dump): most posts have viewCount=0 and likeCount=0.
As popularity signals accumulate during actual community operation, the difference is expected to grow.
Overview
Reference: Information Retrieval, Section 13.4 — Caching
Current Architecture
Architecture up to Search Quality Enhancement:
Current request flow:
- Search: Client → API Server → Lucene Search (in-JVM, SearcherManager acquire/release)
- Autocomplete: Client → API Server → Lucene PrefixQuery
- List: Client → API Server → MySQL SELECT (Deferred Join)
- Detail: Client → API Server → MySQL SELECT
Search/autocomplete is handled by Lucene within the JVM, so the bottleneck is JVM CPU/memory, not MySQL.
List/detail queries still hit MySQL directly. There is no caching layer.
Why Caching Is Needed
The nature of search queries: they are repetitive.
Search traffic follows a Zipf distribution. A small number of popular queries account for the majority of traffic. In Wikipedia’s case, the top 1% of articles account for about 80% of total page views.
This means Lucene is repeatedly executing the same search for the same query. If 100 users search for “South Korea,” the system repeats SearcherManager acquire → BM25 search → DB Post entity lookup 100 times. 99 of those are wasted.
Core problem: reducing load reduces cost.
After the Lucene migration, the search bottleneck has two components:
- JVM CPU — Lucene BM25 search, SearcherManager acquire/release, index I/O
- MySQL — Post entity lookup by search result Post IDs, list/detail queries
Caching search results skips both Lucene search and DB entity lookups. JVM CPU and DB load decrease simultaneously.
Speed improvement and cost reduction are not separate concerns but causally related. When cache returns a search result in 0.1ms, that request uses zero MySQL CPU. Using no CPU means the same instance can handle more requests, which means there’s no need to upgrade to a more expensive instance. In other words, faster speed naturally results in lower cost.
Goals for This Phase
Introduce Caffeine local cache (L1) to reduce Lucene + DB load from repeated requests by 80%+.
| # | Content | Status |
|---|---|---|
| 1. Caffeine Cache Setup | @EnableCaching + CacheManager + per-cache policies | Implemented |
| 2. Search/Autocomplete Caching | @Cacheable (search, autocomplete) | Implemented |
| 3. Cache Invalidation | @CacheEvict (on post update/delete) | Implemented |
| 4. Cache Stampede Prevention | Caffeine built-in features + strategy selection | Implemented |
| 5. Browser Caching | Cache-Control headers (autocomplete API) | Implemented |
| 6. Cache Monitoring | Actuator + Caffeine recordStats | Implemented |
Caffeine dependency already exists: used for JWT blacklisting in
TokenBlacklist.
Spring Cache abstraction (@Cacheable, CacheManager) was not yet applied.
Cost Analysis and Alternative Review
Cost Scenario Analysis
Based on actual AWS Seoul region pricing, assuming DB costs of approximately 200,000 KRW (~$150) per month.
Cost structure of a DB-centric architecture:
When traffic increases under the current architecture, there are only two options:
- DB Scale-Up: Replace with a more expensive instance
- Add Read Replica: Add read-only replicas
Both increase costs linearly.
AWS RDS MySQL actual prices for Seoul region:
| Instance | vCPU | Memory | Monthly Cost |
|---|---|---|---|
| db.t4g.medium | 2 | 4 GiB | ~$74 |
| db.t3.medium | 2 | 4 GiB | ~$76 |
| db.r6g.large | 2 | 16 GiB | ~$200 |
| db.r6g.xlarge | 4 | 32 GiB | ~$400 |
Source: Holori RDS Calculator, DB Cost
In the AWS official benchmark to achieve 30,000 QPS:
- RDS only: db.r5.xlarge x1 + Read Replicas x4 = $1,740/mo
- RDS + ElastiCache: db.r5.xlarge x1 + ElastiCache cluster = $780/mo → 55% savings
Source: AWS Database Blog — Optimize cost and boost performance of RDS for MySQL using ElastiCache for Redis
Cost Comparison by Scenario
| Scenario | DB Cost | Cache Cost | Total Cost | Savings |
|---|---|---|---|---|
| A: DB only (current) | ~$150 | $0 | ~$150 | Baseline |
| B: DB + Redis | ~$55 | ~$18 | ~$73 | ~50% |
| C: DB + CDN | ~$75 | ~$4 | ~$79 | ~47% |
| D: DB + Caffeine + CDN | ~$75 | ~$0 | ~$75 | ~50% |
The key insight is not “adding cache increased costs” but rather “cache reduced DB load, allowing a lower DB spec, reducing total cost.”
For a single server with moderate traffic, Scenario D (Caffeine + CDN) is the most cost-effective. When scaling to multiple servers, Redis can be introduced at that point.
Alternative Review — Redis vs CDN vs Caffeine
Performance Comparison
| Layer | Latency | Network Overhead | Consistency |
|---|---|---|---|
| Caffeine (in-JVM) | Microseconds (< 0.1ms) | None (same JVM) | Instance-local only |
| Redis (distributed cache) | ~0.5-2ms (same region) | TCP round-trip | Shared across instances |
| CDN Edge | ~5-50ms (global) | HTTP | Propagation delay |
| MySQL (no cache) | ~6-500ms (varies by query) | TCP + Disk I/O | Source of Truth |
DB also has its own memory cache called InnoDB Buffer Pool. When the Buffer Pool is warm, it returns data from memory without disk I/O, so simple SELECTs may not show dramatic differences from Redis. The difference becomes apparent with CPU-intensive queries (FULLTEXT search, complex JOINs, sorting) and high concurrency.
When to Use Which Cache
| Situation | Recommended | Reason |
|---|---|---|
| Single server, low traffic | Caffeine | Zero cost, simplest implementation |
| Multiple servers, cache consistency needed | Redis | Cache sharing across instances |
| Static/semi-static content | CDN | Global user support, DB load distribution |
| Popular search term caching | Caffeine (L1) + Redis (L2) | Optimal performance with 2-tier cache |
| Post detail pages | CDN + Caffeine | Content rarely changes, frequently viewed |
| Autocomplete | Caffeine | Top N results don’t change, ultra-low latency needed |
Multi-Layer Cache Architecture
In practice, companies don’t use just one cache. This is the architecture actually used by Korean companies like KakaoPay and Olive Young:
KakaoPay uses a 3-tier cache of L1(Caffeine) → L2(Redis) → DB, with Redis Pub/Sub for L1 cache synchronization.
Olive Young experienced ElastiCache Network Bytes Out saturation during large-scale promotions and added Caffeine L1 cache to reduce Redis network I/O.
Source: KakaoPay — Using Local Cache in Distributed Systems, Olive Young — Optimizing Large-Scale Promotions with Local Cache and Redis
Industry Case Studies
AWS Official Benchmark
In a 30,000 QPS scenario, RDS + ElastiCache achieved 55% cost savings and 80x faster read performance compared to RDS alone. A single ElastiCache node can process over 250,000 requests per second, replacing 4 Read Replicas with 1 Redis instance.
Source: AWS Database Blog — Optimize cost and boost performance of RDS for MySQL using ElastiCache for Redis
Channel.io
Introducing distributed cache reduced RDB queries from 1,500 TPS to under 100 TPS. 93% reduction. Cache hit rate reached nearly 100%. Probabilistic Early Expiration preemptively refreshes cache before TTL expiry to prevent Cache Stampede.
Source: Channel.io — Distributed Cache Introduction: Reducing RDB Queries by 90%
Kicker (German Football Media)
With 2 billion monthly page views and 15% annual traffic growth, deploying Redis Enterprise achieved 40% web server cost reduction and 60% DB server cost reduction. Legacy hardware was fully decommissioned.
KakaoTalk
Handles over 4 million data access requests per second. Migrated from 256 physical servers running Memcached to a Kubernetes + Redis cache farm architecture. Uses hostNetwork to eliminate the Kubernetes Ingress/Service layer, allowing Redis nodes to communicate directly and minimizing network overhead.
Source: Kakao Tech — Evolution of KakaoTalk Caching System, Kakao Tech — Building Redis Cache Cluster on Kubernetes
NaverPay
Compared Ehcache and Caffeine as local cache solutions. Caffeine’s Window TinyLfu eviction policy outperformed Ehcache’s LRU/LFU in benchmarks, with Caffeine being faster in both reads and writes.
1. Caffeine Cache Configuration
Goal
- Enable Spring Cache abstraction (
@EnableCaching) - Independent policies per cache target (TTL, max size, eviction strategy)
- Collect hit rates with Caffeine
recordStats()
Current State
Caffeine dependency: O (caffeine:3.2.0 in build.gradle)Spring Cache: X (@EnableCaching not configured, CacheManager not registered)@Cacheable: X (not used anywhere)TokenBlacklist used Caffeine directly (Cache<String, Boolean>), but was a manual approach without Spring Cache abstraction (@Cacheable).
This phase introduces Spring Cache abstraction for declarative caching.
Caching Target Analysis
Since search was migrated to Lucene in the Lucene migration, posting lists are internally cached by Lucene via MMapDirectory + OS page cache.
There are 3 targets for app-level caching:
Posting list caching — Lucene MMapDirectory leverages OS page cache, no separate app cache needed
Post Detail Caching Design Decision
Problem: getPostAndIncrementView() increments viewCount simultaneously with retrieval.
Applying @Cacheable to this method would prevent viewCount from incrementing on cache hits.
Options:
| Option | Pros | Cons |
|---|---|---|
| A. Don’t cache | Accurate viewCount | DB query every time |
| B. Separate read/write | Accurate viewCount + cache | More complex code |
| C. Cache + async viewCount | Cache hit + count reflected | Slight inaccuracy |
Option B (Separate read/write) adopted:
// Read: caching target@Cacheable(value = "postDetail", key = "#id")public Post findById(Long id) { ... }
// Write: only increment viewCount (independent of cache)public void incrementViewCount(Long id) { postRepository.incrementViewCount(id); }Combining both methods in the controller:
Post post = postService.findByIdCached(id); // Cache hit possiblepostService.incrementViewCount(id); // Always updates DBCache Policy Design
| Cache | Max Size | TTL | Eviction Policy | Reason |
|---|---|---|---|---|
| searchResults | 10,000 | 5min (expireAfterWrite) | W-TinyLFU | Diverse keyword+page combinations, caches CPU-intensive Lucene search |
| autocomplete | 10,000 | 10min (expireAfterWrite) | W-TinyLFU | Limited prefix variety, results don’t change often |
| postDetail | 50,000 | 30min (expireAfterAccess) | W-TinyLFU | Popular posts are frequently revisited, immediate invalidation on update/delete |
W-TinyLFU: Caffeine’s default eviction policy. Combines LRU + LFU to consider both recency and frequency.
In NaverPay’s benchmark, Caffeine (W-TinyLFU) outperformed Ehcache (LRU) in both hit rate and throughput.
Adding random jitter to TTL (e.g., base TTL +/- 10%) prevents Cache Stampede where many cache entries expire simultaneously. Instagram uses this technique for feed caching.
Cache Size vs Hit Rate Trade-off
| Cache Size | Memory Usage | Expected Hit Rate | Notes |
|---|---|---|---|
| 1K entries | ~10MB | ~30% | Too small |
| 10K entries | ~100MB | ~60% | Sweet spot |
| 100K entries | ~1GB | ~85% | Memory pressure |
| Unlimited | OOM risk | 100% | Impractical |
Search queries follow a long-tail (Zipf) distribution, so caching just the top 1,000 queries can achieve significant hit rates.
Implementation
@Configuration@EnableCachingpublic class CacheConfig {
@Bean public CacheManager cacheManager() { CaffeineCacheManager manager = new CaffeineCacheManager();
// 1. Search results cache (keyword+page → Page<Post>) manager.registerCustomCache("searchResults", Caffeine.newBuilder() .maximumSize(10_000) .expireAfterWrite(Duration.ofMinutes(5)) .recordStats() .build());
// 2. Autocomplete cache (prefix → title list) manager.registerCustomCache("autocomplete", Caffeine.newBuilder() .maximumSize(10_000) .expireAfterWrite(Duration.ofMinutes(10)) .recordStats() .build());
// 3. Post detail cache (postId → Post entity) manager.registerCustomCache("postDetail", Caffeine.newBuilder() .maximumSize(50_000) .expireAfterAccess(Duration.ofMinutes(30)) .recordStats() .build());
return manager; }}2. Search/Autocomplete Caching (@Cacheable)
Cache-Aside Pattern
The most common caching strategy for search is Cache-Aside (Lazy Loading). The application explicitly manages the cache and DB.
Applying Cache
@Cacheable(value = "searchResults", key = "#keyword + ':' + #pageable.pageNumber + ':' + #pageable.pageSize")public Page<Post> search(String keyword, Pageable pageable) { validatePageLimit(pageable, MAX_SEARCH_PAGE); try { return luceneSearchService.search(keyword, pageable); } catch (IOException e) { throw new UncheckedIOException(e); }}
@Cacheable(value = "autocomplete", key = "#prefix")public List<String> autocomplete(String prefix) { try { return luceneSearchService.autocomplete(prefix, 10); } catch (IOException e) { throw new UncheckedIOException(e); }}Cache Key Design
| Cache | Key Pattern | Example |
|---|---|---|
| searchResults | {keyword}:{page}:{size} | "Samsung:0:20" |
| autocomplete | {prefix} | "Sam" |
| postDetail | {postId} | 12345 |
Note: The search cache key must include pageSize. Even with the same keyword + page=0, size=10 and size=20 produce different results.
@Cacheable and @Transactional Conflict Warning
Currently, PostService has class-level @Transactional(readOnly = true).
@Cacheable is AOP proxy-based, so calling from another method within the same class won’t trigger the cache (self-invocation problem).
Currently, search() and autocomplete() are called directly from the controller, so there’s no issue.
However, calling the cached findById() from within getPostAndIncrementView() would be self-invocation, so it must be called separately from the controller.
3. Cache Invalidation (@CacheEvict)
Invalidation Strategy
| Cache | Invalidation Method | Reason |
|---|---|---|
| searchResults | TTL expiry (5min) | Cache keys vary too widely by query; impossible to determine which search results are affected by a single post update |
| autocomplete | TTL expiry (10min) | Results vary by prefix; hard to determine impact scope when titles change |
| postDetail | Immediate invalidation (@CacheEvict) | Precisely identifiable by post ID; serving stale data after update/delete directly impacts user experience |
Implementation
// Immediately remove cache when post is updated@CacheEvict(value = "postDetail", key = "#id")@Transactionalpublic void updatePost(Long id, String title, String content, Long userId) { Post post = postRepository.findById(id) .orElseThrow(() -> new BusinessException(ErrorCode.POST_NOT_FOUND)); if (!post.getAuthorId().equals(userId)) { throw new BusinessException(ErrorCode.ACCESS_DENIED); } post.update(title, content); indexSafely(post);}
// Immediately remove cache when post is deleted@CacheEvict(value = "postDetail", key = "#id")@Transactionalpublic void deletePost(Long id, Long userId) { // ... existing logic}Cache Consistency and Acceptable Delay
- Search results: Previous search results may be returned for up to 5 minutes after a post update. This is acceptable for a community service (even Google search takes time for crawl updates).
- Autocomplete: New posts may not appear in autocomplete for up to 10 minutes. Impact is limited since it’s prefix-based.
- Post detail: Immediately invalidated with
@CacheEvict. The next request after update/delete returns the latest DB data.
4. Cache Stampede Prevention
Problem
When the cache for the popular query “Samsung Electronics” expires by TTL, 100 simultaneous requests all hit cache miss → 100 Lucene searches + 100 DB queries execute concurrently.
Time T: "Samsung Electronics" cache expires ↓100 simultaneous requests → all cache miss → 100 Lucene + 100 DB queries ↓JVM CPU spike, DB overloadPrevention Methods
| Method | Description | When to Apply |
|---|---|---|
| TTL Randomization | Add +/- 10% jitter to base TTL | Immediately |
| Probabilistic Early Expiration | Refresh with probability before TTL expires | Channel.io case |
| Mutex Lock | Only one thread queries DB on cache miss, others wait | High traffic |
refreshAfterWrite | Caffeine built-in — async refresh before TTL expires | After load testing |
Caffeine’s Built-in Solution: refreshAfterWrite
Caffeine’s refreshAfterWrite asynchronously refreshes the cache before TTL expiry.
The previous value is returned during refresh, so Stampede doesn’t occur.
// refreshAfterWrite: background refresh starts after 3min// expireAfterWrite: forced expiry after 5min (safety net)manager.registerCustomCache("searchResults", Caffeine.newBuilder() .maximumSize(10_000) .refreshAfterWrite(Duration.ofMinutes(3)) // async refresh after 3min .expireAfterWrite(Duration.ofMinutes(5)) // forced expiry after 5min .recordStats() .buildAsync(key -> loadFromLucene(key)) // async loader .synchronous());However, with @Cacheable + CaffeineCacheManager, a CacheLoader must be registered separately instead of buildAsync. This increases complexity:
Practical choice: In a single-server environment, Stampede impact is limited.
Configure only expireAfterWrite TTL, and add refreshAfterWrite if actual problems are observed during load testing.
5. Browser Caching (Cache-Control)
In addition to server cache (Caffeine), browser caching reduces network requests altogether.
Even in a single-server environment without CDN, the browser acts as a cache.
Targets
| API | Cache-Control | Reason |
|---|---|---|
Autocomplete (/posts/autocomplete) | max-age=300, stale-while-revalidate=60 | Suggestion list doesn’t change by the minute. 5min caching is appropriate |
Search (/posts/search) | max-age=60 | Search results may change relatively often, so short caching |
Post Detail (/posts/{id}) | max-age=300 | Posts that aren’t frequently edited benefit from 5min caching |
Post List (/posts) | no-cache or unset | Latest post list requires real-time freshness |
Implementation
// PostController: Autocomplete — 5min browser caching@GetMapping("/autocomplete")public ResponseEntity<List<String>> autocomplete(@RequestParam String prefix) { List<String> suggestions = postService.autocomplete(prefix); return ResponseEntity.ok() .cacheControl(CacheControl.maxAge(Duration.ofMinutes(5)) .staleWhileRevalidate(Duration.ofSeconds(60))) .body(suggestions);}stale-while-revalidate Behavior
6. Cache Monitoring (Actuator)
After introducing caching, you must continuously measure “is it actually effective?”
If hit rate is below 80%, review TTL, key design, and max size.
Monitoring Metrics
| Metric | Target | Meaning |
|---|---|---|
| Cache hit rate | >= 80% | Below 80% means TTL or key design needs review |
| Cache memory usage | 10-20% of JVM heap | Adjust maximumSize if exceeded |
| Eviction count | Lower is better | High means maximumSize is insufficient |
| Lucene search TPS | 50%+ decrease vs pre-caching | No decrease means cache isn’t working |
Caffeine recordStats + Actuator Exposure
// recordStats() already configured in CacheConfigCaffeine.newBuilder() .maximumSize(10_000) .expireAfterWrite(Duration.ofMinutes(5)) .recordStats() // Collect stats like hit rate .build()Spring Actuator endpoints:
/actuator/caches— List of registered caches/actuator/metrics/cache.gets— Cache hit/miss counts/actuator/metrics/cache.evictions— Eviction counts/actuator/metrics/cache.size— Current cache entry count
Grafana Dashboard Integration
Add cache metrics to existing Prometheus + Grafana monitoring:
management: metrics: tags: application: wikiengine endpoints: web: exposure: include: caches, metrics, health, prometheusAdding the ratio of cache_gets_total{result="hit"} / cache_gets_total to a Grafana dashboard enables real-time hit rate monitoring.
Load Test and Results
Measurement Principles
- Before/After same conditions: Same k6 profile (load), same VU (100), same duration (20min)
- k6 InfluxDB output:
--out influxdb=http://localhost:8086/k6(Grafana k6 dashboard integration) - Grafana time range alignment: Align time ranges when capturing dashboards
Before (No Cache Baseline)
Measurement: 2026-03-14 16:20~16:45 KST
Test environment: ARM 2-core / 12GB RAM — Spring Boot JVM 1GB + MySQL InnoDB BP 2GB
k6 profile: load (100 VU, 20min)
k6 Console Results
k6 run --out influxdb=http://localhost:8086/k6 \ -e PROFILE=load -e BASE_URL=https://api.studywithtymee.com \ /home/rocky/k6/baseline-load-test.js
| Scenario | Avg | P95 |
|---|---|---|
| Overall | 775.89ms | 2,782.67ms |
| Search (all) | 1,443.01ms | 7,001.88ms |
| Search (rare tokens 10%) | 482.15ms | 1,968.56ms |
| Search (medium-freq tokens 60%) | 911.39ms | 3,152.86ms |
| Search (high-freq tokens 30%) | 2,842.28ms | 9,752.19ms |
| Autocomplete | 368.18ms | 1,735.93ms |
| Latest post list | 391.88ms | 1,818.40ms |
| Detail view | 384.11ms | 1,746.40ms |
| Write (create+like) | 408.94ms | 1,828.19ms |
| Item | Value |
|---|---|
| Total requests | 29,867 |
| Error rate | 0.00% |
k6 Grafana Dashboard
| Metric | Value |
|---|---|
| Avg response time | 776ms |
| P95 response time | 2.78s |
| P99 response time | 8.38s |
| Error rate | 0% |
| Throughput (avg / max) | 16.5 req/s / 33.9 req/s |
| Concurrent users (avg / max) | 62.5 / 100 VU |
By Scenario (Grafana):
| Scenario | Mean | Max | 95th |
|---|---|---|---|
| Search | 1.33s | 6.07s | 3.90s |
| Autocomplete | 382ms | 3.98s | 1.79s |
| List view | 389ms | 4.02s | 1.87s |
| Detail view | 391ms | 3.88s | 1.77s |
By Search Frequency (Grafana):
| Frequency | Mean | Max | 95th |
|---|---|---|---|
| Rare tokens (10%) | 453ms | 3.46s | 1.90s |
| Medium-freq tokens (60%) | 842ms | 4.87s | 2.66s |
| High-freq tokens (30%) | 2.66s | 10.1s | 7.42s |
Network Details:
| Phase | Mean |
|---|---|
| DNS | 0.077ms |
| Connection | 0.009ms |
| Waiting (TTFB) | 748ms |
| Receiving | 0.164ms |
| Network traffic | Received 130 MiB / Sent 5.59 MiB |
Server Grafana
Spring Boot:
| Metric | Value |
|---|---|
| App CPU | 80~100% saturated |
| JVM Threads | 20 → 100+ surge |
| JVM Heap | Max 1 GiB, usage stable |
| GC Pause | 1~2.5ms |
| HikariCP Pending | Up to ~50 |
| HikariCP Acquire Time | Up to ~1.5s |
MySQL:
| Metric | Value |
|---|---|
| QPS | Peak ~150 ops/s |
| Connections | ~30 Connected |
| InnoDB Buffer Pool Hit Rate | 100% |
| InnoDB Buffer Pool Usage | ~1 GiB |
| Slow Queries (cumulative) | 8.34K |
| Table Locks | 0 |
Host:
| Metric | Value |
|---|---|
| CPU Usage | Peak ~40% |
| Load Average (1m) | Peak ~22 |
| Memory Usage | 56.1% / 28.9% / 44.8% |
| Container CPU (wiki-mysql-prod) | Peak ~170% |
Previous Post Performance Change — Why It Got 70x Slower
What Changed
Up to the previous phase, only BM25 scoring was used.
Lucene can apply Block-Max WAND optimization with standalone BM25 scoring,
traversing only a portion of the posting list to quickly extract top-k results.
In Search Quality Enhancement, we introduced 3 additional scoring factors to improve search quality:
| Additional Factor | Role | Cost |
|---|---|---|
| FeatureField(viewCount) | View count-based popularity boosting | 1 DocValues read per matching doc |
| FeatureField(likeCount) | Like count-based popularity boosting | 1 DocValues read per matching doc |
| RecencyDecay(createdAt) | Recency weighting for newer posts | 1 DocValues read + decay calculation per matching doc |
Why Search Got Slower
High-frequency tokens like “South Korea” match tens to hundreds of thousands of documents.
Previous phase (BM25 only): "South Korea" search → posting list traversal + BM25 score only → WAND optimization evaluates only a portion → ~25ms
After search quality enhancement (BM25 + FeatureField + RecencyDecay): "South Korea" search → posting list traversal + BM25 score + viewCount DocValues read (per matching doc) + likeCount DocValues read (per matching doc) + createdAt DocValues read + decay calculation (per matching doc) → WAND optimization limited by composite scoring → ~2,800msThis is confirmed in smoke testing (5 VU):
| Scenario | Previous Post Smoke | After Quality Enhancement Smoke | Change |
|---|---|---|---|
| Search (overall) | 66ms | 184ms | 2.8x |
| Rare tokens | — | 21ms | Fast (short posting list) |
| High-freq tokens | — | 389ms | Slow (long posting list) |
| Autocomplete | 25ms | 5ms | Actually faster |
| List view | 8.33ms | 8.50ms | Same |
| Detail view | 15.06ms | 12.49ms | Same |
At 5 VU, only search got 2.8x slower; all other APIs remained the same.
Why Everything Else Got Slower (100 VU)
| Scenario | Previous Post Load (100 VU) | After Quality Enhancement Load (100 VU) | Change |
|---|---|---|---|
| Search avg | 20.51ms | 1,443ms | 70x |
| Autocomplete avg | 5.91ms | 368ms | 62x |
| List avg | 8.33ms | 392ms | 47x |
| Detail avg | 15.06ms | 384ms | 25x |
| Total requests | 42,401 | 29,867 | -30% |
Autocomplete/list/detail are unrelated to scoring, yet got 62x/47x/25x slower.
This is not search itself getting slower but a cascade failure due to CPU saturation.
Cause chain:
1. After quality enhancement, search = BM25 + 3 DocValues reads → CPU time per search increases2. 100 VU concurrent search → 2-core CPU saturated (App CPU 80~100%)3. CPU queue forms → all requests wait for CPU turns4. Autocomplete/list/detail also trapped in CPU queue → overall response time explodes5. HikariCP connection wait (Pending ~50) → DB access also bottlenecked6. JVM threads 20 → 100+ surge → context switching overhead addedThis is the same pattern as the previous phase where deep OFFSET saturated the CPU and collapsed all APIs.
When a single bottleneck (this time search scoring) monopolizes shared resources (CPU), unrelated APIs are cascading delayed.
Why Caching Is the Answer
Caching search results means:
- On cache hit, Lucene search + DocValues reads are entirely skipped
- CPU usage approaches zero → enough headroom to handle 100 VU with 2 cores
- Cascade failure resolved → autocomplete/list/detail return to original speed
Search traffic follows Zipf distribution, so caching only top popular queries can achieve 80%+ hit rate.
80% cache hit rate = 80% reduction in search CPU load = below cascade failure threshold.
Implementation Verification
Code Change Diff
/actuator/caches Response
Note: External (Nginx) path returns 403 Forbidden — verify directly via localhost:8080 on the app server
Cache Hit/Miss Response Time Comparison
| API | 1st (Cache Miss) | 2nd (Cache Hit) | Improvement |
|---|---|---|---|
Search (q=South Korea) | 107.9ms | 3.1ms | 34x |
Autocomplete (prefix=South) | 4.2ms | 2.9ms | 1.4x |
Search shows dramatic improvement because Lucene BM25 + 3 DocValues reads are entirely skipped.
Autocomplete shows smaller improvement since Lucene PrefixQuery is already fast, but the cache effect is significant under CPU saturation in load testing.
Cache-Control Header Verification
The autocomplete API response includes Cache-Control: max-age=300, stale-while-revalidate=60 header, allowing the browser to cache for 5 minutes and return the previous response for 60 seconds after expiry while refreshing in the background.
After (Post-Cache Measurement)
After completing the caching implementation, we re-measured under the same conditions as Before.
Measurement: 2026-03-14 19:20~19:40 KST
Test environment: Same as Before (ARM 2-core / 12GB RAM)
k6 profile: load (100 VU, 20min)
K6_INFLUXDB_PUSH_INTERVAL=10s k6 run --out influxdb=http://localhost:8086/k6 \ -e PROFILE=load -e BASE_URL=https://api.studywithtymee.com \ /home/rocky/k6/baseline-load-test.jsInfluxDB write load caused k6 Grafana dashboard data loss (InfluxDB 128MB memory limit).
Comparison uses k6 console results + Prometheus-based server Grafana.
k6 Console Results
| Scenario | Avg | P95 |
|---|---|---|
| Overall | 53.83ms | 228.58ms |
| Search (all) | 74.41ms | 424.55ms |
| Search (rare tokens 10%) | 24.52ms | 99.05ms |
| Search (medium-freq tokens 60%) | 36.93ms | 203.54ms |
| Search (high-freq tokens 30%) | 162.65ms | 937.95ms |
| Autocomplete | 4.67ms | 12.15ms |
| Latest post list | 11.07ms | 33.66ms |
| Detail view | 19.51ms | 74.02ms |
| Write (create+like) | 25.02ms | 87.65ms |
| Item | Value |
|---|---|
| Total requests | 41,858 |
| Error rate | 0.00% |
Server Grafana (After)
Spring Boot:
| Metric | Value |
|---|---|
| App CPU | 20~40% (Before: 80~100%) |
| JVM Threads | 30~40 (Before: 100+) |
| JVM Heap | Max 1 GiB, usage stable |
| GC Pause | ~1ms |
| HikariCP Active | ~1~2 |
| HikariCP Pending | 0 (Before: ~50) |
| HikariCP Acquire Time | ~0.1~0.2ms (Before: ~1.5s) |
Caffeine Cache:
| Metric | Value |
|---|---|
| searchResults hit rate | 81.8% |
| autocomplete hit rate | 99.9% |
| postDetail hit rate | 40.5% |
| Cache Size (max) | ~4K entries |
| Evictions | searchResults ~4 ops/s (TTL 5min expiry) |
MySQL:
| Metric | Value |
|---|---|
| QPS | Peak ~200 ops/s |
| Connections | ~1~2 (Before: ~30) |
| InnoDB Buffer Pool Hit Rate | 99.9% |
| Slow Queries (cumulative) | 15.1K |
| Table Locks | 0 |
Host:
| Metric | Value |
|---|---|
| CPU Usage | Peak ~40% (Before: ~40%) |
| Load Average (1m) | Peak ~6 (Before: ~22) |
| Memory Usage | 48.7% / 35.7% / 45.2% |
Before vs After Comparison
k6 Key Metrics Comparison
| Metric | Before (No Cache) | After (Caffeine) | Improvement |
|---|---|---|---|
| Overall Avg | 775.89ms | 53.83ms | 93% (14.4x) |
| Overall P95 | 2,782.67ms | 228.58ms | 92% (12.2x) |
| Search Avg | 1,443.01ms | 74.41ms | 95% (19.4x) |
| Search P95 | 7,001.88ms | 424.55ms | 94% (16.5x) |
| High-freq Search Avg | 2,842.28ms | 162.65ms | 94% (17.5x) |
| High-freq Search P95 | 9,752.19ms | 937.95ms | 90% (10.4x) |
| Autocomplete Avg | 368.18ms | 4.67ms | 99% (78.8x) |
| List Avg | 391.88ms | 11.07ms | 97% (35.4x) |
| Detail Avg | 384.11ms | 19.51ms | 95% (19.7x) |
| Write Avg | 408.94ms | 25.02ms | 94% (16.3x) |
| Total Requests (20min) | 29,867 | 41,858 | +40% |
| Error Rate | 0.00% | 0.00% | Same |
Server Resource Comparison
| Item | Before | After | Change |
|---|---|---|---|
| App CPU | 80~100% saturated | 20~40% | 60%p decrease |
| JVM Threads | 100+ surge | 30~40 | 60% decrease |
| HikariCP Pending | ~50 | 0 | Fully resolved |
| HikariCP Acquire Time | ~1.5s | ~0.1ms | 15,000x |
| Load Average (1m) | ~22 | ~6 | 73% decrease |
| MySQL QPS | ~150 | ~200 | See explanation below |
| MySQL Connections | ~30 | ~1~2 | 93% decrease |
Why MySQL QPS increased from 150 to 200: Caching resolved CPU contention, increasing total throughput from 29,867 to 41,858 requests (+40%). The absolute number of cache-miss requests + write requests (create/like) increased, so QPS also increased. Per-request DB access decreased due to cache hits, but the overall throughput increase offset this. The cumulative Slow Queries (8.34K → 15.1K) has the same cause.
Cache Effect Summary
| Item | Value |
|---|---|
| Cache hit rate (searchResults) | 81.8% |
| Cache hit rate (autocomplete) | 99.9% |
| Cache hit rate (postDetail) | 40.5% |
Why postDetail hit rate is 40.5%: The k6 load test queries random postIds from 14.77M records, so cache re-hit probability is low. In actual operation, traffic concentrates on popular posts following Zipf distribution, so the hit rate is expected to be much higher.
Cascade Failure Resolution
The cascade failure where CPU saturation from search caused all unrelated APIs (autocomplete, list, detail) to slow down in the Before scenario was completely resolved.
| Scenario | Before (cascade) | After (cache) | Original Speed (smoke 5VU) |
|---|---|---|---|
| Autocomplete | 368ms | 4.67ms | 5ms |
| Latest list | 392ms | 11.07ms | 8.5ms |
| Detail view | 384ms | 19.51ms | 12.5ms |
Once cache eliminated search CPU load, autocomplete/list/detail returned to nearly the same speed as smoke testing (5 VU). This is the real effect of caching — not only the directly cached APIs, but by resolving CPU contention, all APIs regained their original performance.
OOM Safety Verification
Caffeine operates within the JVM heap, so if the cache consumes too much heap, the server can die from OOM. Safety was verified with actual measurements during load testing (100 VU, 20min).
| Item | Configured Limit | Measured Under Load | Verdict |
|---|---|---|---|
| searchResults entry count | 10,000 | ~4,000 | 40% of limit, adequate headroom |
| autocomplete entry count | 10,000 | Hundreds | Sufficient |
| postDetail entry count | 50,000 | Hundreds | Sufficient |
| JVM Heap usage | Max 1 GiB | Stable under load (normal Eden + Old Gen fluctuation) | No OOM risk |
| Evictions (searchResults) | - | ~4 ops/s | Normal eviction from 5min TTL expiry |
The reason searchResults entry count stabilized at ~4,000: With a 5min TTL, only unique queries received within 5 minutes accumulate, and older entries expire naturally. The TTL triggers before reaching maximumSize(10,000), naturally managing memory.
The fact that evictions are occurring in the Evictions graph is evidence that the cache is properly discarding old entries, and since the eviction rate isn’t spiking, maximumSize is appropriately configured.
Evidence: Grafana Caffeine Cache panel + JVM Heap panel
Known Limitations and Caveats
Cache Consistency
Introducing cache can cause data inconsistency between DB and cache. The DB has the latest value but the cache still holds the old value, causing users to see stale data.
For example, if a product price is changed from $100 to $80 and committed to DB, but the cache still holds the old data ($100), users still see $100. If they proceed to checkout and the price differs, user trust is lost.
Cache invalidation is the most troublesome problem in practice. Short TTL means frequent cache misses that don’t reduce DB load; long TTL means users see stale data for extended periods. There’s no perfect answer — the developer must judge the appropriate level based on the nature of the data. This is why domain knowledge is necessary.
| Data Nature | TTL Strategy | Reason |
|---|---|---|
| Rarely changes, stale is acceptable | Long TTL (10~30min) | Autocomplete, category lists, etc. |
| Must reflect changes immediately | Immediate invalidation (@CacheEvict) | Post detail, product price, user profile |
| Changes frequently, accuracy critical | Don’t cache | Inventory count, real-time balance |
| Changes frequently, approximation OK | Short TTL (1~5min) | Search results, popularity rankings |
Decisions in this project:
- Search results cache (TTL 5min): Previous results may be returned for up to 5 minutes after a post update. Acceptable for community search (even Google search takes time for index updates)
- Post detail cache (immediate invalidation):
@CacheEvictimmediately removes cache on update/delete. Users must see updated content immediately - Autocomplete cache (TTL 10min): New posts may not appear in autocomplete for 10 minutes. Autocomplete is a “suggestion,” so immediate reflection isn’t essential
Cache Stampede
When TTL expires simultaneously, massive requests flood the DB. (Detailed explanation in Section 4 above)
Local Cache and OOM (Out of Memory)
Caffeine is a local cache operating within JVM heap memory. If cache entries consume too much heap, GC pressure increases, and in the worst case, the server dies from OOM. Unlike Redis (external process), the app and cache share the same memory, so as cache grows, the app’s available memory shrinks.
Defenses in this project:
| Setting | Value | Effect |
|---|---|---|
maximumSize | searchResults 10K, autocomplete 10K, postDetail 50K | Entry count limit prevents unbounded growth |
| JVM Heap | -Xmx1g | Fixed total heap size |
| Estimated cache memory | ~100~200MB (10~20% of total heap) | Remaining 80% for app logic |
Without maximumSize, popular search terms would accumulate and consume the heap. Search result cache stores Page<Post> objects (entity lists) entirely, so per-entry size is large. Caffeine’s W-TinyLFU eviction policy removes the lowest-value entries when maximumSize is exceeded.
In monitoring, cache_size (current entry count) and cache_evictions_total (eviction count) should be observed together. Frequent evictions mean maximumSize is too small; if cache_size is far below maximumSize, memory is being wasted.
Cold Start
When the server restarts, Caffeine cache is empty, so all requests hit the DB directly. Deploying during high-traffic periods can cause a temporary DB load spike.
Mitigation strategies:
- Warm-up script to pre-fill cache with popular search terms after deployment
- Blue-Green deployment for gradual traffic shifting
Items Reviewed But Not Applied
| Item | Conclusion | Reason |
|---|---|---|
| Redis Distributed Cache (L2) | Deferred to future phase | Currently single server, Caffeine alone is sufficient. Introduce when scaling to multiple servers |
| CDN (CloudFront) | Separate phase | CDN requires infrastructure setup, decide after measuring caching effectiveness |
| Probabilistic Early Recomputation | Decide after load testing | Apply if Stampede is actually observed |
| Post list caching | SKIP | Latest post list requires real-time freshness; community nature means high write frequency, requiring extremely short TTL making ROI low |
References
- Caffeine GitHub Wiki
- Baeldung — Spring Boot Caffeine Caching
- NaverPay — Do You Know the Taste of Caffeine?
- KakaoPay — Using Local Cache in Distributed Systems
- Olive Young — Optimizing Large-Scale Promotions with Local Cache and Redis
- Channel.io — Distributed Cache Introduction: Reducing RDB Queries by 90%
- AWS — Database Caching Strategies Using Redis
- AWS Database Blog — RDS + ElastiCache Benchmark
- Redis — Why Your Cache Hit Ratio Strategy Needs an Update
- Kakao Tech — Evolution of KakaoTalk Caching System
- Redis Customer Case Study — Kicker

댓글
댓글 수정/삭제는 GitHub Discussions에서 가능합니다.