Redis L2 캐시 + 자동완성 flat KV: Trie 퇴역과 Stateless 전환
목차
이전 글
stress 테스트로 단일 서버 한계 확인에서 200 VU stress 테스트로 CPU 100% 포화를 확인하고, JVM/Tomcat 튜닝이 CPU-bound 병목에서 역효과를 냄을 기록했습니다.
이 글에서는 분산 전환의 첫 단계로 Redis L2 캐시를 도입하고, Trie 자동완성을 Redis flat KV로 교체하여 앱을 Stateless로 만듭니다.
이전 글 요약
| 글 | 핵심 수치 | 결론 |
|---|---|---|
| 캐싱 전략 | 전체 응답 776ms→54ms (14x) | Caffeine L1 캐시 도입 |
| Trie 자동완성 | 사전순→인기순, “삼ㅅ”→“삼성전자” | 검색 로그 기반 자동완성 |
| stress 테스트 | 200 VU → CPU 100%, P95 1,413ms | 단일 서버 한계 ~100-150 VU |
stress 테스트에서 확인한 핵심 병목:
| 지표 | 100 VU | 200 VU | 판단 |
|---|---|---|---|
| CPU | ~40% | 100% 포화 | 근본 병목 |
| P95 | ~400ms | 1,413ms | SLA(300ms) 위반 |
| HikariCP Acquire | 0.05ms | 1,250ms | CPU 포화의 증상 |
JVM/Tomcat 튜닝(스레드 200→100)은 79% 악화로 역효과. CPU-bound 병목에서 튜닝은 한계가 있으며, 분산 전환이 필요하다는 결론.
개요
분산 전환 3단계: 왜 Redis가 먼저인가
“CPU가 병목이니 서버를 늘리자”로 곧장 가지 않고, 인프라 준비 → 앱 확장 순서(Bottom-Up)로 진행합니다.

앱 스케일아웃을 먼저 하면 생기는 문제:
| 문제 | 증상 |
|---|---|
| Redis 없이 앱 3대 | Caffeine이 인스턴스별 독립 → 히트율 급락 → Lucene 검색 폭증 → CPU 더 포화 |
| Replication 없이 앱 3대 | HikariCP 커넥션 3배(20×3=60). 단일 MySQL이 감당 못함 |
| TokenBlacklist 미공유 | 인스턴스 A에서 로그아웃 → B에서 여전히 접속 가능 (보안 결함) |
핵심 개념, Stateless 전환: 앱이 내부에 상태(Caffeine 캐시, Trie, TokenBlacklist)를 들고 있으면 Stateful → 스케일아웃 시 상태 불일치. Redis로 상태를 외부화하면 Stateless → 인스턴스 자유롭게 추가/제거 가능.
CPU 포화의 근본 원인
Caffeine 캐시 히트율 96% → 4% 미스최대 TPS ~110 req/s × 4% 미스 = 초당 ~4~5건의 Lucene BM25 검색→ ARM 2코어에서 BM25 + DocValues 정렬이 CPU 집약적이므로 초당 4~5건만으로도 CPU 포화Redis L2 캐시를 도입하면:
- 다중 인스턴스 캐시 공유: Caffeine은 인스턴스별 독립. Redis는 공유 캐시이므로 히트율 유지
- 자동완성 flat KV: Trie DFS 제거, O(1) GET, CPU 부하 감소
- Origin 도달률 감소: L1 + L2 2계층으로 DB/Lucene 접근 확률 감소
이 단계의 목표
| # | 내용 |
|---|---|
| 1 | Caffeine(L1) + Redis(L2) 2계층 캐시 구현 |
| 2 | 자동완성: Trie → Redis flat KV 전환 |
| 3 | 직렬화 최적화 (Jackson JSON) |
| 4 | load 테스트로 Before/After 비교 |
인프라 구성: 서버 2대 체제 전환
stress 테스트까지는 단일 서버에서 모든 것을 처리했습니다. 이 글부터 Oracle Cloud 추가 인스턴스를 생성하여 서버 2대 체제로 전환합니다.

서버 스펙
| 서버 | 스펙 | 상태 |
|---|---|---|
| 서버 1 (app1) | Oracle Cloud ARM Ampere A1, 2코어, 12GB RAM | 운영 중 |
| 서버 2 (app2) | Oracle Cloud ARM Ampere A1, 2코어, 12GB RAM | 신규 생성 |
| 모니터링 | Oracle Cloud VM, 1GB RAM | 운영 중 |
서버 1과 동일한 스펙(ARM 2코어, 12GB RAM)으로 서버 2를 구성합니다. 동일 스펙 2대 체제로 로드밸런싱 시 균등한 부하 분산이 가능합니다.
단계별 서버 활용 계획
| 단계 | 서버 1 변경 | 서버 2 변경 |
|---|---|---|
| Redis L2 캐시 (이 글) | Redis 컨테이너 추가 | 변경 없음 (OS + Docker 준비만) |
| MySQL Replication (다음 글) | MySQL → Primary 설정 | MySQL Replica 구성 |
| App 스케일아웃 | Nginx 로드밸런서 추가 | App2 + Lucene 인덱스 배포 |
왜 Redis인가: Memcached와의 비교
분산 캐시의 양대 선택지는 Redis와 Memcached입니다.
| 기준 | Redis | Memcached | 판단 |
|---|---|---|---|
| 데이터 구조 | String, Hash, Set, Sorted Set 등 | String만 | TokenBlacklist(Set), 조회수 버퍼(Hash) 등 다양한 구조 필요 |
| 영속성 | RDB 스냅샷 / AOF 로그 | 없음 | prefix_topk 유실 시 최대 1시간 자동완성 불능. RDB 복원 필요 |
| Pub/Sub | 내장 | 없음 | 스케일아웃 시 L1 캐시 무효화 전파에 필요 |
| 실행 모델 | 커맨드 직렬 처리 (원자적 보장) | 멀티스레드 | TokenBlacklist INCR 등 원자적 연산에 유리 |
| 메모리 효율 | 오버헤드 있음 | slab allocator로 효율적 | 캐시 데이터 ~31MB → 차이 무의미 |
Memcached가 더 적합한 경우: 순수 캐시만 필요하고, 수백GB 규모의 단순 key-value를 멀티스레드로 처리해야 할 때.
이 프로젝트에서 Redis가 필수인 이유:
- 자동완성 데이터 영속성: prefix_topk는 매시간 배치로 생성되므로 유실 시 최대 1시간 자동완성 불능
- TokenBlacklist: JWT 로그아웃을 위한 블랙리스트를 다중 인스턴스가 공유해야 함 (Set + TTL)
- Pub/Sub 캐시 무효화: 스케일아웃 시 인스턴스 A의 게시글 수정 → Pub/Sub → 인스턴스 B/C의 L1 캐시 무효화
- 후속 활용: CDC 이벤트, 조회수 Redis INCR 등 캐시 이상의 역할
Redis 도입 비용 분석: “Redis 없이 해결할 수 없었는가?”
Redis를 추가하기 전에, 기존 인프라 튜닝만으로 해결할 수 없는지 4가지 대안을 검토했습니다:
| 대안 | 검토 결과 | 판단 |
|---|---|---|
| InnoDB Buffer Pool 증가 (2G→4G) | Buffer Pool 히트율이 이미 100%. DB I/O가 병목이 아님 | 탈락 |
| Caffeine 캐시 사이즈 증가 | 4% 미스는 “새로운 검색어(cold query)“임. 사이즈 2배로 해도 cold query는 여전히 미스. 스케일아웃 시 인스턴스별 독립 | 탈락 |
| JVM 힙 증가 (1g→2g) | Heap 사용량 256MB/1GB로 여유 충분. CPU가 병목이므로 메모리 추가는 효과 없음. OS 페이지 캐시(Lucene MMap용)가 줄어 역효과 | 탈락 |
| 스케일 업 (2코어→4코어) | 현재 인스턴스 스펙(ARM 2코어/12GB)이 상한. 스펙 변경 시 인스턴스 재생성 필요 | 탈락 |
고정 자원 내 배분 비용
서버가 ARM 2코어, 12GB RAM으로 고정되어 있으므로 인프라 비용은 “12GB 안에서 Redis에 300MB를 할당하면 다른 곳이 300MB 줄어드는” 자원 배분 문제입니다.

Redis 도입의 자원 비용: Redis 컨테이너: +300MB (maxmemory 256MB + freelist/클라이언트 버퍼 오버헤드 ~20%) OS 페이지 캐시 감소: -200MB (~5G → ~4.8G) Lucene 인덱스 20GB 중 페이지 캐시 커버율: 25% → 24% (-1%) 영속성 비용: AOF 미사용 (캐시 데이터이므로 유실 허용, 최대 30초 조회수 유실) RDB 스냅샷도 미사용 (재시작 시 origin에서 재로딩)
Redis 도입의 이득: L2 캐시 히트 시 Lucene 검색 회피 → CPU 부하 감소 자동완성 Trie(~66MB JVM 힙) 제거 → 힙 여유 확보 TokenBlacklist 공유 → 스케일아웃 전제조건 충족
판단: 페이지 캐시 1% 감소 < L2 캐시 + Trie 힙 절약 + 스케일아웃 준비 → Redis 300MB 투자 가치 있음Redis 장애 시 데이터 유실 범위: AOF/RDB를 모두 미사용하므로 Redis 재시작 시 모든 캐시 데이터가 유실된다. L2 캐시와 자동완성 KV는 origin(MySQL/Lucene)에서 재로딩되고, 조회수는 최대 30초(flush 주기) 분량만 유실된다. 토큰 블랙리스트는 JWT 만료시간(24h) 내 데이터이므로, Redis 재시작 시 로그아웃된 토큰이 만료 전까지 다시 유효해질 수 있다. 이 보안 트레이드오프는 Redis 샤딩에서 전용 인스턴스 분리로 blast radius를 축소했다.
AWS 환경에서의 비용 비교 참고: ElastiCache(t3.micro 기준 월 ~3만원)를 추가하고, DB 부하 감소분만큼 RDS를 다운스케일(예: db.r6g.large → medium, 월 ~13만원 절감)하면 총 인프라 비용이 줄어드는지가 도입 근거가 됩니다. 관리형 서비스 여부와 관계없이 자원 배분 트레이드오프 분석은 동일한 사고 과정입니다.
1. L1(Caffeine) + L2(Redis) 2계층 캐시
아키텍처 변경

캐시 계층별 특성
| 계층 | 저장소 | 응답시간 | 용량 | 스케일아웃 시 |
|---|---|---|---|---|
| L1 | Caffeine (JVM 힙) | ~0.1ms | 제한적 | 인스턴스마다 별도 |
| L2 | Redis (네트워크) | ~1-5ms | 수 GB | 전체 인스턴스 공유 |
| Origin | MySQL/Lucene | ~50-200ms | 무제한 | - |
왜 Redis로 “교체”가 아닌 “추가”인가
Redis만 쓰면 모든 요청에 네트워크 비용(~1-5ms)이 발생합니다. Caffeine(L1)이 있으면 같은 인스턴스에서 반복 요청 시 0.1ms에 반환됩니다. L1으로 네트워크 비용을 절약하고, L2로 인스턴스 간 일관성을 확보하는 구조입니다.
왜 Spring @Cacheable이 아닌 직접 구현인가
Spring Cache Abstraction(@Cacheable + CacheManager)은 단일 계층 캐시를 전제로 설계되어 있습니다.
| 방법 | 문제 |
|---|---|
CompositeCacheManager | 조회 순서 제어와 “L2 히트 시 L1에 승격” 로직을 미지원 |
@Caching(cacheable = {L1, L2}) | 두 캐시를 동시에 조회하는 게 아니라 각각 독립 실행 |
| 서드파티 라이브러리 | 의존성 추가 + 커스텀 로직 제약 |
따라서 TieredCacheService를 직접 구현하여 L1 → L2 → Origin 조회 순서와 양방향 저장을 제어합니다.
TieredCacheService 구현
@Componentpublic class TieredCacheService {
private final Cache<String, Object> localCache; // L1: Caffeine private final RedisTemplate<String, String> redisTemplate; // L2: Redis private final JsonMapper jsonMapper; // Jackson 3 private final MeterRegistry meterRegistry;
public <T> T get(String cacheRegion, String key, Class<T> type, Supplier<T> loader) { // 1. L1 확인 Object cached = localCache.getIfPresent(key); if (cached != null && type.isInstance(cached)) { meterRegistry.counter("tiered_cache", "region", cacheRegion, "level", "L1").increment(); return type.cast(cached); }
// 2. L2 확인 (Redis 장애 시 스킵) try { String json = redisTemplate.opsForValue().get(key); if (json != null) { T value = jsonMapper.readValue(json, type); localCache.put(key, value); // L1에 승격 meterRegistry.counter("tiered_cache", "region", cacheRegion, "level", "L2").increment(); return value; } } catch (RedisConnectionFailureException | RedisCommandTimeoutException e) { log.warn("Redis L2 조회 실패, fallback: {}", e.getMessage()); }
// 3. Origin 조회 T value = loader.get();
// 4. L1 + L2 양쪽에 저장 localCache.put(key, value); try { redisTemplate.opsForValue().set(key, jsonMapper.writeValueAsString(value), Duration.ofMinutes(10)); } catch (RedisConnectionFailureException e) { log.warn("Redis L2 저장 실패, L1에만 캐싱: {}", e.getMessage()); }
meterRegistry.counter("tiered_cache", "region", cacheRegion, "level", "origin").increment(); return value; }}설계 포인트:
RedisTemplate<String, String>+JsonMapper로 직렬화/역직렬화를 직접 제어- Java 제네릭은 런타임에 타입이 소거(type erasure)되므로
Class<T>파라미터로 타입 정보를 명시적으로 전달 - Redis 장애 시 try-catch로 L2를 스킵하고 L1 + Origin으로 fallback
cacheRegion태그로searchResults,postDetail등 용도별 히트율 계측
L1-L2 캐시 일관성 전략
2계층 캐시에서는 L1에 stale 데이터가 남는 문제가 구조적으로 발생합니다:
시나리오: 게시글 수정 시 1. 사용자가 post:123 수정 → DB 업데이트 2. Redis(L2)에서 post:123 삭제 3. 같은 인스턴스의 L1에서도 evict → 즉시 반영 ✓ 4. 다른 인스턴스의 L1에는 여전히 옛날 데이터 ✗ → L1 TTL(5분) 만료까지 stale 데이터 서빙무효화 전략 (단계별):
| 단계 | 전략 | stale 윈도우 |
|---|---|---|
| 현재 (단일 인스턴스) | L1 evict + L2 삭제 | 없음 |
| 스케일아웃 후 (멀티 인스턴스) | Redis Pub/Sub 브로드캐스트 + L1 TTL 보완 | ~수 ms (Pub/Sub) ~ 최대 5분 (TTL 만료) |
Pub/Sub의 한계(at-most-once 전송): Redis Pub/Sub은 fire-and-forget 방식입니다. 구독자가 일시적으로 연결이 끊기면 그 사이의 메시지는 영원히 유실됩니다.
| 대안 | 장점 | 단점 | 판단 |
|---|---|---|---|
| Redis Streams | at-least-once 보장 | Consumer Group + ACK 관리 복잡 | 캐시 무효화 목적 대비 복잡도 과다 |
| Kafka | 완벽한 메시지 보장 | 별도 브로커 인프라 필요, 현재 서버 자원으로 운영 부담 | 탈락 |
| Pub/Sub + L1 TTL | 구현 간단. 유실 시 L1 TTL(5분)이 안전망 | 최악 5분 stale | 선택 |
커뮤니티 게시판에서 검색 결과가 최대 5분 지연되는 것은 UX에 큰 영향이 없으므로, best-effort 무효화 + TTL 안전망 전략을 채택했습니다.
Redis 장애 시 Graceful Degradation
핵심 원칙: Redis 장애가 서비스 장애로 이어지면 안 됩니다. Redis는 “있으면 빨라지는 것”이지, “없으면 안 되는 것”이 아닙니다.
정상 상태: 요청 → L1(Caffeine) → L2(Redis) → Lucene/MySQL
Redis 장애 시: 요청 → L1(Caffeine) → L2(Redis) ✗ 타임아웃 ↓ try-catch로 L2 스킵 Lucene/MySQL 직접 조회 ↓ L1에만 저장자동완성은 예외입니다. prefix_topk 데이터가 Redis에만 있으므로, Redis 장애 시 Lucene PrefixQuery fallback으로 자동 전환됩니다. Trie를 퇴역시키되 Lucene PrefixQuery를 fallback으로 유지한 이유가 여기에 있습니다.
2. 자동완성 flat KV: Trie 퇴역
Trie의 한계 (Trie 자동완성에서 확인)
| 문제 | 설명 |
|---|---|
| 메모리 | 자모 분해 포함 3만 건 = ~196MB. 스케일아웃 시 인스턴스마다 중복 |
| 스케일아웃 불가 | 인스턴스별 Trie 독립 → 검색 로그 동기화 불가 |
| DFS 비용 | 짧은 prefix(1~2글자)에서 분기 폭발 |
접두사별 추천 결과를 미리 준비하는 구조로 전환
Trie (이전): "삼성" 검색 → Trie DFS → 하위 노드 순회 → Top-K 정렬 → 반환
Redis flat KV (이 글): "삼성" 검색 → Redis GET "prefix:삼성" → ["삼성전자","삼성물산","삼성SDI"] → O(1), DFS 없음, CPU 부하 없음Trie는 검색 품질 문제를 해결하는 데는 유효했지만, 조회 시마다 탐색과 정렬 비용이 따라오는 구조였습니다. 그래서 이 단계에서는 입력마다 후보를 다시 계산하기보다, 접두사마다 상위 추천 결과를 미리 만들어두고 요청 시 바로 반환하는 구조가 더 적합하다고 판단했습니다. 이렇게 하면 조회 경로는 훨씬 단순해지고, 여러 인스턴스가 같은 결과를 공유하기도 쉬워집니다.
접두사별 추천 결과를 주기적으로 집계
자동완성 결과는 약간 늦게 반영되어도 괜찮기 때문에, 모든 입력을 실시간으로 처리하기보다 일정 주기로 모아 집계하는 방식을 택했습니다. 사용자가 입력한 검색어를 먼저 누적한 뒤, 최근 데이터를 기준으로 접두사별 상위 추천 결과를 다시 계산하고, 조회 시에는 이미 정렬된 결과를 바로 반환하는 흐름입니다.
구현은 단일 서버에서 SQL + Java 조합으로 처리합니다:
@Scheduled(cron = "0 0 * * * *") // 매시간public void buildPrefixTopK() { // 1. SQL GROUP BY로 인기 검색어 Top-N 추출 List<Object[]> topQueries = searchLogRepository .findTopQueriesSince(LocalDateTime.now().minusDays(7), 10000);
// 2. 각 검색어를 모든 prefix로 분해 Map<String, PriorityQueue<ScoredQuery>> prefixMap = new HashMap<>(); for (Object[] row : topQueries) { String query = (String) row[0]; long count = ((Number) row[1]).longValue(); for (int len = 1; len <= Math.min(query.length(), 10); len++) { String prefix = query.substring(0, len); prefixMap.computeIfAbsent(prefix, k -> new PriorityQueue<>( Comparator.comparingLong(ScoredQuery::score))) .offer(new ScoredQuery(query, count)); if (prefixMap.get(prefix).size() > 10) { prefixMap.get(prefix).poll(); // Top-10 유지 } } }
// 3. 새 버전 네임스페이스에 적재 long newVersion = System.currentTimeMillis(); prefixMap.forEach((prefix, heap) -> { List<String> topK = heap.stream() .sorted(Comparator.comparingLong(ScoredQuery::score).reversed()) .map(ScoredQuery::query).toList(); redisTemplate.opsForValue().set( "prefix:v" + newVersion + ":" + prefix, toJson(topK), Duration.ofHours(2)); });
// 4. 버전 포인터 원자적 전환 redisTemplate.opsForValue().set("prefix:current_version", String.valueOf(newVersion));}왜 RENAME이 아닌 버전 네임스페이스 전환인가

| 방법 | 장점 | 단점 | 판단 |
|---|---|---|---|
| RENAME 반복 | 구현 간단 | 5,000개 키를 하나씩 RENAME → 중간 실패 시 불일치 | 탈락 |
| Redis Pipeline | 네트워크 절감 | 서버에서 여전히 개별 실행. 원자적이지 않음 | 탈락 |
| Lua Script | 원자적 실행 | 5,000개 키 처리 시 Redis 싱글스레드 블로킹 | 탈락 |
| 버전 네임스페이스 | 새 데이터 별도 적재 후 포인터(단일 키)만 원자적 전환 | 이전 버전 TTL까지 메모리 차지 | 선택 |
이전 버전 키가 TTL 만료까지 메모리를 차지하지만, prefix_topk 전체가 ~1MB이므로 2배(~2MB)여도 무시 가능합니다.
GET 2번 오버헤드 해결: version 값을 Caffeine에 로컬 캐싱(TTL 30초). version은 매시간 배치에서만 변경되므로 30초 캐싱해도 안전합니다. 읽기 경로: Caffeine에서 version 조회(0.1ms) → Redis GET 1번(~1ms).
Redis 메모리 추정
| 항목 | 값 |
|---|---|
| prefix 키 수 | ~5,000개 |
| Key 평균 | ~30 bytes |
| Value 평균 (Top-10 JSON) | ~200 bytes |
| 총 Redis 메모리 | ~1.1MB |
검색 로그가 10배 늘어나도 ~23MB. 단일 Redis로 충분합니다.
3. 직렬화: Jackson JSON 선택
| 방식 | 크기 | 속도 | 가독성 | 의존성 |
|---|---|---|---|---|
| Jackson JSON | 보통 | 보통 | 높음 (redis-cli에서 읽기 가능) | Spring Boot 기본 포함 |
| MessagePack | ~30% 절감 | 빠름 | 없음 (바이너리) | 추가 의존성 |
| Kryo | 가장 작음 | 가장 빠름 | 없음 | 스키마 등록 필요 |
Jackson JSON을 선택한 근거:
캐시 데이터 합계 ~31MB. MessagePack으로 바꿔도 ~22MB (9MB 절감)이고, 이는 Redis maxmemory 256MB 대비 3.5%입니다. 직렬화 속도 차이(~0.5μs)도 네트워크 RTT(~1ms) 대비 무시 가능합니다. redis-cli에서 사람이 읽을 수 있어 디버깅이 훨씬 쉽고, 추가 의존성도 없습니다.
전환 기준: Redis 메모리가 maxmemory의 80%(~200MB)에 도달하면 MessagePack 전환을 검토합니다. 현재 실측 28.4%(~73MB)이므로 전환은 한참 먼 상태입니다.
4. Docker에 Redis 추가
docker-compose.yml
redis: image: redis:7.4-alpine container_name: wiki-redis-prod restart: always volumes: - redis-data:/data command: > redis-server --maxmemory 256mb --maxmemory-policy volatile-lru --requirepass ${REDIS_PASSWORD} --slowlog-log-slower-than 10000 --slowlog-max-len 128 deploy: resources: limits: memory: 300M왜 allkeys-lru가 아닌 volatile-lru인가
allkeys-lru는 메모리 압박 시 모든 키를 LRU 기준으로 퇴거시킵니다. 이 프로젝트에서는 삭제되면 안 되는 키가 있습니다:
| 키 유형 | TTL 설정 | 삭제 시 영향 |
|---|---|---|
| 캐시 (searchResults, postDetail) | 10분 | DB에서 재조회, 허용 가능 |
| prefix_topk (자동완성) | 2시간 | 자동완성 불능, 위험 |
| prefix:current_version | TTL 없음 | 자동완성 전체 불능, 치명적 |
| TokenBlacklist | 토큰 만료 | 로그아웃 무효화, 보안 결함 |
volatile-lru는 TTL이 설정된 키만 퇴거 대상으로 삼습니다. TTL이 없는 prefix:current_version은 절대 퇴거되지 않습니다.
보안: 포트 노출 제거 + 인증
Docker Compose 내부 네트워크에서 앱 컨테이너는 서비스명(redis:6379)으로 접근합니다. 호스트에 6379 포트를 노출하지 않고, requirepass로 비밀번호를 설정합니다.
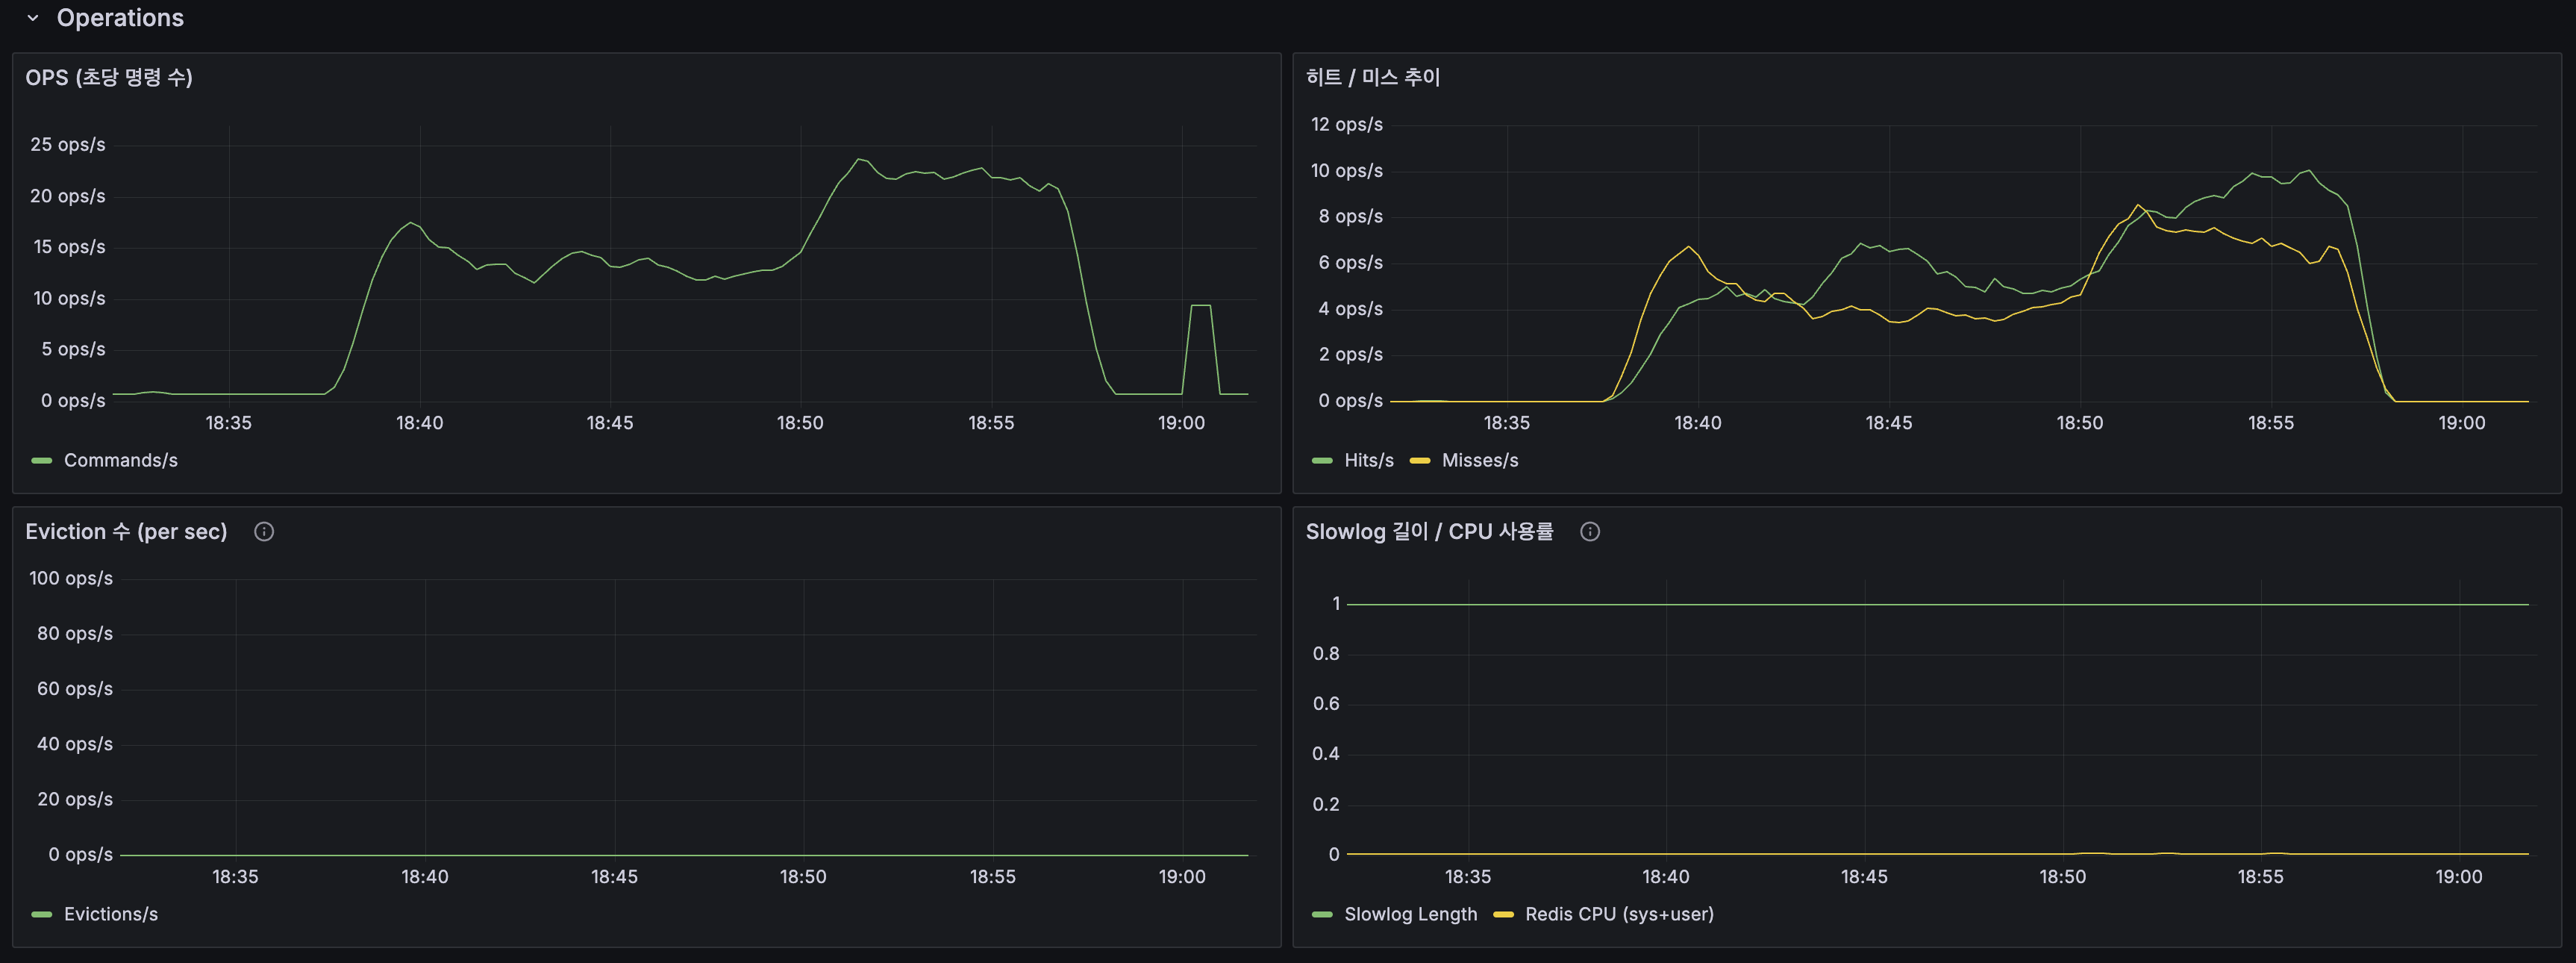
5. Redis 모니터링
Redis Exporter + Grafana 대시보드
| 패널 | 메트릭 | 의미 |
|---|---|---|
| 메모리 사용률 | redis_memory_used / max_bytes | maxmemory 256MB 대비 사용량 |
| L2 캐시 히트율 | keyspace_hits / (hits + misses) | Redis 캐시 활용도 |
| Eviction 수 | redis_evicted_keys_total | TokenBlacklist 안전 감시 |
| OPS | redis_commands_processed_total (rate) | 초당 명령 수 |
| Slowlog | redis_slowlog_length | 10ms 이상 느린 명령 |
Lettuce 클라이언트 레이턴시
Redis Exporter는 서버 측 메트릭입니다. 앱→Redis 네트워크 포함 레이턴시는 Spring Boot 4.0의 LettuceObservationAutoConfiguration으로 자동 계측됩니다.
| 메트릭 | 의미 |
|---|---|
lettuce_seconds_* | 커맨드 전체 완료 시간 (히스토그램) |
lettuce_active_seconds_* | 커맨드 활성(대기) 시간 |
spring-boot-starter-data-redis+spring-boot-starter-actuator만으로 추가 의존성 없이 동작합니다.
L1/L2/Origin 히트율 커스텀 메트릭
기존 Caffeine의 cache_gets_total은 TieredCacheService로 전환하면 동작하지 않으므로, 3계층 비율을 직접 계측합니다:
| Grafana 패널 | PromQL | 의미 |
|---|---|---|
| L1/L2/Origin 비율 | sum by (level) (rate(tiered_cache_total[5m])) | 3계층 히트 분포 |
| Origin 도달률 추이 | rate(tiered_cache_total{level="origin"}[5m]) | CPU 부하와 상관관계 |
Grafana 알림 규칙
| 알림 | 조건 | 심각도 |
|---|---|---|
| Redis 메모리 위험 | 사용률 > 90% (5분) | Critical |
| Eviction 급증 | rate > 10/s | Warning |
| Redis 다운 | up{job="redis"} == 0 (1분) | Critical |
| L2 히트율 급락 | < 50% (10분) | Warning |
Ansible 인프라 변경 사항
수정 파일 목록
| 파일 | 변경 내용 |
|---|---|
inventory.yml | app 그룹에 app2 호스트 추가 |
group_vars/all.yml | redis_password, redis_memory_limit, app2_server_host 추가 (vault 암호화) |
site.yml | 서버 2 기반 세팅 플레이 추가 (docker + firewall만) |
docker-compose.yml.j2 | wiki-redis-prod, wiki-redis-exporter-prod 서비스 추가 |
env.prod.j2 | REDIS_HOST, REDIS_PORT, REDIS_PASSWORD 추가 |
prometheus.yml.j2 | redis scrape job + 서버 2 node-exporter 추가 |
redis.json (신규) | Redis Grafana 대시보드 |
redis-alerts.yml (신규) | Grafana 알림 5개 |
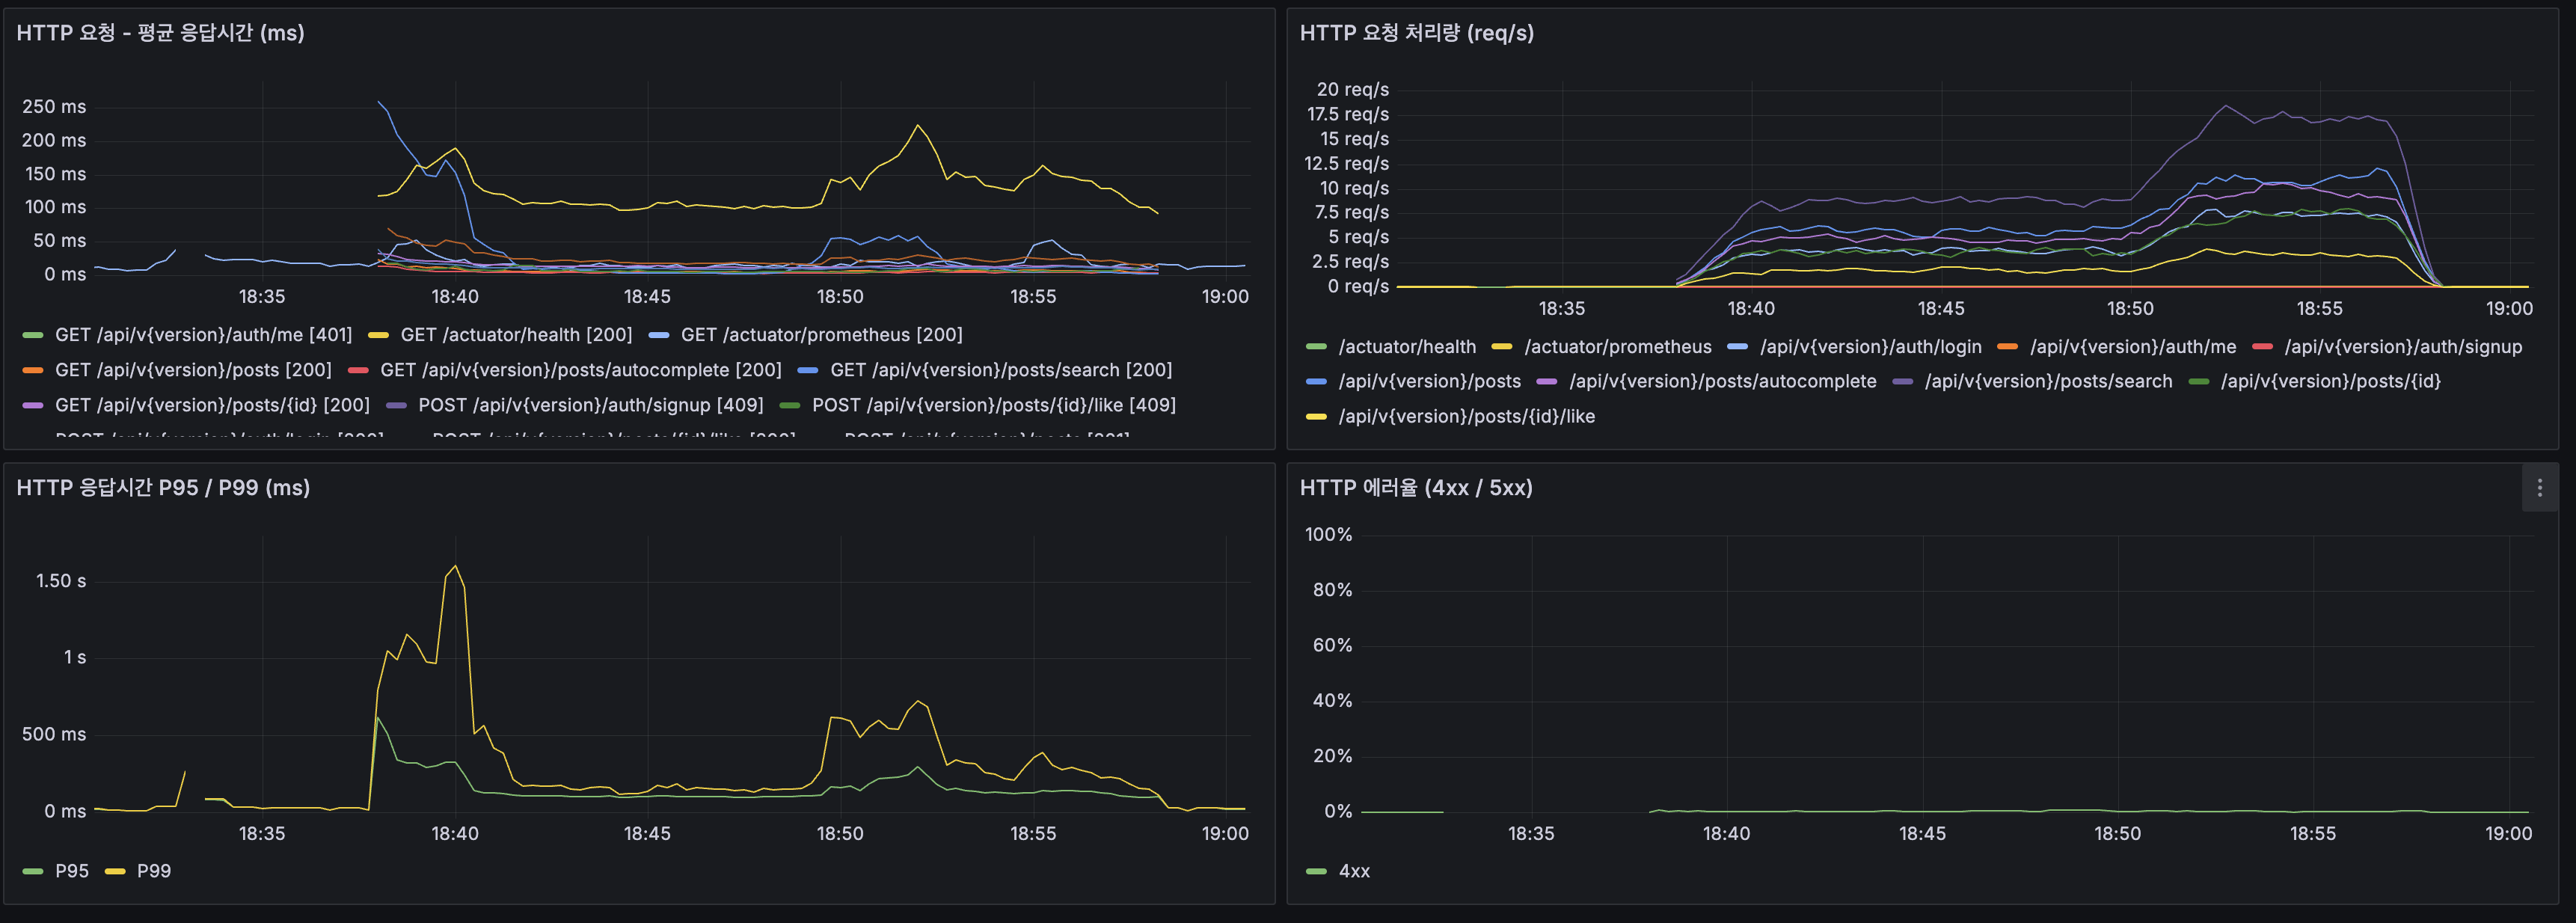
Before 측정 (Redis 도입 전 기준선)
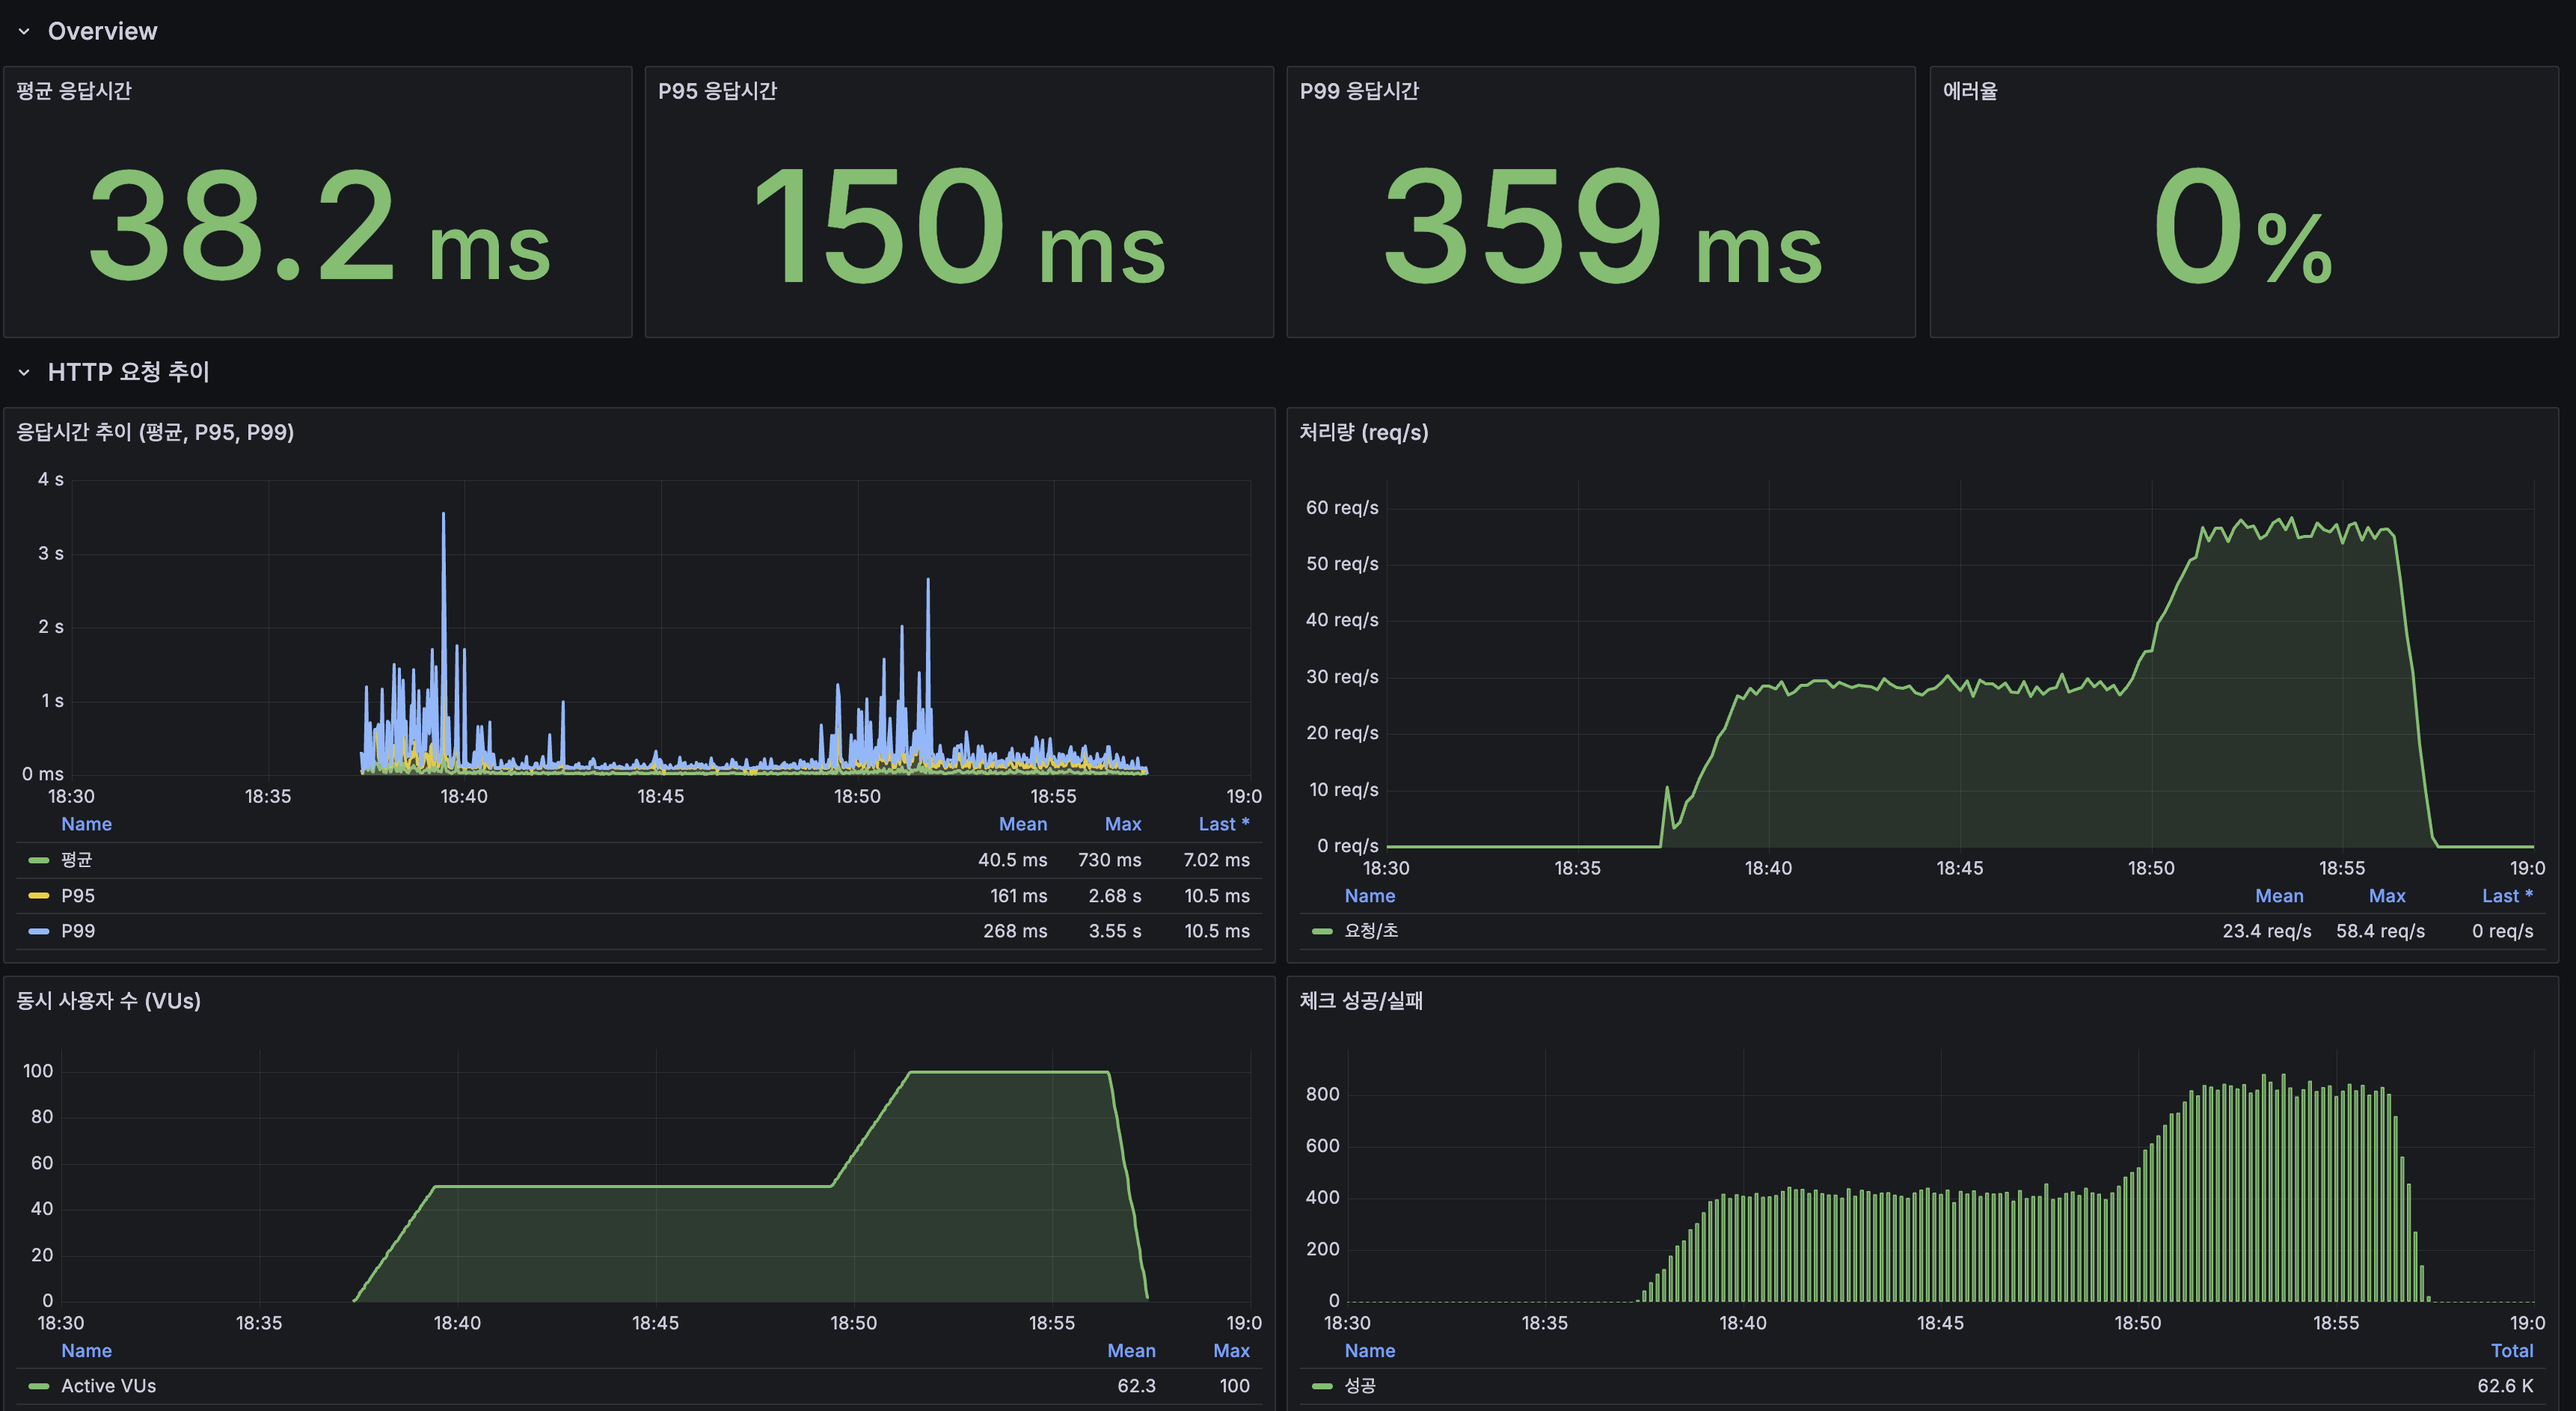
Redis 컨테이너는 떠 있지만 앱 코드는 아직 Caffeine + Trie를 사용하는 상태에서 k6 load 테스트(100 VU, 20분)를 수행합니다.
k6 결과
| 지표 | 값 |
|---|---|
| 평균 응답시간 | 38.2ms |
| P95 | 150ms |
| P99 | 359ms |
| 에러율 | 0% |
| 최대 TPS | 58.4 req/s |
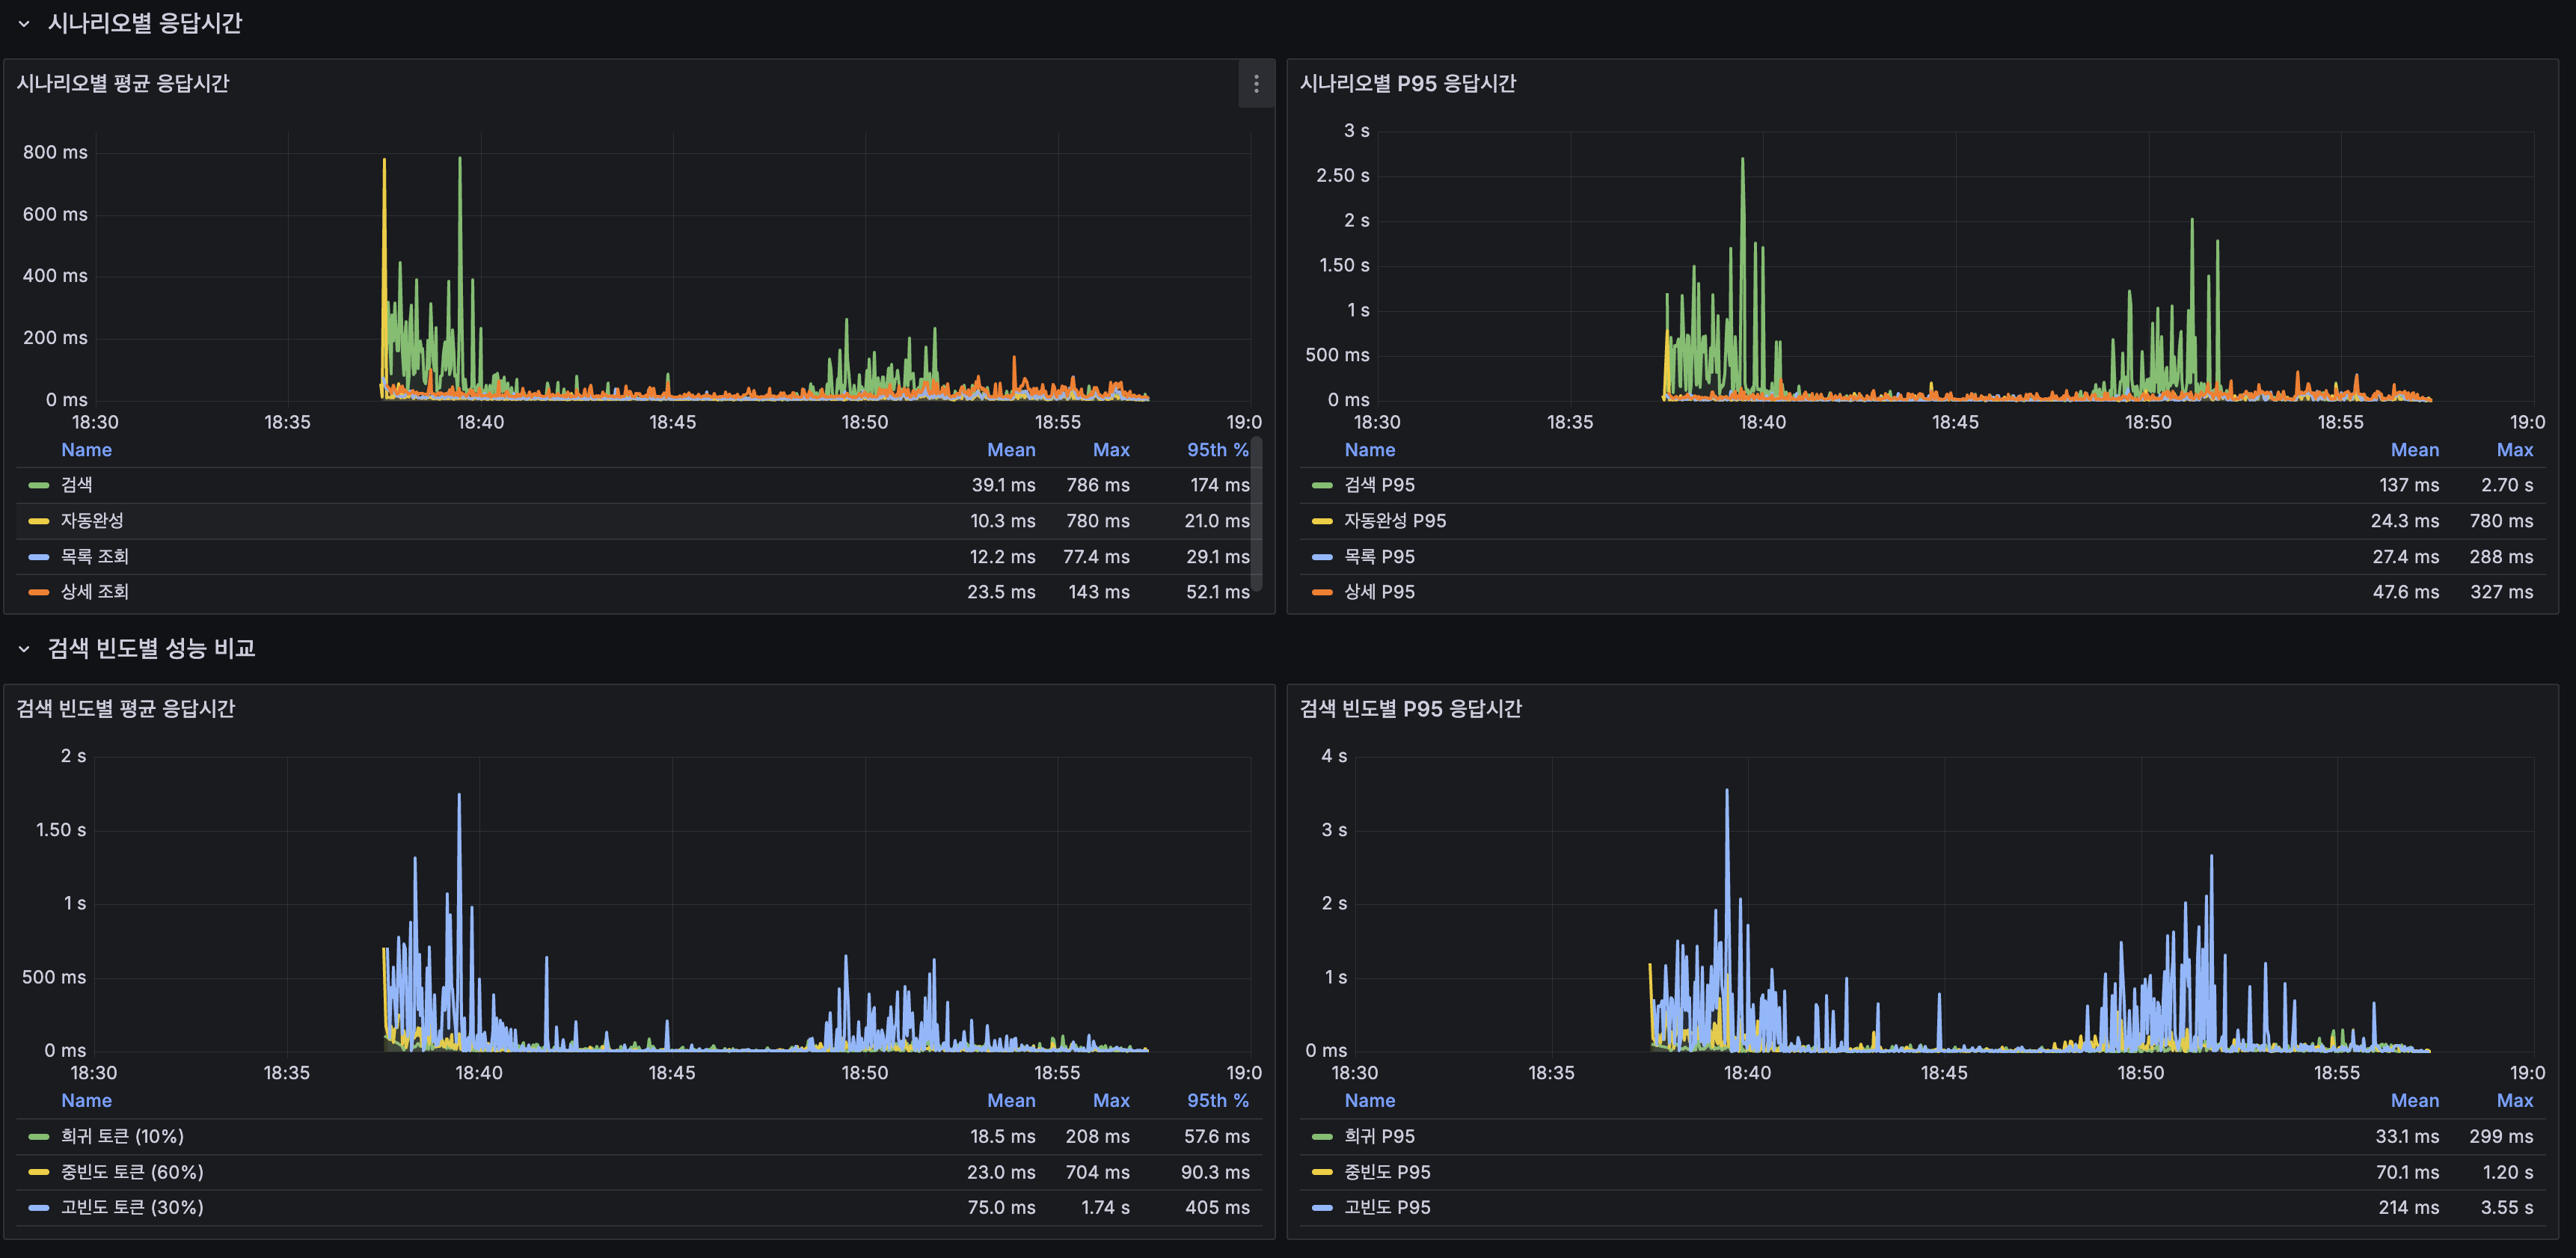
시나리오별 응답시간 + 검색 빈도별 성능
| 시나리오 | 평균 | P95 |
|---|---|---|
| 검색 | 39.1ms | 174ms |
| 자동완성 | 10.3ms | 21.0ms |
| 목록 조회 | 12.2ms | 29.1ms |
| 상세 조회 | 23.5ms | 52.1ms |
| 빈도 | 평균 | P95 |
|---|---|---|
| 희귀 토큰 (10%) | 18.5ms | 57.6ms |
| 중빈도 토큰 (60%) | 23.0ms | 90.3ms |
| 고빈도 토큰 (30%) | 75.0ms | 405ms |
핵심 관측: 고빈도 토큰(“대한민국”, “history” 등)의 평균 75ms, P95 405ms가 전체 응답시간을 끌어올리고 있습니다. posting list가 길어 BM25 점수 계산에 CPU를 많이 소모하기 때문입니다. 이것이 Redis L2 캐시로 Lucene 접근을 줄여야 하는 직접적 근거입니다.
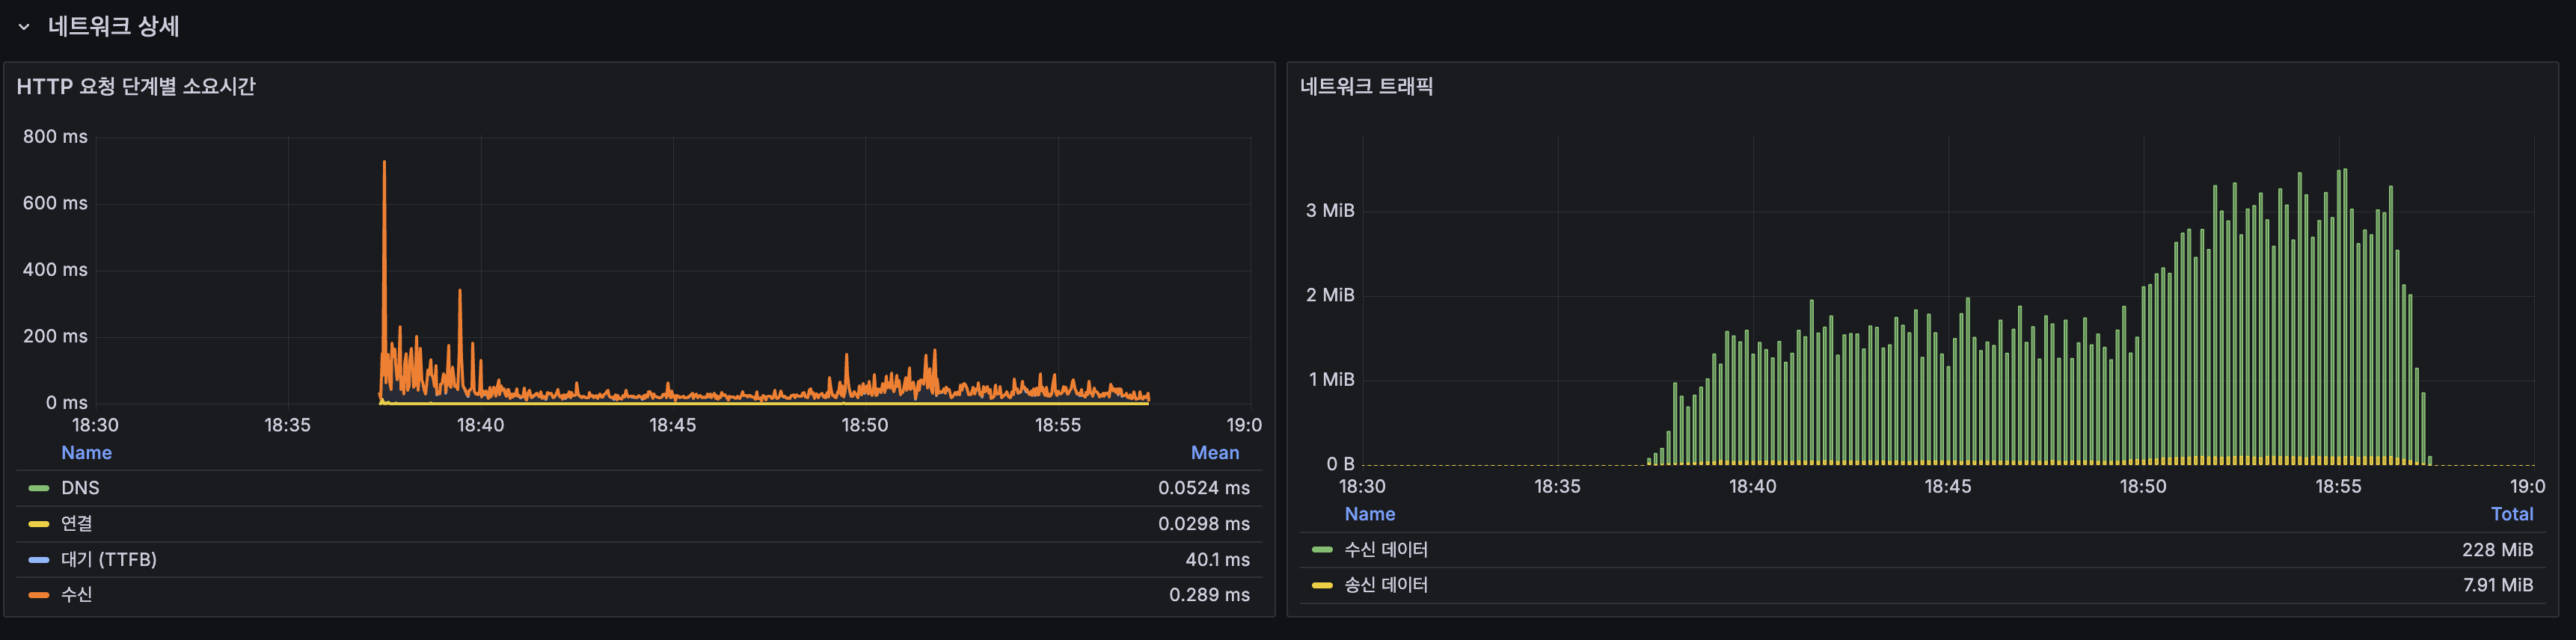
네트워크 상세
| 지표 | 값 |
|---|---|
| DNS | 0.052ms |
| 연결 | 0.030ms |
| 대기 (TTFB) | 40.1ms |
| 수신 데이터 | 228 MiB |
| 송신 데이터 | 7.91 MiB |
시스템 수치
| 지표 | 값 |
|---|---|
| App CPU | ~40-70% |
| Caffeine searchResults 히트율 | 95.2% |
| Caffeine autocomplete 히트율 | 100% |
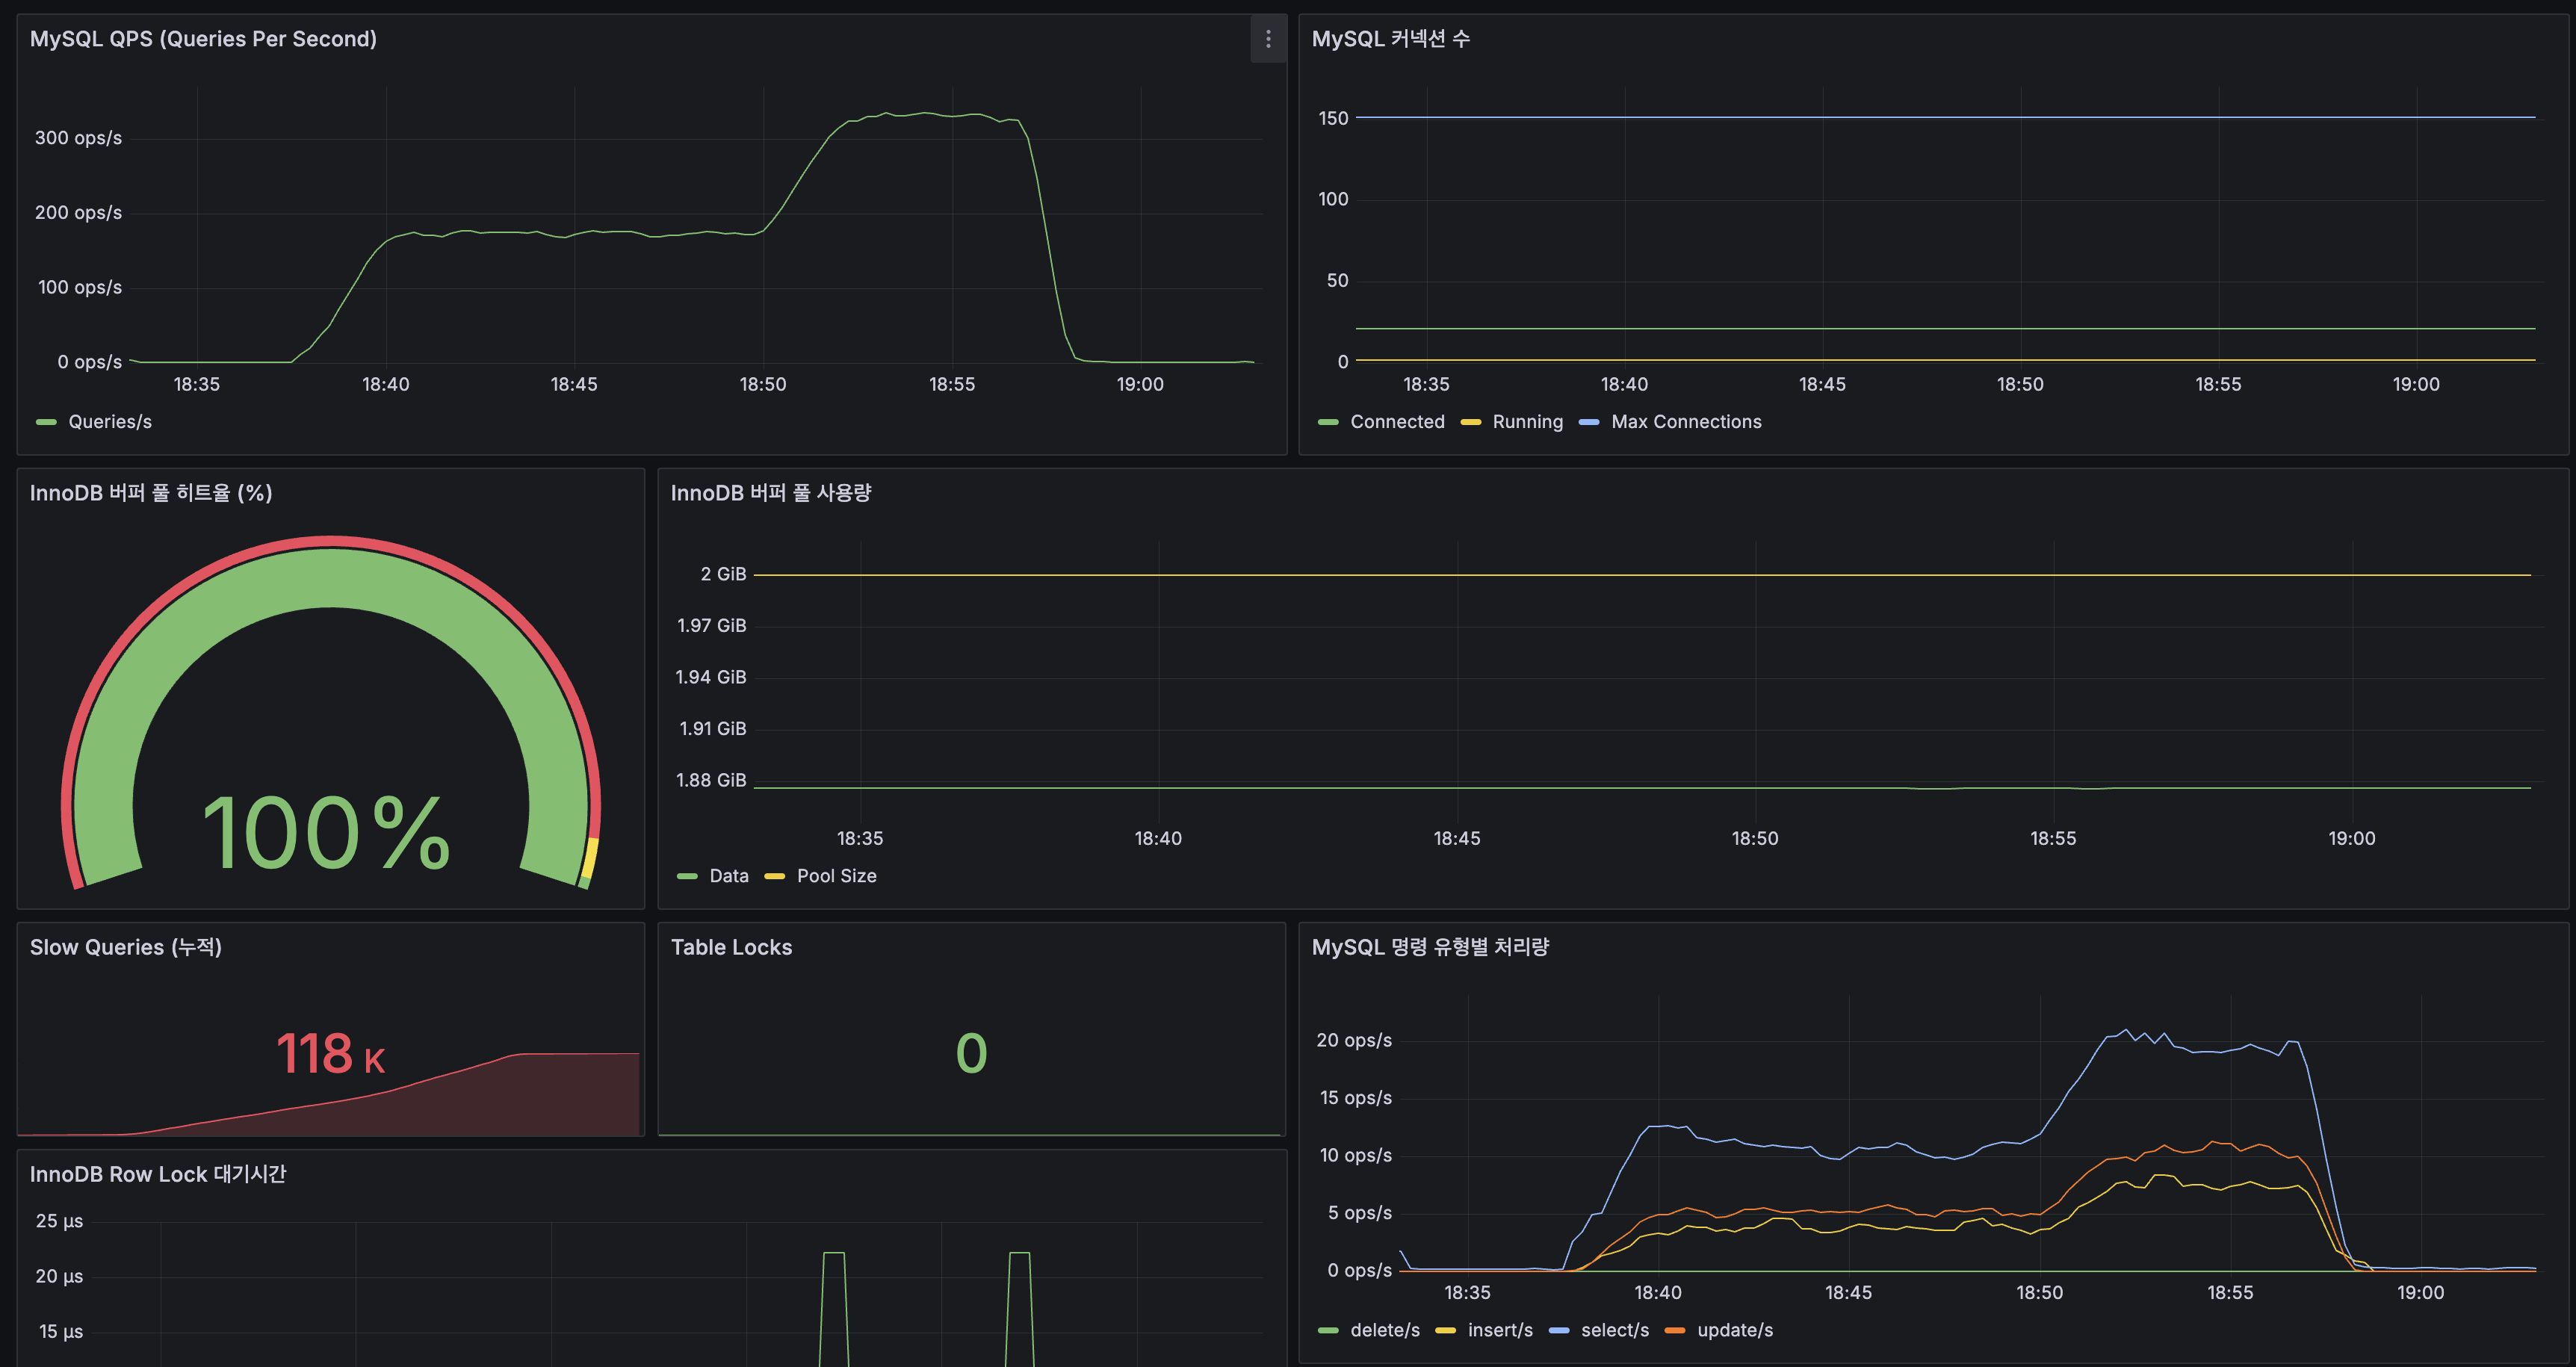
| Caffeine postDetail 히트율 | 55.6% |
| InnoDB Buffer Pool 히트율 | 100% |
핵심 구현: 코드 변경
| # | 작업 | 상태 |
|---|---|---|
| 1 | TieredCacheService (L1 + L2 + fallback + Micrometer) | 완료 |
| 2 | 검색 결과 캐시: @Cacheable → TieredCacheService | 완료 |
| 3 | 게시글 상세 캐시: @Cacheable → TieredCacheService | 완료 |
| 4 | prefix_topk 배치 빌드 + 버전 네임스페이스 | 완료 |
| 5 | 자동완성 API: Trie → Redis flat KV | 완료 |
| 6 | Lucene PrefixQuery fallback | 완료 |
| 7 | Caffeine autocomplete 캐시 제거, TrieInitializer 퇴역 | 완료 |
| 8 | Grafana 대시보드 + 알림 규칙 | 완료 |
주요 코드 변경
| 파일 | 변경 |
|---|---|
PostService.java | @Cacheable/@CacheEvict 제거 → TieredCacheService 직접 호출 |
RedisAutocompleteService.java (신규) | Redis flat KV 자동완성: 배치 빌드 + 버전 네임스페이스 + Lucene fallback |
CachedSearchResult.java (신규) | Slice → JSON 직렬화 문제 해결용 캐시 래퍼 레코드 |
CacheConfig.java | autocomplete Caffeine 캐시 제거 |
TrieInitializer.java | @Scheduled/@EventListener 제거, @Deprecated |
검색 로그 기록 개선: 기존 @Cacheable은 캐시 히트 시 메서드 본문이 실행되지 않아 검색 로그가 누락됐습니다. TieredCacheService로 전환 후 searchLogCollector.record(keyword)를 캐시 밖에 배치하여 모든 검색이 기록되도록 개선했습니다. prefix_topk 인기도 데이터의 정확도가 향상됩니다.
기능 검증 (프로덕션)
| # | 검증 항목 | 결과 |
|---|---|---|
| 1 | 자동완성 API | prefix=삼성 → ["삼성전자","삼성물산","삼성 sdi"], Redis flat KV O(1) |
| 2 | 검색 캐시 | 1회차 origin → 2회차 L1 히트. Redis에 키 생성 확인 |
| 3 | 게시글 상세 캐시 | Redis에 post:571474 캐시 키 생성 |
| 4 | prefix_topk 배치 | 앱 기동 시 자동 빌드: keys=390, 소스 쿼리=42, 833ms |
| 5 | tiered_cache 메트릭 | Prometheus에 L1/L2/origin 카운터 노출 |
| 6 | 컨테이너 전체 healthy | 10개 컨테이너 모두 healthy |
After 실측 + Before 비교
Before(Caffeine + Trie)와 동일 조건(100 VU, 20분)으로 재측정합니다.
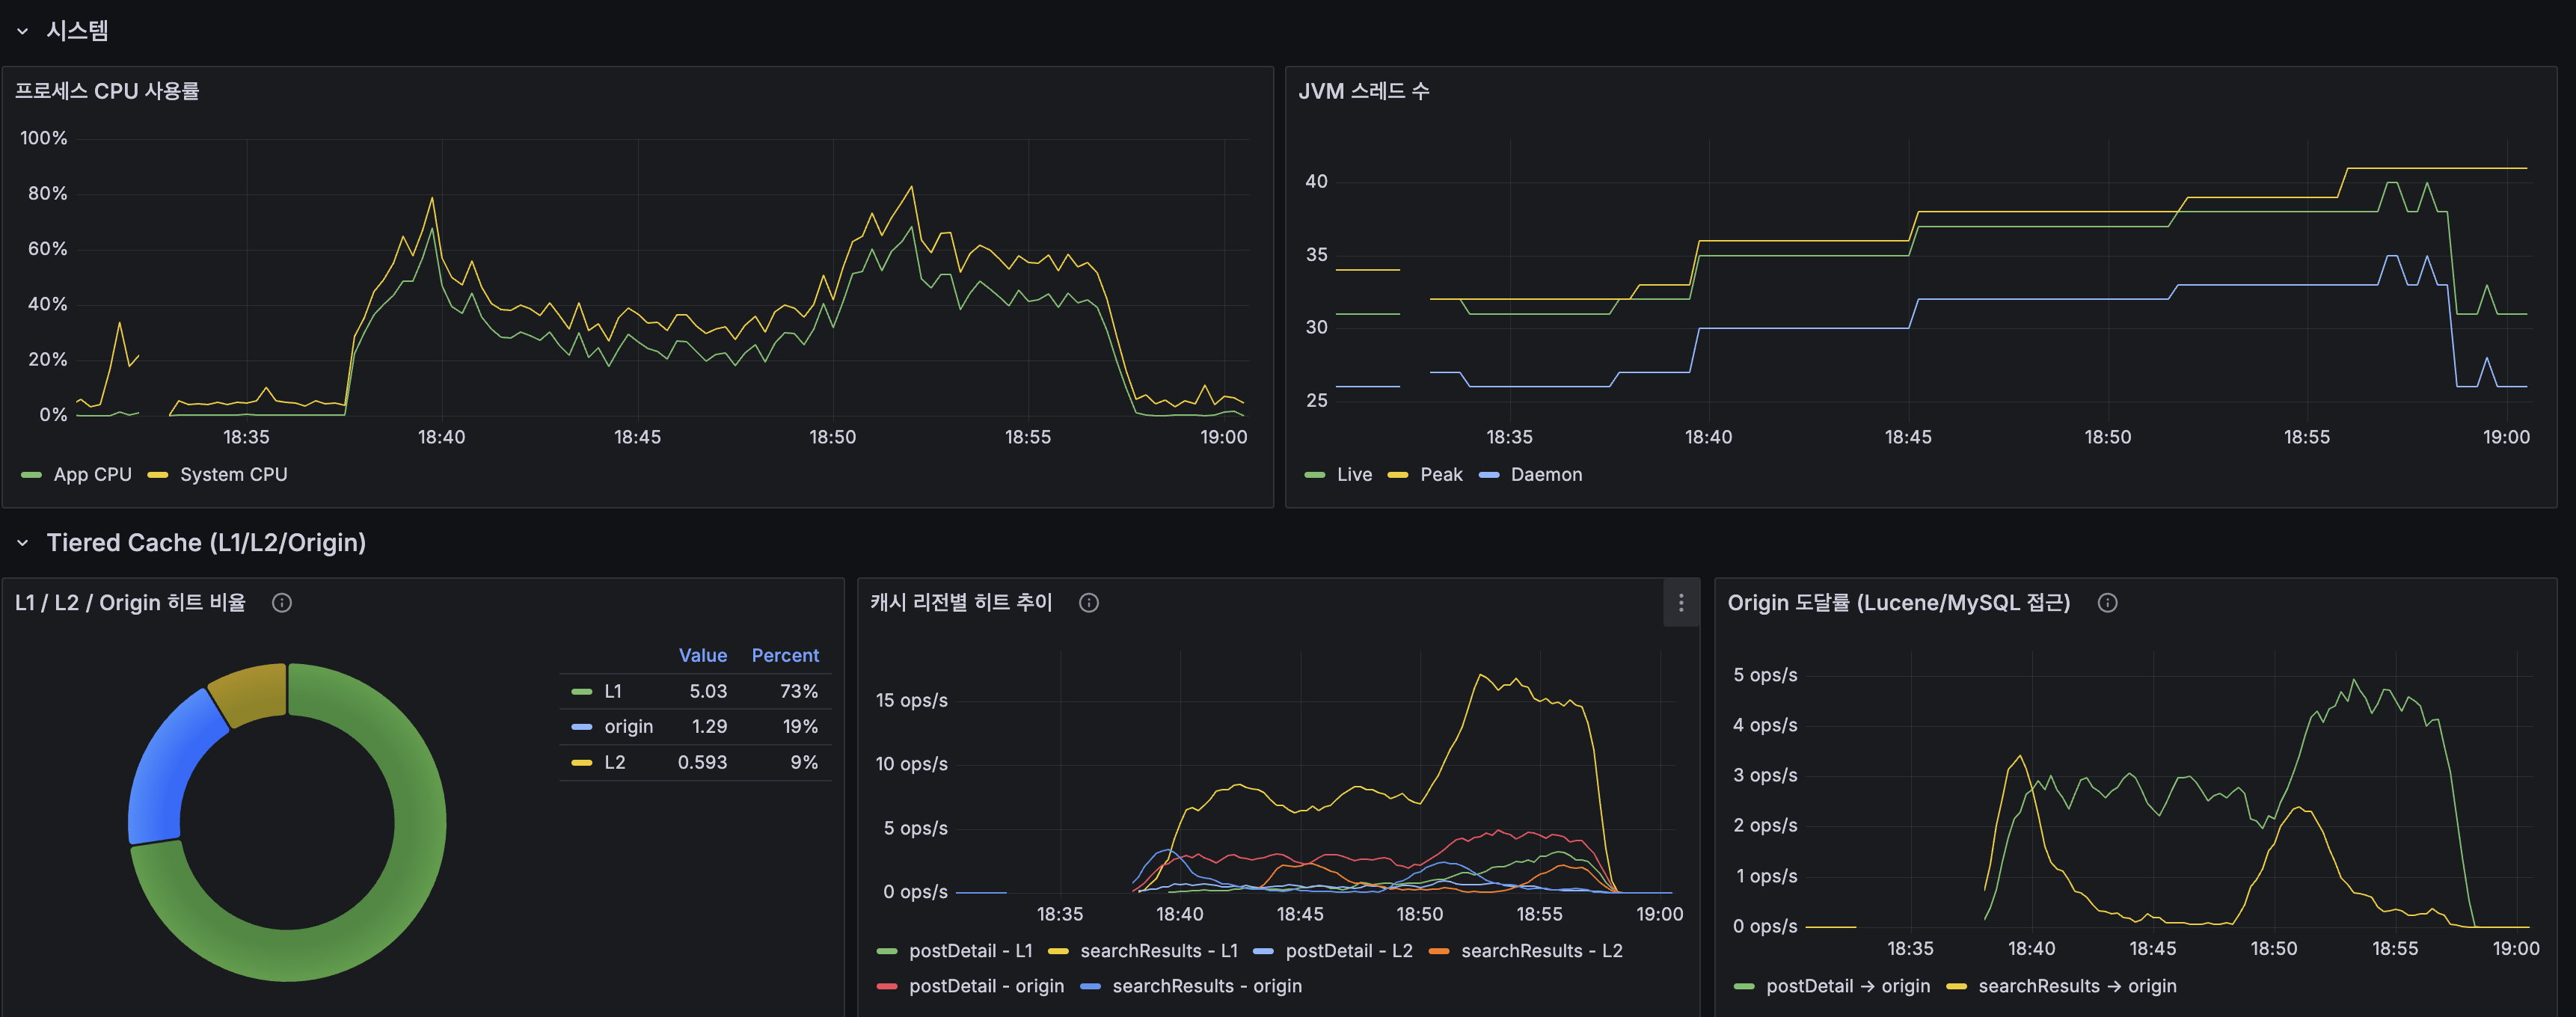
Tiered Cache 히트 분포
| 계층 | 비율 | 의미 |
|---|---|---|
| L1 (Caffeine) | 73% | 같은 인스턴스 반복 → 0.1ms 반환 |
| L2 (Redis) | 9% | L1 미스 시 Redis 서빙 → ~2.5ms |
| Origin | 19% | 캐시 미스 → DB/Lucene 직접 접근 |
L1 + L2 합산 82% 히트 → Origin 도달률 19%로 Lucene/MySQL 접근이 5분의 1로 감소.
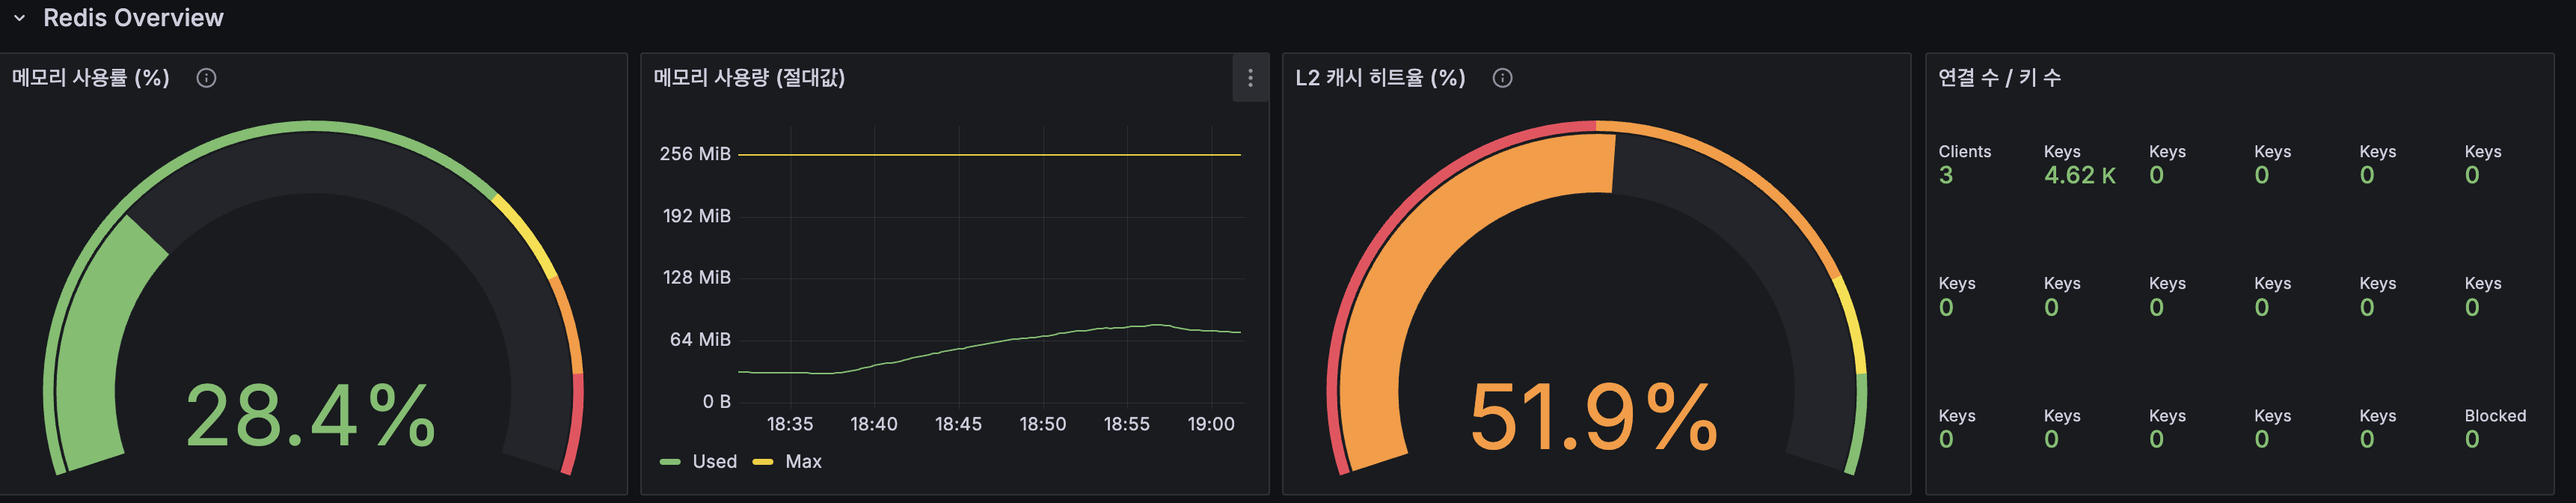
Redis 대시보드
| 지표 | 값 |
|---|---|
| 메모리 사용률 | 28.4% (73MB / 256MB) |
| L2 캐시 히트율 | 51.9% |
| Eviction | 0 ops/s |
| Slowlog | 1 (정상) |
| Keys | 4,620개 |
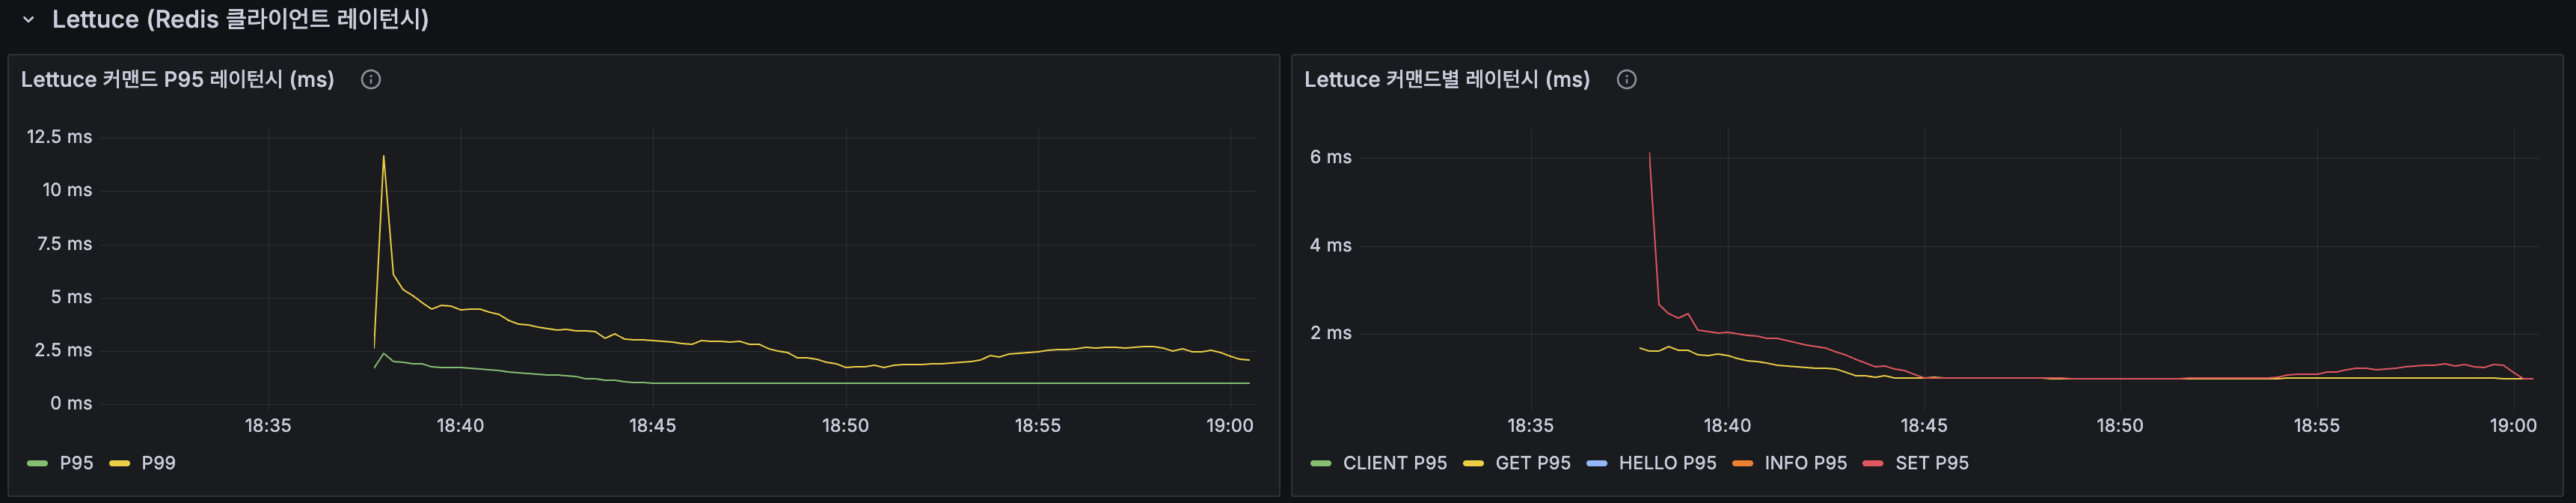
Lettuce 레이턴시
| 지표 | 값 |
|---|---|
| P95 | ~2.5ms (SLA 5ms 달성) |
| P99 | ~2.5ms |
| GET P95 | ~1-2ms |
| SET P95 | ~1-2ms |
Before vs After 종합 비교
| 지표 | Before (Caffeine + Trie) | After (Redis L2 + flat KV) | 변화 |
|---|---|---|---|
| 평균 응답시간 | 38.2ms | ~40ms | 유사 |
| HTTP P95 (안정 구간) | ~150ms | ~200ms | 유사 |
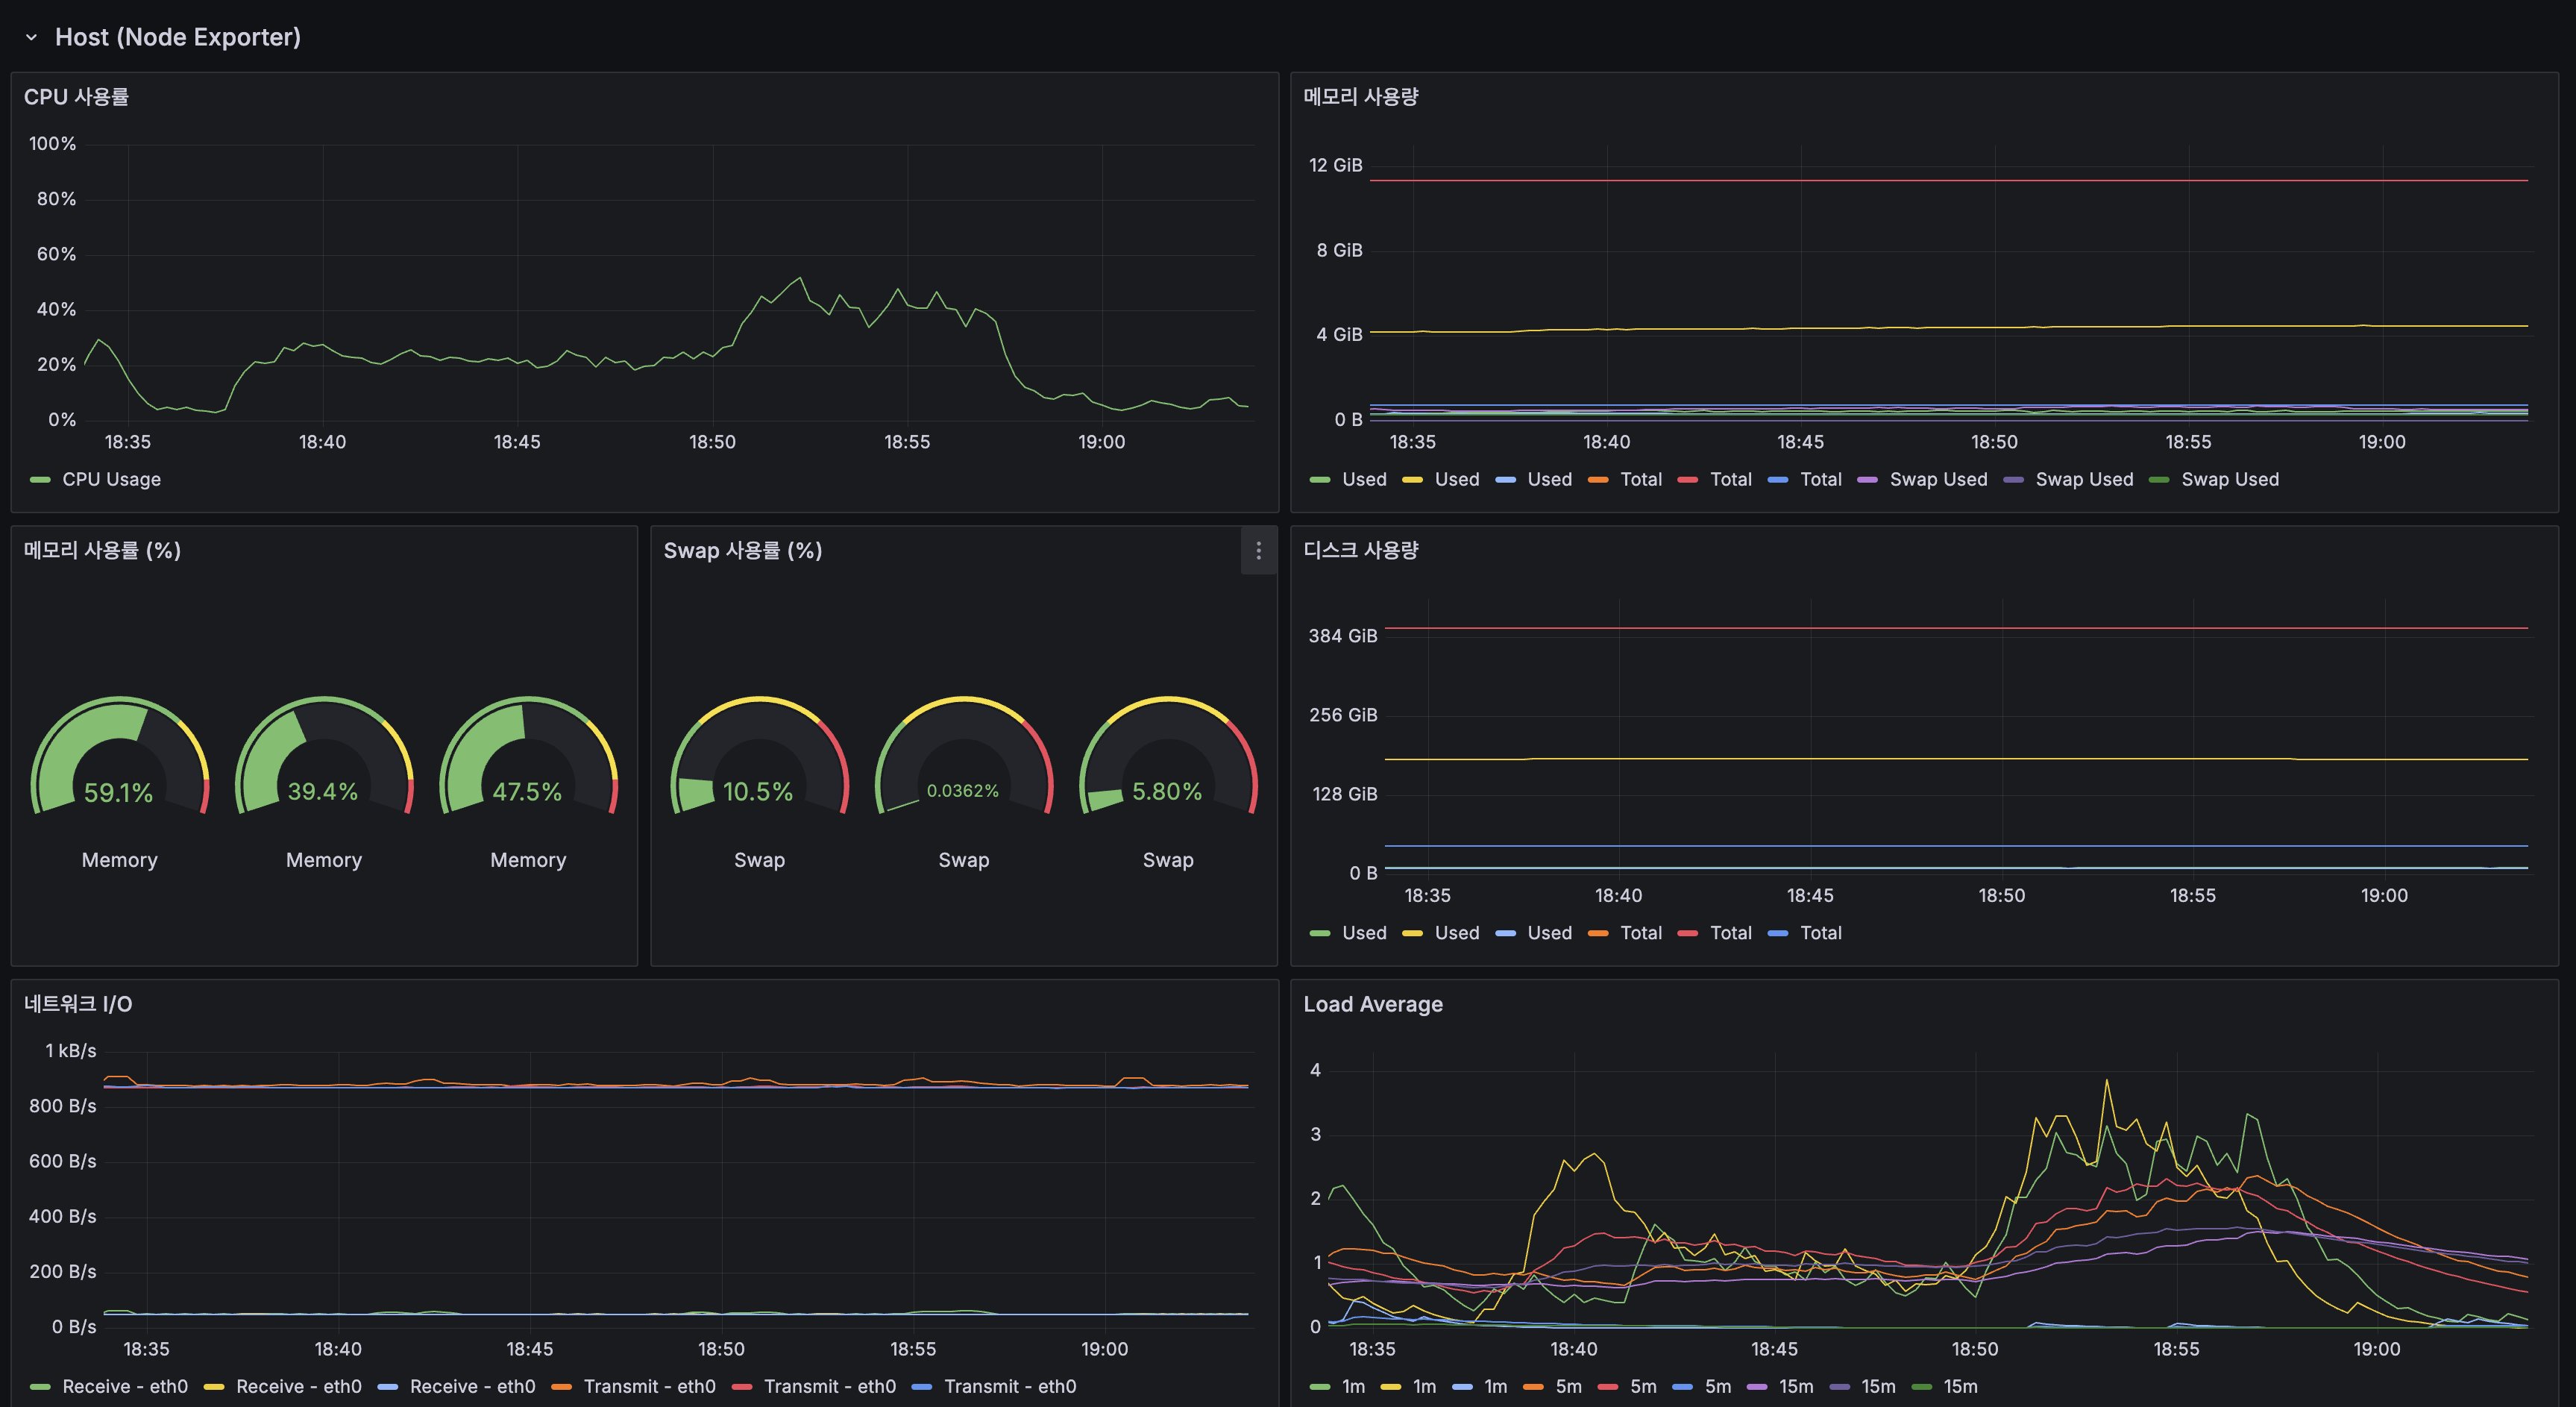
| App CPU | ~40-70% | ~20-80% | 유사 |
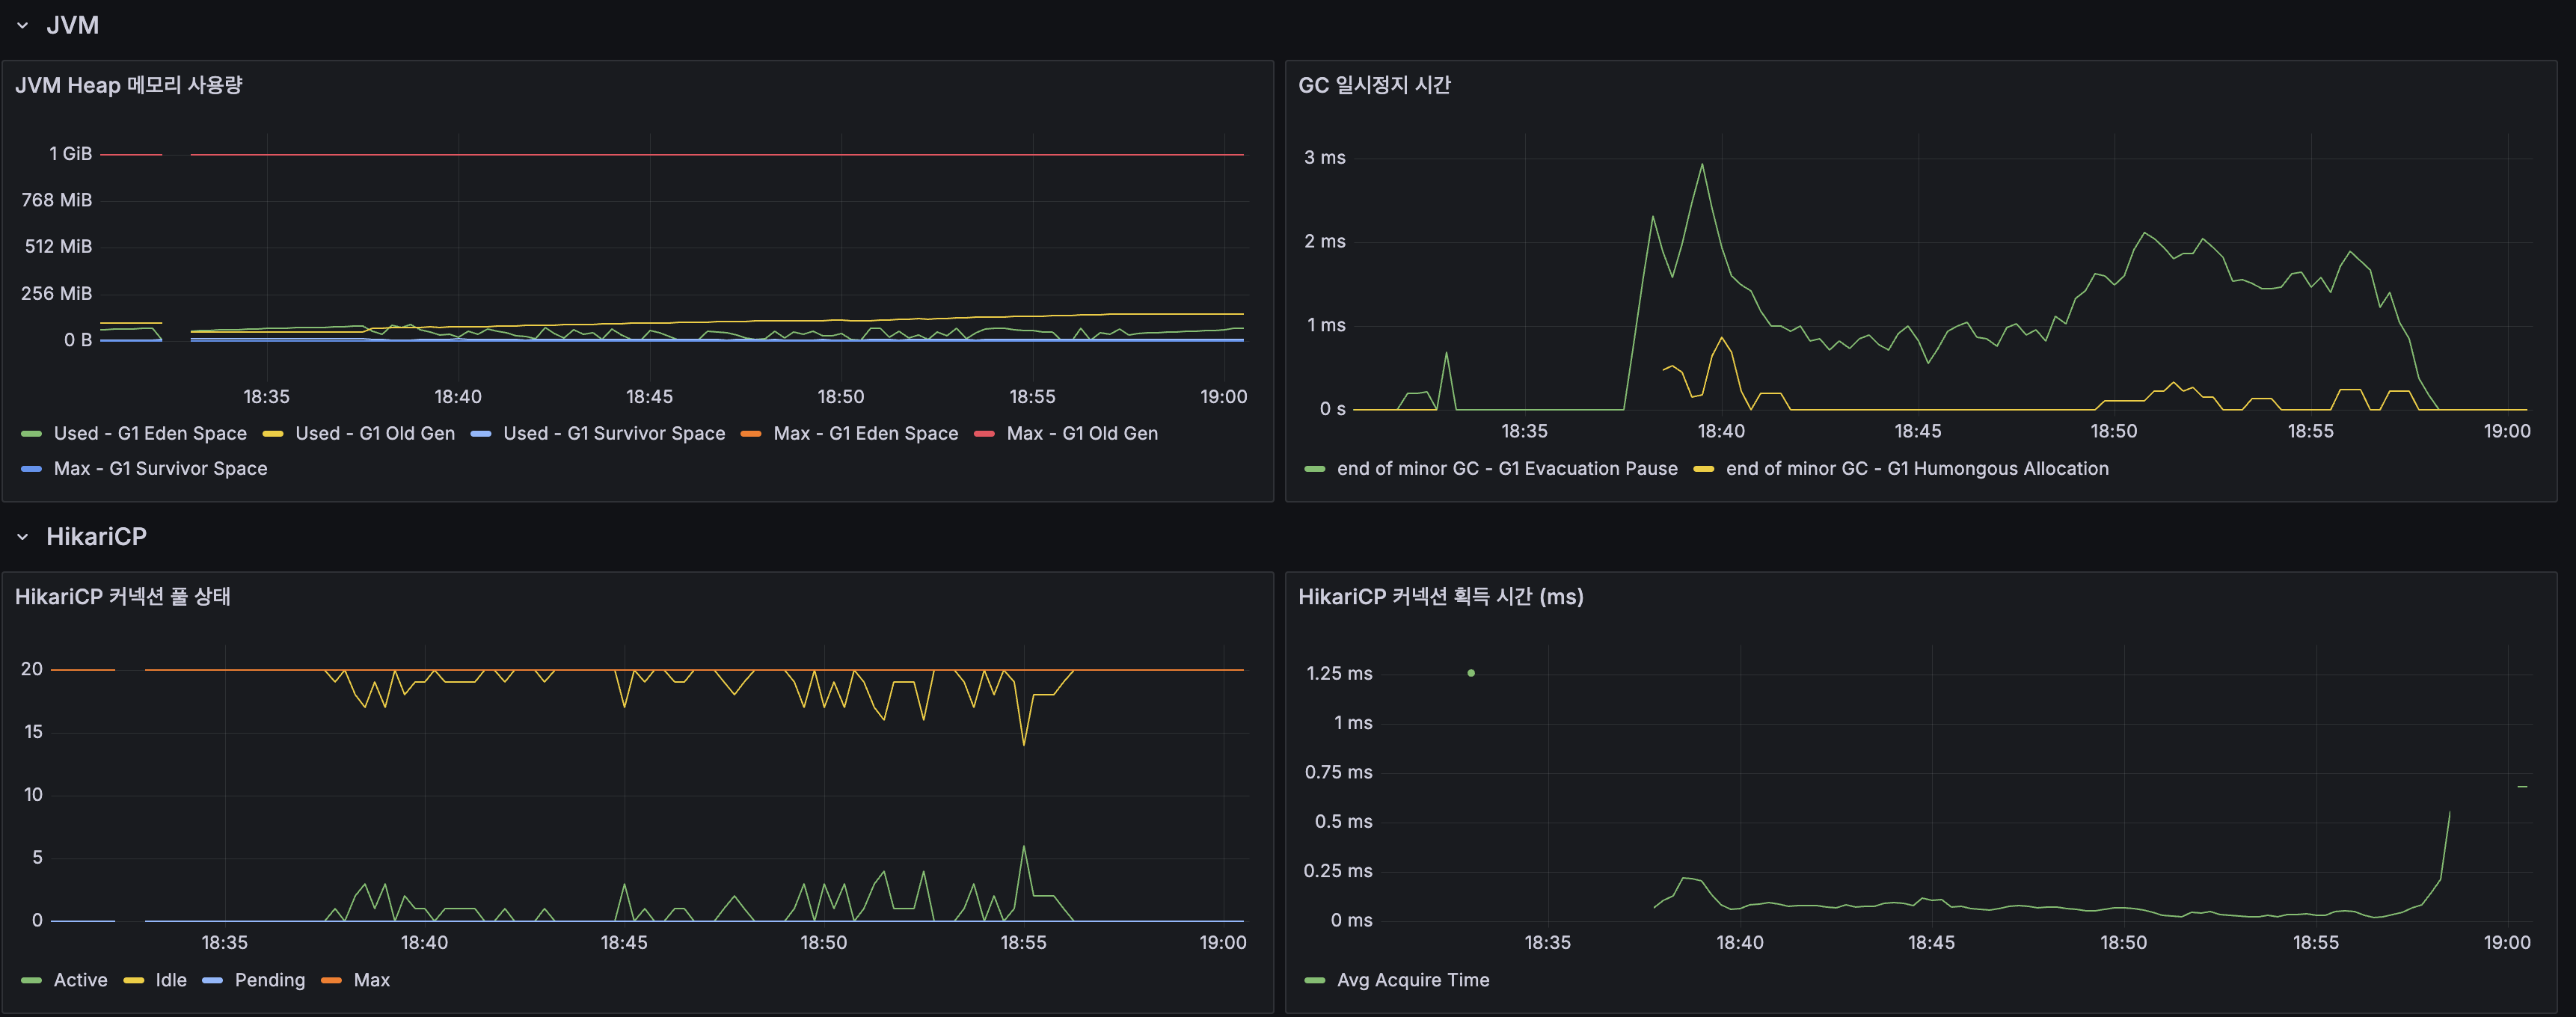
| GC Pause | 최대 ~3ms | 최대 ~3ms | 동일 |
| HikariCP Acquire | ~0.5-2ms | ~0.1-0.5ms | 개선 |
| 캐시 히트율 | 95.2% (단일 계층) | 82% (L1+L2 합산) | Origin 도달률 19% |
| Redis 메모리 | N/A | 28.4% (73MB) | 여유 충분 |
| Redis Eviction | N/A | 0 ops/s | 정상 |
| Lettuce P95 | N/A | ~2.5ms | SLA 달성 |
| 에러율 | 0% | ~0% | 동일 |
자동완성 Before/After
| 지표 | Before (Trie) | After (Redis flat KV) | 개선 |
|---|---|---|---|
| 응답 (캐시 히트) | ~0.1ms (Caffeine) | ~2.5ms (Redis P95) | 네트워크 비용 추가 (허용) |
| 응답 (캐시 미스) | ~5ms (Trie DFS) | ~2.5ms (Redis GET) | DFS 제거 |
| CPU 부하 | Trie DFS + Copy-on-Write | 없음 (Redis가 처리) | App CPU에서 제거 |
| 메모리 | ~66MB (JVM 힙) | ~73MB (Redis) | JVM 힙 절약 |
| 스케일아웃 | 인스턴스별 중복 | Redis 공유 | 일관성 확보 |
핵심 성과
단일 인스턴스 100 VU에서 응답시간/CPU는 유사하지만, 이 단계의 진짜 성과는 수치 개선보다 구조 전환에 있습니다:
- Stateless 전환 완료: Caffeine, Trie, TokenBlacklist를 Redis로 외부화하여 App 스케일아웃의 전제조건 충족
- Origin 도달률 19%: L1+L2 2계층으로 인스턴스를 추가해도 DB/Lucene 부하가 선형 증가하지 않는 구조 확보
- 자동완성 Trie 퇴역: O(1) Redis GET으로 전환, 인스턴스 간 일관성 확보, JVM 힙 ~66MB 절약
- Redis 인프라 안정: Eviction 0, Lettuce P95 2.5ms, 메모리 사용률 28.4%
후속 개선: Spring Batch 전환
RedisAutocompleteService.buildPrefixTopK()의 @Scheduled 방식을 Spring Batch Job(Tasklet)으로 전환했습니다.
| 항목 | 변경 전 | 변경 후 |
|---|---|---|
| 실행 방식 | @Scheduled(cron) + 단일 메서드 | Spring Batch Job + Tasklet + @Scheduled 트리거 |
| 실행 이력 | 로그만 | JobRepository에 시작/종료/상태/처리 건수 자동 기록 |
| 실패 복구 | 다음 주기까지 대기 | FAILED 상태에서 재시작 가능 |
| 트랜잭션 | @Transactional(readOnly) | Spring Batch Step 트랜잭션 관리 |
설계 문서의 MapReduce 배치 패턴과 부합합니다:
- Map: SQL GROUP BY → prefix 분해 (원본 + 자모 + 초성)
- Reduce: 접두사별 Top-K 집계
- Write: Redis 버전 네임스페이스 적재 → 포인터 원자적 전환
관련 파일:
AutocompleteBatchConfig.java: Job/Step/Tasklet 정의AutocompleteBatchScheduler.java: 매시간 Job 트리거RedisAutocompleteService.java:buildPrefixTopK()제거, 초기화만 유지
다음 글
다음 글에서 MySQL Replication(Primary-Replica)을 구성하고 DataSource 라우팅으로 읽기 부하를 분산합니다. 이것이 App 스케일아웃의 두 번째 전제조건입니다.
Previous Post
In Stress Testing Single Server Limits, we confirmed CPU 100% saturation at 200 VU and documented how JVM/Tomcat tuning backfired under CPU-bound bottleneck.
This post covers the first step of distributed transition: introducing Redis L2 cache and replacing Trie autocomplete with Redis flat KV to make the app Stateless.
Previous Posts Summary
| Post | Key Metric | Conclusion |
|---|---|---|
| Caching Strategy | Overall 776ms→54ms (14x) | Caffeine L1 cache introduced |
| Trie Autocomplete | Alphabetical→popularity, “삼ㅅ”→“삼성전자” | Search log-based autocomplete |
| Stress Test | 200 VU → CPU 100%, P95 1,413ms | Single server limit ~100-150 VU |
Key bottleneck confirmed in stress testing:
| Metric | 100 VU | 200 VU | Verdict |
|---|---|---|---|
| CPU | ~40% | 100% saturated | Root bottleneck |
| P95 | ~400ms | 1,413ms | SLA(300ms) violated |
| HikariCP Acquire | 0.05ms | 1,250ms | Symptom of CPU saturation |
JVM/Tomcat tuning (threads 200→100) resulted in 79% degradation. Tuning has limits under CPU-bound bottleneck — distributed transition is needed.
Overview
3-Phase Distributed Transition — Why Redis First
Instead of “CPU is the bottleneck, let’s add servers,” we follow a Bottom-Up order: infrastructure preparation → app expansion.
Problems if app scale-out comes first:
| Problem | Symptom |
|---|---|
| 3 apps without Redis | Caffeine independent per instance → hit rate crashes → Lucene searches explode → more CPU saturation |
| 3 apps without Replication | HikariCP connections triple (20×3=60). Single MySQL can’t handle it |
| TokenBlacklist not shared | Logout on instance A → still accessible on instance B (security flaw) |
Key Concept — Stateless Transition: When the app holds state internally (Caffeine cache, Trie, TokenBlacklist), it’s Stateful → state inconsistency on scale-out. Externalizing state to Redis makes it Stateless → instances can be freely added/removed.
Root Cause of CPU Saturation
Caffeine cache hit rate 96% → 4% missesMax TPS ~110 req/s × 4% misses = ~4-5 Lucene BM25 searches per second→ BM25 + DocValues sorting is CPU-intensive on ARM 2 cores Even 4-5 searches/sec saturates CPURedis L2 cache benefits:
- Shared cache across instances — Caffeine is per-instance; Redis is shared, maintaining hit rate
- Autocomplete flat KV — Eliminates Trie DFS, O(1) GET, reduces CPU load
- Reduced Origin access — L1 + L2 two-tier reduces DB/Lucene access probability
Goals for This Phase
| # | Content |
|---|---|
| 1 | Implement Caffeine(L1) + Redis(L2) tiered cache |
| 2 | Autocomplete: Trie → Redis flat KV transition |
| 3 | Serialization optimization (Jackson JSON) |
| 4 | Load test Before/After comparison |
Infrastructure — Dual Server Setup
Up to Stress Test, everything ran on a single server. Starting from this post, we create an additional Oracle Cloud instance for a dual server setup.
Server Specs
| Server | Specs | Status |
|---|---|---|
| Server 1 (app1) | Oracle Cloud ARM Ampere A1, 2 cores, 12GB RAM | Running |
| Server 2 (app2) | Oracle Cloud ARM Ampere A1, 2 cores, 12GB RAM | Newly created |
| Monitoring | Oracle Cloud VM, 1GB RAM | Running |
Server 2 is configured with the same specs (ARM 2 cores, 12GB RAM) as Server 1. Identical specs across both servers enable even load distribution during load balancing.
Phased Server Utilization Plan
| Phase | Server 1 Changes | Server 2 Changes |
|---|---|---|
| Redis L2 Cache (this post) | Add Redis container | No changes (OS + Docker prep only) |
| MySQL Replication (next post) | MySQL → Primary config | MySQL Replica setup |
| App Scale-out | Add Nginx load balancer | Deploy App2 + Lucene index |
Why Redis — Comparison with Memcached
The two main distributed cache options are Redis and Memcached.
| Criterion | Redis | Memcached | Decision |
|---|---|---|---|
| Data structures | String, Hash, Set, Sorted Set, etc. | String only | Need TokenBlacklist(Set), view count buffer(Hash) |
| Persistence | RDB snapshots / AOF logs | None | prefix_topk loss = up to 1 hour autocomplete outage. RDB restore needed |
| Pub/Sub | Built-in | None | Required for L1 cache invalidation propagation on scale-out |
| Execution model | Serial command processing (atomic guarantee) | Multi-threaded | Useful for TokenBlacklist INCR without separate locks |
| Memory efficiency | Has overhead | Slab allocator, more efficient | Cache data ~31MB → difference negligible |
When Memcached is better: When only pure caching is needed, and large-scale simple key-value must be processed with multi-threading.
Why Redis is essential for this project:
- Autocomplete data persistence — prefix_topk is built hourly; loss means up to 1 hour autocomplete outage
- TokenBlacklist — JWT logout blacklist must be shared across instances (Set + TTL)
- Pub/Sub cache invalidation — On scale-out: post edit on instance A → Pub/Sub → invalidate L1 on instances B/C
- Future use — CDC events, view count Redis INCR, roles beyond caching
Redis Cost Analysis — “Couldn’t We Solve This Without Redis?”
Before adding Redis, we evaluated 4 alternatives using existing infrastructure tuning:
| Alternative | Analysis | Decision |
|---|---|---|
| InnoDB Buffer Pool increase (2G→4G) | Buffer Pool hit rate already 100%. DB I/O isn’t the bottleneck | Rejected |
| Caffeine cache size increase | 4% misses are “new search terms (cold queries)”. Even doubling size won’t help cold queries. Per-instance isolation on scale-out | Rejected |
| JVM heap increase (1g→2g) | Heap usage 256MB/1GB with plenty of room. CPU is the bottleneck, not memory. Reduces OS page cache for Lucene MMap | Rejected |
| Scale up (2→4 cores) | Current instance spec (ARM 2 cores/12GB) is the ceiling. Spec change requires instance recreation | Rejected |
Resource Allocation Cost
With the server fixed at ARM 2 cores, 12GB RAM, infrastructure cost is “allocating 300MB to Redis means 300MB less elsewhere within 12GB” — a resource allocation problem.
Redis resource cost: Redis container: +300MB (maxmemory 256MB + overhead) OS page cache reduction: -200MB (~5G → ~4.8G) Lucene 20GB index page cache coverage: 25% → 24% (-1%)
Redis benefits: L2 cache hits avoid Lucene search → CPU load reduction Trie removal (~66MB JVM heap) → heap freed TokenBlacklist shared → scale-out prerequisite met
Decision: 1% page cache loss < L2 cache + Trie heap savings + scale-out readiness → Redis 300MB investment worthwhileAWS cost comparison reference: Adding ElastiCache (t3.micro ~₩30K/month) and downscaling RDS (e.g., db.r6g.large → medium, ~₩130K/month savings) to check if total infrastructure cost decreases would be the justification. Regardless of managed vs self-hosted, the resource allocation tradeoff analysis is the same thought process.
1. L1(Caffeine) + L2(Redis) Tiered Cache
Architecture Change
Cache Tier Characteristics
| Tier | Storage | Latency | Capacity | On Scale-out |
|---|---|---|---|---|
| L1 | Caffeine (JVM heap) | ~0.1ms | Limited | Separate per instance |
| L2 | Redis (network) | ~1-5ms | Multi-GB | Shared across all instances |
| Origin | MySQL/Lucene | ~50-200ms | Unlimited | - |
Why “Add” Not “Replace” with Redis
Using only Redis means every request incurs network cost (~1-5ms). With Caffeine(L1), repeated requests from the same instance return in 0.1ms. L1 saves network cost; L2 ensures cross-instance consistency.
Why Custom Implementation Instead of Spring @Cacheable
Spring Cache Abstraction (@Cacheable + CacheManager) is designed for single-tier caching.
| Approach | Problem |
|---|---|
CompositeCacheManager | Doesn’t support lookup order control or “promote to L1 on L2 hit” logic |
@Caching(cacheable = {L1, L2}) | Executes each independently, not sequential lookup |
| Third-party libraries | Extra dependency + custom logic constraints |
Therefore, TieredCacheService was implemented directly to control L1 → L2 → Origin lookup order and bidirectional storage.
TieredCacheService Implementation
@Componentpublic class TieredCacheService {
private final Cache<String, Object> localCache; // L1: Caffeine private final RedisTemplate<String, String> redisTemplate; // L2: Redis private final JsonMapper jsonMapper; // Jackson 3 private final MeterRegistry meterRegistry;
public <T> T get(String cacheRegion, String key, Class<T> type, Supplier<T> loader) { // 1. Check L1 Object cached = localCache.getIfPresent(key); if (cached != null && type.isInstance(cached)) { meterRegistry.counter("tiered_cache", "region", cacheRegion, "level", "L1").increment(); return type.cast(cached); }
// 2. Check L2 (skip on Redis failure) try { String json = redisTemplate.opsForValue().get(key); if (json != null) { T value = jsonMapper.readValue(json, type); localCache.put(key, value); // Promote to L1 meterRegistry.counter("tiered_cache", "region", cacheRegion, "level", "L2").increment(); return value; } } catch (RedisConnectionFailureException | RedisCommandTimeoutException e) { log.warn("Redis L2 lookup failed, fallback: {}", e.getMessage()); }
// 3. Origin lookup T value = loader.get();
// 4. Store in both L1 + L2 localCache.put(key, value); try { redisTemplate.opsForValue().set(key, jsonMapper.writeValueAsString(value), Duration.ofMinutes(10)); } catch (RedisConnectionFailureException e) { log.warn("Redis L2 store failed, L1 only: {}", e.getMessage()); }
meterRegistry.counter("tiered_cache", "region", cacheRegion, "level", "origin").increment(); return value; }}Design points:
RedisTemplate<String, String>+JsonMapperfor direct serialization/deserialization control- Java generics undergo type erasure at runtime, so
Class<T>parameter explicitly passes type information - Redis failures caught with try-catch, skipping L2 and falling back to L1 + Origin
cacheRegiontag enables per-purpose hit rate measurement (searchResults,postDetail)
L1-L2 Cache Consistency Strategy
In tiered caching, stale data in L1 is a structural issue:
Scenario: Post edit 1. User edits post:123 → DB updated 2. post:123 deleted from Redis(L2) 3. L1 on same instance also evicted → immediately reflected ✓ 4. L1 on other instances still has old data ✗ → Serves stale data until L1 TTL(5min) expiresInvalidation strategy (by phase):
| Phase | Strategy | Stale window |
|---|---|---|
| Current (single instance) | L1 evict + L2 delete | None |
| After scale-out (multi-instance) | Redis Pub/Sub broadcast + L1 TTL backup | ~ms (Pub/Sub) ~ max 5min (TTL expiry) |
Pub/Sub limitation — at-most-once delivery: Redis Pub/Sub is fire-and-forget. If a subscriber momentarily disconnects, messages published during that time are permanently lost.
| Alternative | Pros | Cons | Decision |
|---|---|---|---|
| Redis Streams | at-least-once guaranteed | Consumer Group + ACK management complexity | Over-engineering for cache invalidation |
| Kafka | Perfect message guarantee | Separate broker infra needed, operational overhead on current server resources | Rejected |
| Pub/Sub + L1 TTL | Simple implementation. L1 TTL(5min) serves as safety net on loss | Max 5min stale | Selected |
For a community forum, max 5-minute delay in search results has negligible UX impact, so best-effort invalidation + TTL safety net was adopted.
Graceful Degradation on Redis Failure
Core principle: Redis failure must not become service failure. Redis is “makes things faster when available,” not “required for operation.”
Normal: Request → L1(Caffeine) → L2(Redis) → Lucene/MySQL
Redis down: Request → L1(Caffeine) → L2(Redis) ✗ timeout ↓ try-catch skips L2 Lucene/MySQL direct query ↓ Store in L1 onlyAutocomplete is the exception — prefix_topk data exists only in Redis, so on Redis failure, it auto-switches to Lucene PrefixQuery fallback. This is why Trie was retired but Lucene PrefixQuery was kept as fallback.
2. Autocomplete Flat KV — Retiring Trie
Trie Limitations (Identified in Trie Autocomplete)
| Problem | Description |
|---|---|
| Memory | With Jamo decomposition, 30K entries = ~196MB. Duplicated per instance on scale-out |
| Can’t scale out | Per-instance Trie independent → search log sync impossible |
| DFS cost | Branch explosion on short prefixes (1-2 chars) |
Transition to Redis Flat KV
Trie (before): "삼성" search → Trie DFS → traverse child nodes → Top-K sort → return
Redis flat KV (this post): "삼성" search → Redis GET "prefix:삼성" → ["삼성전자","삼성물산","삼성SDI"] → O(1), no DFS, no CPU loadprefix_topk Data Generation — SQL GROUP BY + Prefix Decomposition
Processed with SQL + Java on a single server, no MapReduce/Spark:
@Scheduled(cron = "0 0 * * * *") // hourlypublic void buildPrefixTopK() { // 1. SQL GROUP BY to extract top-N popular queries List<Object[]> topQueries = searchLogRepository .findTopQueriesSince(LocalDateTime.now().minusDays(7), 10000);
// 2. Decompose each query into all prefixes Map<String, PriorityQueue<ScoredQuery>> prefixMap = new HashMap<>(); for (Object[] row : topQueries) { String query = (String) row[0]; long count = ((Number) row[1]).longValue(); for (int len = 1; len <= Math.min(query.length(), 10); len++) { String prefix = query.substring(0, len); prefixMap.computeIfAbsent(prefix, k -> new PriorityQueue<>( Comparator.comparingLong(ScoredQuery::score))) .offer(new ScoredQuery(query, count)); if (prefixMap.get(prefix).size() > 10) { prefixMap.get(prefix).poll(); // Maintain Top-10 } } }
// 3. Load into new version namespace long newVersion = System.currentTimeMillis(); prefixMap.forEach((prefix, heap) -> { List<String> topK = heap.stream() .sorted(Comparator.comparingLong(ScoredQuery::score).reversed()) .map(ScoredQuery::query).toList(); redisTemplate.opsForValue().set( "prefix:v" + newVersion + ":" + prefix, toJson(topK), Duration.ofHours(2)); });
// 4. Atomic version pointer switch redisTemplate.opsForValue().set("prefix:current_version", String.valueOf(newVersion));}Why Version Namespace Instead of RENAME
| Method | Pros | Cons | Decision |
|---|---|---|---|
| Repeated RENAME | Simple | 5,000 individual RENAMEs → inconsistency on mid-failure | Rejected |
| Redis Pipeline | Saves network cost | Still individual execution on server. Not atomic | Rejected |
| Lua Script | Atomic execution | Processing 5,000 keys blocks Redis single thread | Rejected |
| Version namespace | Load new data separately, then atomically switch pointer (single key) | Previous version occupies memory until TTL | Selected |
Previous version keys occupy memory until TTL expiry, but total prefix_topk is ~1MB, so even doubled (~2MB) is negligible.
Solving 2-GET overhead: Version value is locally cached in Caffeine (TTL 30sec). Version changes only on hourly batch, so 30sec caching is safe. Read path: Caffeine version lookup (0.1ms) → 1 Redis GET (~1ms).
Redis Memory Estimate
| Item | Value |
|---|---|
| Prefix key count | ~5,000 |
| Average key size | ~30 bytes |
| Average value (Top-10 JSON) | ~200 bytes |
| Total Redis memory | ~1.1MB |
Even with 10x search log growth, ~23MB. Single Redis is sufficient.
3. Serialization — Jackson JSON Selected
| Format | Size | Speed | Readability | Dependencies |
|---|---|---|---|---|
| Jackson JSON | Normal | Normal | High (readable in redis-cli) | Included in Spring Boot |
| MessagePack | ~30% smaller | Faster | None (binary) | Extra dependency |
| Kryo | Smallest | Fastest | None | Schema registration needed |
Jackson JSON rationale: Total cache data ~31MB. MessagePack saves ~9MB — only 3.5% of Redis maxmemory 256MB. Serialization speed difference (~0.5μs) is negligible vs network RTT (~1ms). Human-readable in redis-cli for easy debugging, no extra dependencies.
Switch threshold: When Redis memory reaches 80% (~200MB) of maxmemory. Current measured usage is 28.4% (~73MB), so the switch point is far off.
4. Adding Redis to Docker
docker-compose.yml
redis: image: redis:7.4-alpine container_name: wiki-redis-prod restart: always volumes: - redis-data:/data command: > redis-server --maxmemory 256mb --maxmemory-policy volatile-lru --requirepass ${REDIS_PASSWORD} --slowlog-log-slower-than 10000 --slowlog-max-len 128 deploy: resources: limits: memory: 300MWhy volatile-lru Instead of allkeys-lru
allkeys-lru evicts all keys by LRU under memory pressure. This project has keys that must not be deleted:
| Key Type | TTL Set | Impact if Deleted |
|---|---|---|
| Cache (searchResults, postDetail) | 10min | Re-query from DB — acceptable |
| prefix_topk (autocomplete) | 2hr | Autocomplete outage — dangerous |
| prefix:current_version | No TTL | Total autocomplete failure — critical |
| TokenBlacklist | Token expiry | Logout invalidation — security flaw |
volatile-lru only targets keys with TTL set for eviction. prefix:current_version without TTL is never evicted.
Security — No Port Exposure + Authentication
App containers access Redis via service name (redis:6379) on Docker Compose internal network. Port 6379 is not exposed to the host. requirepass enforces password authentication.
5. Redis Monitoring
Redis Exporter + Grafana Dashboard
| Panel | Metric | Meaning |
|---|---|---|
| Memory usage | redis_memory_used / max_bytes | Usage vs maxmemory 256MB |
| L2 cache hit rate | keyspace_hits / (hits + misses) | Redis cache utilization |
| Eviction count | redis_evicted_keys_total | TokenBlacklist safety monitor |
| OPS | redis_commands_processed_total (rate) | Commands per second |
| Slowlog | redis_slowlog_length | Commands slower than 10ms |
Lettuce Client Latency
Redis Exporter provides server-side metrics. App→Redis latency including network is auto-instrumented by Spring Boot 4.0’s LettuceObservationAutoConfiguration.
| Metric | Meaning |
|---|---|
lettuce_seconds_* | Full command completion time (histogram) |
lettuce_active_seconds_* | Command active (waiting) time |
Works with just
spring-boot-starter-data-redis+spring-boot-starter-actuator, no extra dependencies needed.
L1/L2/Origin Hit Rate Custom Metrics
Existing Caffeine’s cache_gets_total stops working after TieredCacheService migration, so 3-tier ratios are directly instrumented:
| Grafana Panel | PromQL | Meaning |
|---|---|---|
| L1/L2/Origin ratio | sum by (level) (rate(tiered_cache_total[5m])) | 3-tier hit distribution |
| Origin access rate trend | rate(tiered_cache_total{level="origin"}[5m]) | Correlation with CPU load |
Grafana Alert Rules
| Alert | Condition | Severity |
|---|---|---|
| Redis memory danger | Usage > 90% (5min) | Critical |
| Eviction surge | rate > 10/s | Warning |
| Redis down | up{job="redis"} == 0 (1min) | Critical |
| L2 hit rate drop | < 50% (10min) | Warning |
Ansible Infrastructure Changes
Modified Files
| File | Changes |
|---|---|
inventory.yml | Added app2 host to app group |
group_vars/all.yml | Added redis_password, redis_memory_limit, app2_server_host (vault encrypted) |
site.yml | Added Server 2 base setup play (docker + firewall only) |
docker-compose.yml.j2 | Added wiki-redis-prod, wiki-redis-exporter-prod services |
env.prod.j2 | Added REDIS_HOST, REDIS_PORT, REDIS_PASSWORD |
prometheus.yml.j2 | Added redis scrape job + Server 2 node-exporter |
redis.json (new) | Redis Grafana dashboard |
redis-alerts.yml (new) | 5 Grafana alert rules |
Before Measurement (Baseline Before Redis)
Redis container is running but app code still uses Caffeine + Trie. k6 load test (100 VU, 20min).
k6 Results
| Metric | Value |
|---|---|
| Avg response time | 38.2ms |
| P95 | 150ms |
| P99 | 359ms |
| Error rate | 0% |
| Max TPS | 58.4 req/s |
Per-Scenario Response Time + Search Frequency Performance
| Scenario | Avg | P95 |
|---|---|---|
| Search | 39.1ms | 174ms |
| Autocomplete | 10.3ms | 21.0ms |
| Post listing | 12.2ms | 29.1ms |
| Detail view | 23.5ms | 52.1ms |
| Frequency | Avg | P95 |
|---|---|---|
| Rare tokens (10%) | 18.5ms | 57.6ms |
| Mid-frequency (60%) | 23.0ms | 90.3ms |
| High-frequency (30%) | 75.0ms | 405ms |
Key observation: High-frequency tokens (“대한민국”, “history”) with avg 75ms, P95 405ms are pulling up overall response time. Longer posting lists consume more CPU for BM25 scoring. This is the direct justification for reducing Lucene access via Redis L2 cache.
Network Detail
| Metric | Value |
|---|---|
| DNS | 0.052ms |
| Connection | 0.030ms |
| Wait (TTFB) | 40.1ms |
| Received data | 228 MiB |
| Sent data | 7.91 MiB |
System Metrics
| Metric | Value |
|---|---|
| App CPU | ~40-70% |
| Caffeine searchResults hit rate | 95.2% |
| Caffeine autocomplete hit rate | 100% |
| Caffeine postDetail hit rate | 55.6% |
| InnoDB Buffer Pool hit rate | 100% |
Core Implementation — Code Changes
| # | Task | Status |
|---|---|---|
| 1 | TieredCacheService (L1 + L2 + fallback + Micrometer) | Done |
| 2 | Search cache: @Cacheable → TieredCacheService | Done |
| 3 | Post detail cache: @Cacheable → TieredCacheService | Done |
| 4 | prefix_topk batch build + version namespace | Done |
| 5 | Autocomplete API: Trie → Redis flat KV | Done |
| 6 | Lucene PrefixQuery fallback | Done |
| 7 | Remove Caffeine autocomplete cache, retire TrieInitializer | Done |
| 8 | Grafana dashboard + alert rules | Done |
Key Code Changes
| File | Changes |
|---|---|
PostService.java | Removed @Cacheable/@CacheEvict → direct TieredCacheService calls |
RedisAutocompleteService.java (new) | Redis flat KV autocomplete: batch build + version namespace + Lucene fallback |
CachedSearchResult.java (new) | Cache wrapper record for Slice → JSON serialization issues |
CacheConfig.java | Removed autocomplete Caffeine cache |
TrieInitializer.java | Removed @Scheduled/@EventListener, marked @Deprecated |
Search log recording improvement: Previous @Cacheable skipped method body on cache hit, causing search log omissions. After TieredCacheService migration, searchLogCollector.record(keyword) was placed outside the cache, ensuring all searches are recorded. This improves prefix_topk popularity data accuracy.
Functional Verification (Production)
| # | Verification | Result |
|---|---|---|
| 1 | Autocomplete API | prefix=삼성 → ["삼성전자","삼성물산","삼성 sdi"] — Redis flat KV O(1) |
| 2 | Search cache | 1st call origin → 2nd call L1 hit. Redis key creation confirmed |
| 3 | Post detail cache | Redis key post:571474 created |
| 4 | prefix_topk batch | Auto-built on startup: keys=390, source queries=42, 833ms |
| 5 | tiered_cache metrics | L1/L2/origin counters exposed in Prometheus |
| 6 | All containers healthy | 10 containers all healthy |
After Measurement + Before Comparison
Re-measured under identical conditions (100 VU, 20min) as Before (Caffeine + Trie).
Tiered Cache Hit Distribution
| Tier | Ratio | Meaning |
|---|---|---|
| L1 (Caffeine) | 73% | Same-instance repeats → 0.1ms return |
| L2 (Redis) | 9% | L1 miss → Redis serves → ~2.5ms |
| Origin | 19% | Cache miss → direct DB/Lucene access |
L1 + L2 combined 82% hit → Origin access reduced to 19%, Lucene/MySQL access cut to 1/5th.
Redis Dashboard
| Metric | Value |
|---|---|
| Memory usage | 28.4% (73MB / 256MB) |
| L2 cache hit rate | 51.9% |
| Eviction | 0 ops/s |
| Slowlog | 1 (normal) |
| Keys | 4,620 |
Lettuce Latency
| Metric | Value |
|---|---|
| P95 | ~2.5ms (SLA 5ms achieved) |
| P99 | ~2.5ms |
| GET P95 | ~1-2ms |
| SET P95 | ~1-2ms |
Before vs After Comprehensive Comparison
| Metric | Before (Caffeine + Trie) | After (Redis L2 + flat KV) | Change |
|---|---|---|---|
| Avg response | 38.2ms | ~40ms | Similar |
| HTTP P95 (stable) | ~150ms | ~200ms | Similar |
| App CPU | ~40-70% | ~20-80% | Similar |
| GC Pause | Max ~3ms | Max ~3ms | Same |
| HikariCP Acquire | ~0.5-2ms | ~0.1-0.5ms | Improved |
| Cache hit rate | 95.2% (single tier) | 82% (L1+L2 combined) | Origin access 19% |
| Redis memory | N/A | 28.4% (73MB) | Plenty of room |
| Redis Eviction | N/A | 0 ops/s | Normal |
| Lettuce P95 | N/A | ~2.5ms | SLA achieved |
| Error rate | 0% | ~0% | Same |
Autocomplete Before/After
| Metric | Before (Trie) | After (Redis flat KV) | Improvement |
|---|---|---|---|
| Response (cache hit) | ~0.1ms (Caffeine) | ~2.5ms (Redis P95) | Network cost added (acceptable) |
| Response (cache miss) | ~5ms (Trie DFS) | ~2.5ms (Redis GET) | DFS eliminated |
| CPU load | Trie DFS + Copy-on-Write | None (Redis handles it) | Removed from App CPU |
| Memory | ~66MB (JVM heap) | ~73MB (Redis) | JVM heap saved |
| Scale-out | Per-instance duplication | Redis shared | Consistency achieved |
Key Achievements
Response time/CPU at 100 VU single instance are similar, but the real achievement is structural transition, not metric improvement:
- Stateless transition complete — Caffeine, Trie, TokenBlacklist externalized to Redis, fulfilling App scale-out prerequisites
- Origin access rate 19% — With L1+L2 two-tier, DB/Lucene load won’t increase linearly when adding instances
- Trie retired — Switched to O(1) Redis GET, cross-instance consistency achieved, ~66MB JVM heap saved
- Redis infra stable — Eviction 0, Lettuce P95 2.5ms, memory usage 28.4%
Next Post
The next post configures MySQL Replication (Primary-Replica) with DataSource routing to distribute read load. This is the second prerequisite for App Scale-out.

댓글
댓글 수정/삭제는 GitHub Discussions에서 가능합니다.