분산 안정성 검증: stress 테스트 + 한계점 분석
목차
이전 글
Redis 샤딩: Consistent Hashing으로 워크로드 격리에서 KEYS 블로킹 안티패턴 제거, 3노드 Consistent Hashing, 블랙리스트 전용 인스턴스 격리를 완료했습니다. 이 글은 분산 아키텍처 전체를 stress 테스트로 검증하는 과정입니다.
이전 글 요약
| 글 | 핵심 수치 |
|---|---|
| Redis L2 캐시 + Stateless 전환 | L1 73% + L2 9% = 82% 히트, Lettuce P95 2.5ms |
| MySQL Replication | GTID 비동기, Primary 5 + Replica 15, Lag 0~1초 |
| App 스케일아웃 | 482ms → 37ms (92%↓), 에러 13.25% → 0%, CPU 100% → 50% |
| CDC: 이벤트 기반 동기화 | PostService dual-write 제거, OCP 준수 |
| Redis 샤딩 | KEYS→SCAN, 3노드 분리, 워크로드 격리 |
Redis 샤딩 이후 부하 테스트 (100 VU, 20분):
| 지표 | 결과 |
|---|---|
| 평균 응답시간 | 42.8ms |
| P95 | 190ms |
| 에러율 | 0.00% |
| 처리량 (피크) | ~58 req/s |
각 컴포넌트가 단독으로 검증된 상태다. 하지만 전체가 함께 높은 부하에서 동작했을 때의 한계는 확인하지 않았다.
1. 왜 지금인가
stress 테스트와의 차이
stress 테스트는 단일 서버의 한계점을 찾았다:
- 단일 서버 (1 App + 1 MySQL + 0 Redis) → 200 VU, 25분 → CPU 100%, P95 1.4초
- “스케일 아웃이 필요하다”는 근거 확보
이번 테스트는 분산 아키텍처의 한계점을 찾는다:
- 분산 아키텍처 (2 App + MySQL Primary/Replica + Redis 3샤드 + Kafka + Debezium) → stress (한계점 재탐색)
- “프로덕션에 올려도 되나?”에 대한 답
미뤄둔 soak 테스트
stress 테스트에서 명시적으로 미뤘던 soak 테스트(50 VU, 4시간)는 분산 인프라가 갖춰진 후에 의미가 있다. 단일 서버에서 50 VU × 4시간은 CPU 100%로 금방 폭사하지만, 분산 아키텍처에서는 CPU가 여유 있는 상태에서 시간이 지남에 따라 나타나는 문제를 찾는다.
soak 테스트로 찾는 “시간 기반” 문제들:
- 메모리 누수: Heap 사용량이 GC 후에도 점진적 상승 → OOM
- GC Pause 누적: G1 GC Mixed/Full GC 빈도가 시간에 따라 증가
- DB 커넥션 풀 Drift: HikariCP Active 커넥션이 점진적 상승 → 풀 고갈
- Redis 메모리 Drift: used_memory 점진적 상승 → eviction → 블랙리스트 키 유실 위험
- Kafka Consumer Lag 축적: 초기엔 0이지만 시간에 따라 lag 증가
- Replication Lag 축적: 부하 시 MySQL Replica가 점차 뒤처짐
현업 사례:
- Netflix: soak 테스트에서 48시간 후 Zuul 프록시의 DirectByteBuffer 누수 발견. 짧은 테스트에서는 GC가 처리했지만 장시간 시 OOM
- LinkedIn: 4시간 soak에서 Kafka Consumer의
max.poll.records설정 오류로 rebalancing 반복 발견 - Stripe: soak 테스트에서 Ruby GC의 heap fragmentation이 시간에 비례해 증가하여 P99 레이턴시가 2시간 후 3배 악화
2. 테스트 환경
인프라 구성

| 서버 | 역할 | 스펙 |
|---|---|---|
| 서버 1 | App + DB Primary + Redis + Nginx | ARM 2코어, 12GB |
| 서버 2 | App + DB Replica + Redis Shard + Kafka | ARM 2코어, 12GB |
| 서버 3 | Grafana + Loki + k6 + InfluxDB | AMD 1코어, 6GB |
| 서버 4 | Prometheus + Node Exporter | AMD 1코어, 6GB |
데이터 상태
| 항목 | 값 |
|---|---|
| posts 테이블 | ~1,215만 건 |
| Lucene 인덱스 | ~20GB (Primary + Replica) |
| Redis 자동완성 KV | 수만~수십만 키 (3 샤드 분산) |
| Redis 캐시 L2 | 핫 게시글 수천 키 (3 샤드 분산) |
| Redis 토큰 블랙리스트 | 수백~수천 키 (전용 인스턴스) |
3. stress 테스트 계획
VU 수치 산출 근거
stress 테스트에서 ARM 2코어 단일 서버의 한계가 100~150 VU(CPU 100%)였다. App 스케일아웃에서 App 2대로 확장한 결과, 100 VU에서 CPU가 50%로 안정화되었다. 단순 선형 확장이면 200~300 VU가 한계이지만, Amdahl’s Law에 의해 공유 자원(MySQL Primary, Nginx, Redis) 경합이 발생하므로 선형 확장은 불가능하다.
프로필 (25분)
0~3분: 0 → 100 VU (워밍업)3~8분: 100 VU 유지 (정상 부하 — Baseline 비교)8~12분: 100 → 200 VU (과부하 진입)12~22분: 200 VU 유지 (한계점 탐색)22~25분: 200 → 0 VU (회복)트래픽 비율
| 시나리오 | 비율 | 설명 |
|---|---|---|
| 검색 | 30% | 한국어/영문 혼합 15개 키워드 |
| 자동완성 | 25% | 12개 prefix |
| 상세 조회 | 20% | 핫 게시글 80% + 랜덤 20% |
| 목록 조회 | 15% | 페이지 0~9 |
| 쓰기 | 5% | 게시글 생성 |
| 좋아요 | 5% | 핫 게시글 대상 |
성공 기준
| 지표 | stress 테스트 (단일) | 목표 (분산) |
|---|---|---|
| 최대 VU (에러율 < 1%) | ~100-150 VU | 200+ VU |
| P95 (100 VU) | 1,400ms | < 200ms |
| 에러율 (200 VU) | 13.25% (100 VU) | < 1% |
4. stress 테스트 결과
k6 콘솔 결과
| 시나리오 | 평균 | P95 |
|---|---|---|
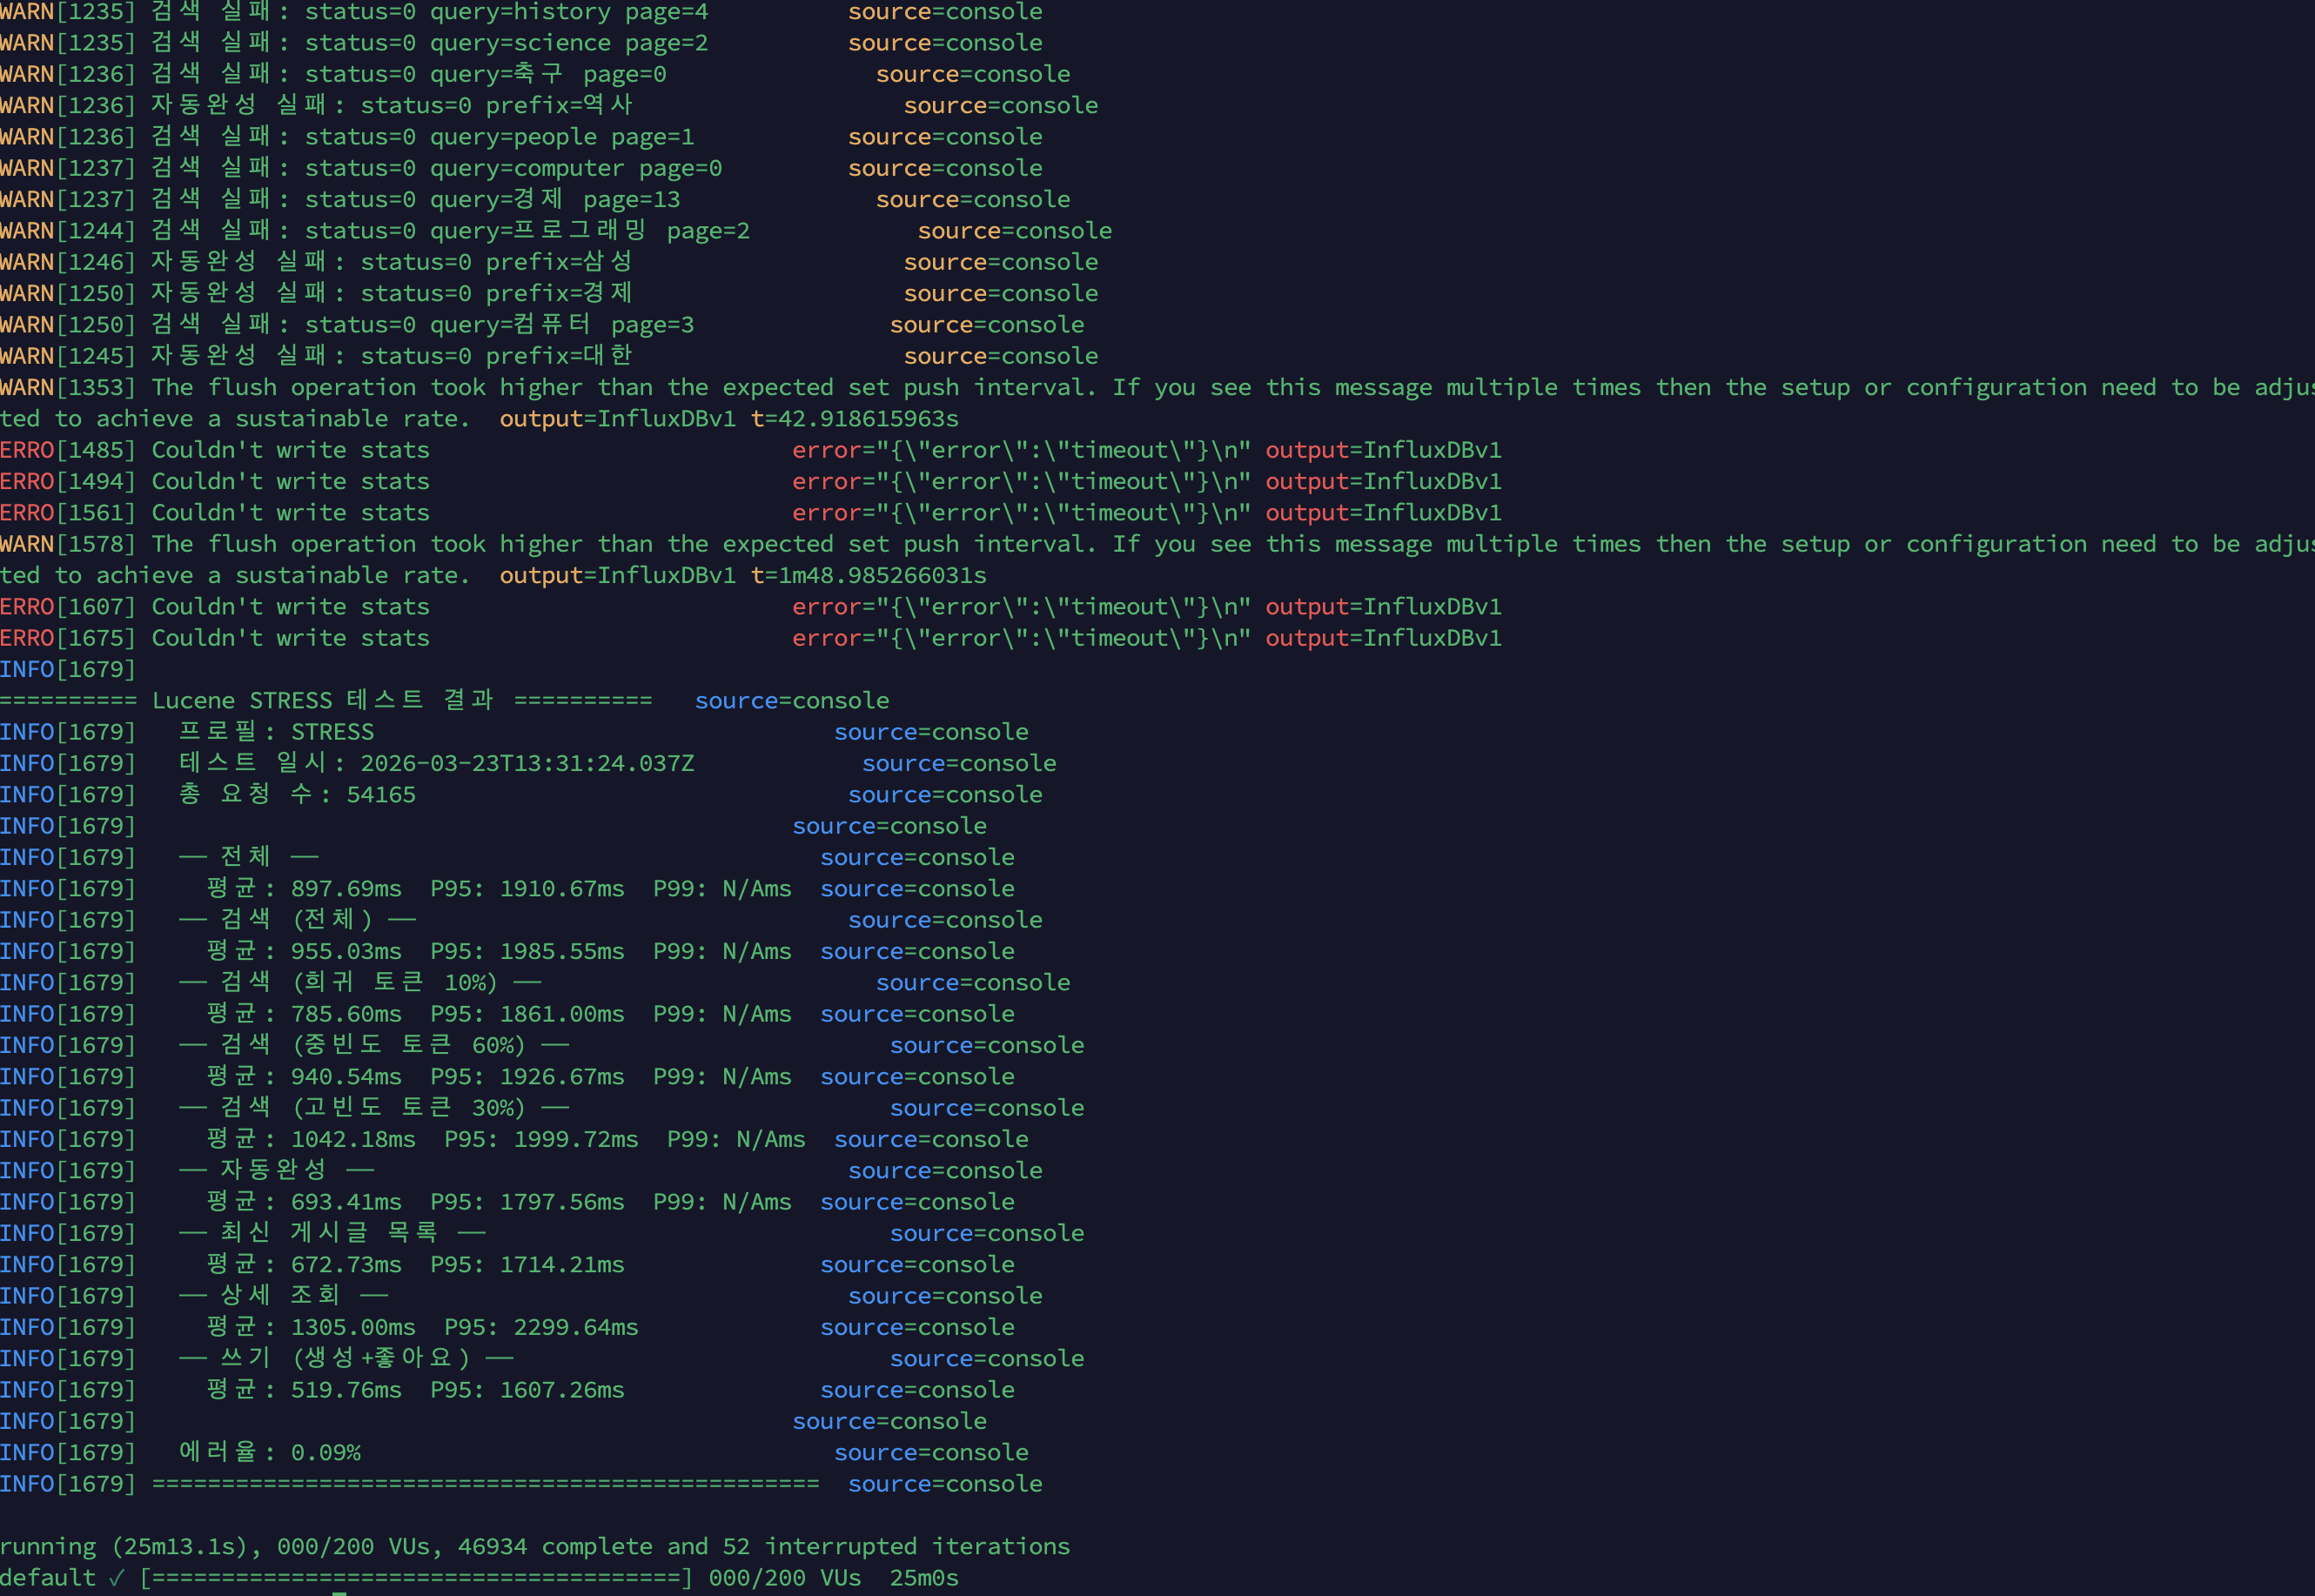
| 전체 | 897.69ms | 1,910.67ms |
| 검색 (전체) | 955.03ms | 1,985.55ms |
| 검색 (희귀 10%) | 785.60ms | 1,861.00ms |
| 검색 (중빈도 60%) | 940.54ms | 1,926.67ms |
| 검색 (고빈도 30%) | 1,042.18ms | 1,999.72ms |
| 자동완성 | 693.41ms | 1,797.56ms |
| 최신 게시글 | 672.73ms | 1,714.21ms |
| 상세 조회 | 1,305.00ms | 2,299.64ms |
| 쓰기 (생성+좋아요) | 519.76ms | 1,607.26ms |
| 에러율 | 0.09% | |
| 총 요청 수 | 54,165 |
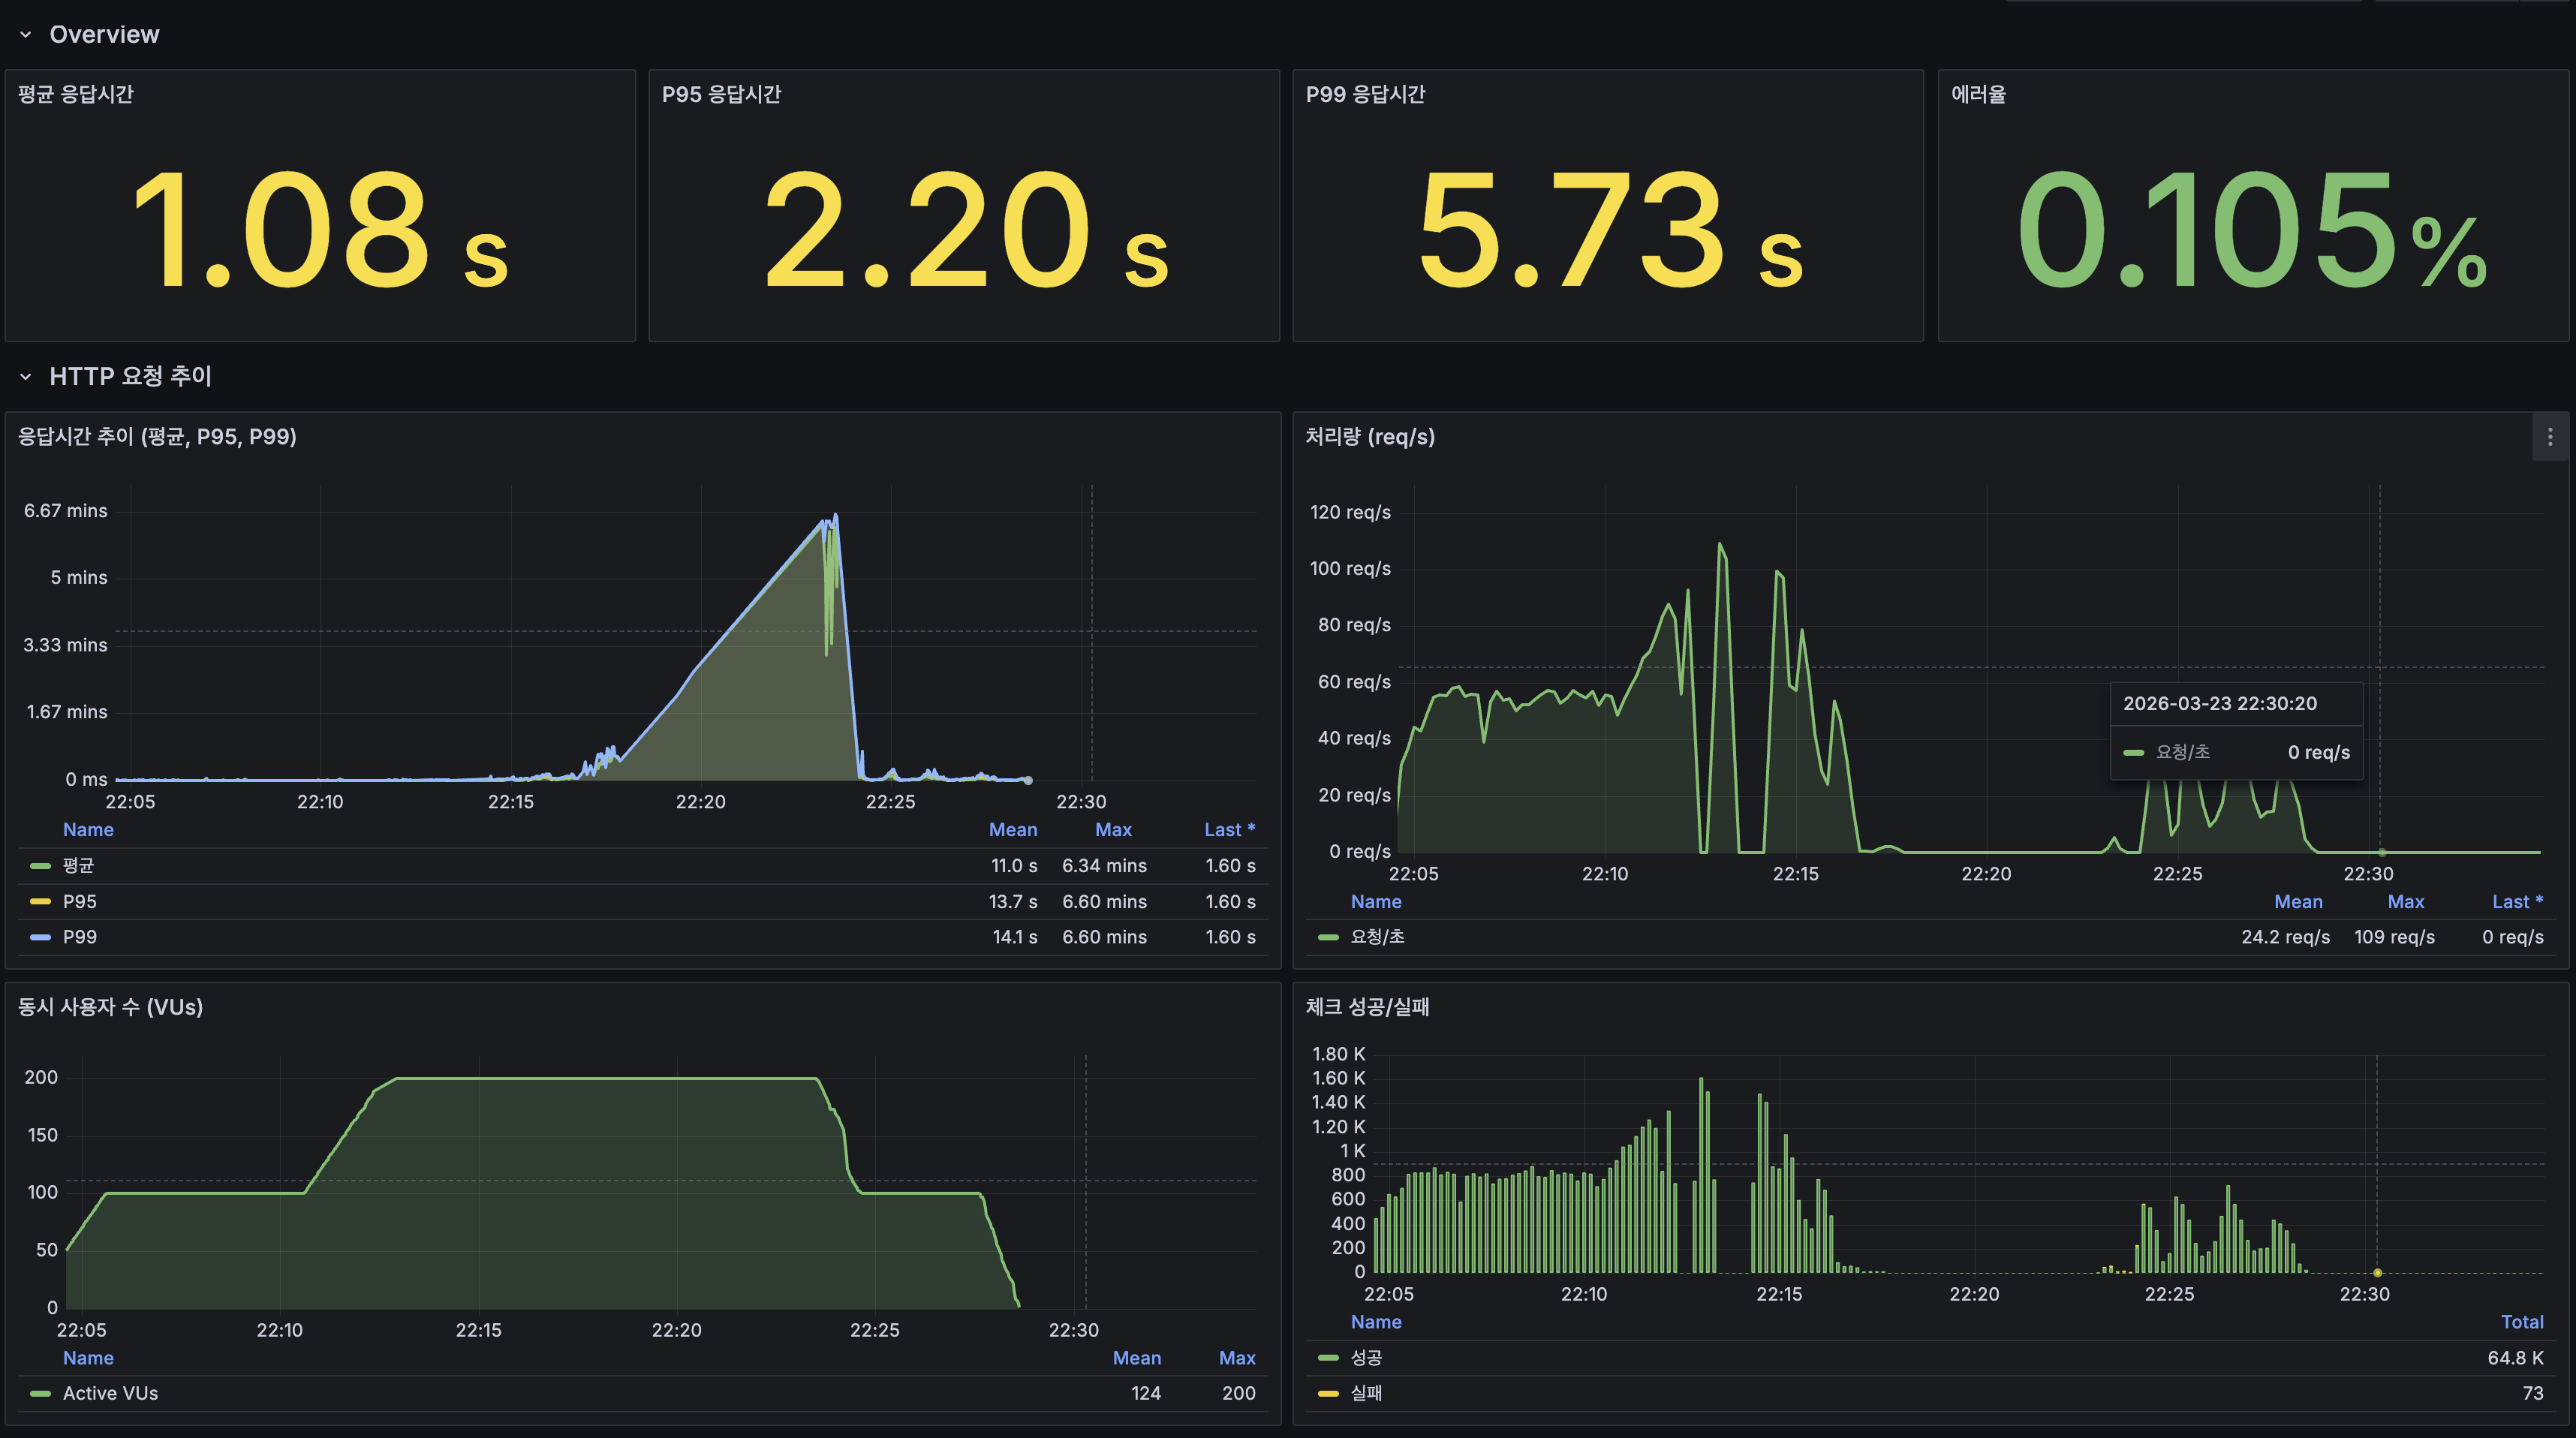
k6 Overview 대시보드
| 지표 | 값 | 분석 |
|---|---|---|
| 평균 응답시간 | 1.08s | 100 VU 구간(42.8ms) 대비 200 VU에서 급등 |
| P95 | 2.20s | Redis 샤딩 P95(190ms) 대비 11.5배 악화 |
| P99 | 5.73s | 극단적 지연, CPU 포화 시 대기열 급증 |
| 에러율 | 0.105% | 목표(< 1%) 달성 |
| 피크 처리량 | 109 req/s | 100 VU 구간에서 피크, 200 VU에서 오히려 하락 |
응답시간 추이:
- 0~8분 (0→100 VU): 평균 ~50ms, P95 ~200ms로 Baseline과 일치
- 8~12분 (100→200 VU): P95가 분 단위로 급등하며 CPU 포화 진입
- 12~22분 (200 VU 유지): P95/P99가 초 단위까지 폭등하는 대기열 눈사태(queueing avalanche)
- 22~25분 (200→0 VU): 부하 감소 후 ~2분 내 정상 복귀
5. 원인 분석: App CPU 포화가 근본 병목
100 VU vs 200 VU 비교
| 지표 | 100 VU 구간 | 200 VU 구간 | 악화율 |
|---|---|---|---|
| 평균 | ~50ms | 897ms | 18배 |
| P95 | ~200ms | 1,911ms | 9.5배 |
| P99 | ~400ms | 5,730ms | 14배 |
| 처리량 | ~60 req/s | ~25 req/s (하락) | -58% |
| App CPU | ~50% | 80-100% | 포화 |
처리량이 오히려 하락한 것은 queueing avalanche 때문이다. 앱이 요청을 처리하는 속도보다 새 요청이 들어오는 속도가 빨라, 대기열이 눈덩이처럼 커지는 현상이다.
소거법: CPU가 병목인 근거
| 컴포넌트 | 200 VU 상태 | 병목? |
|---|---|---|
| App CPU | 80-100%, Load Average ~15 (2코어의 7.5배) | YES |
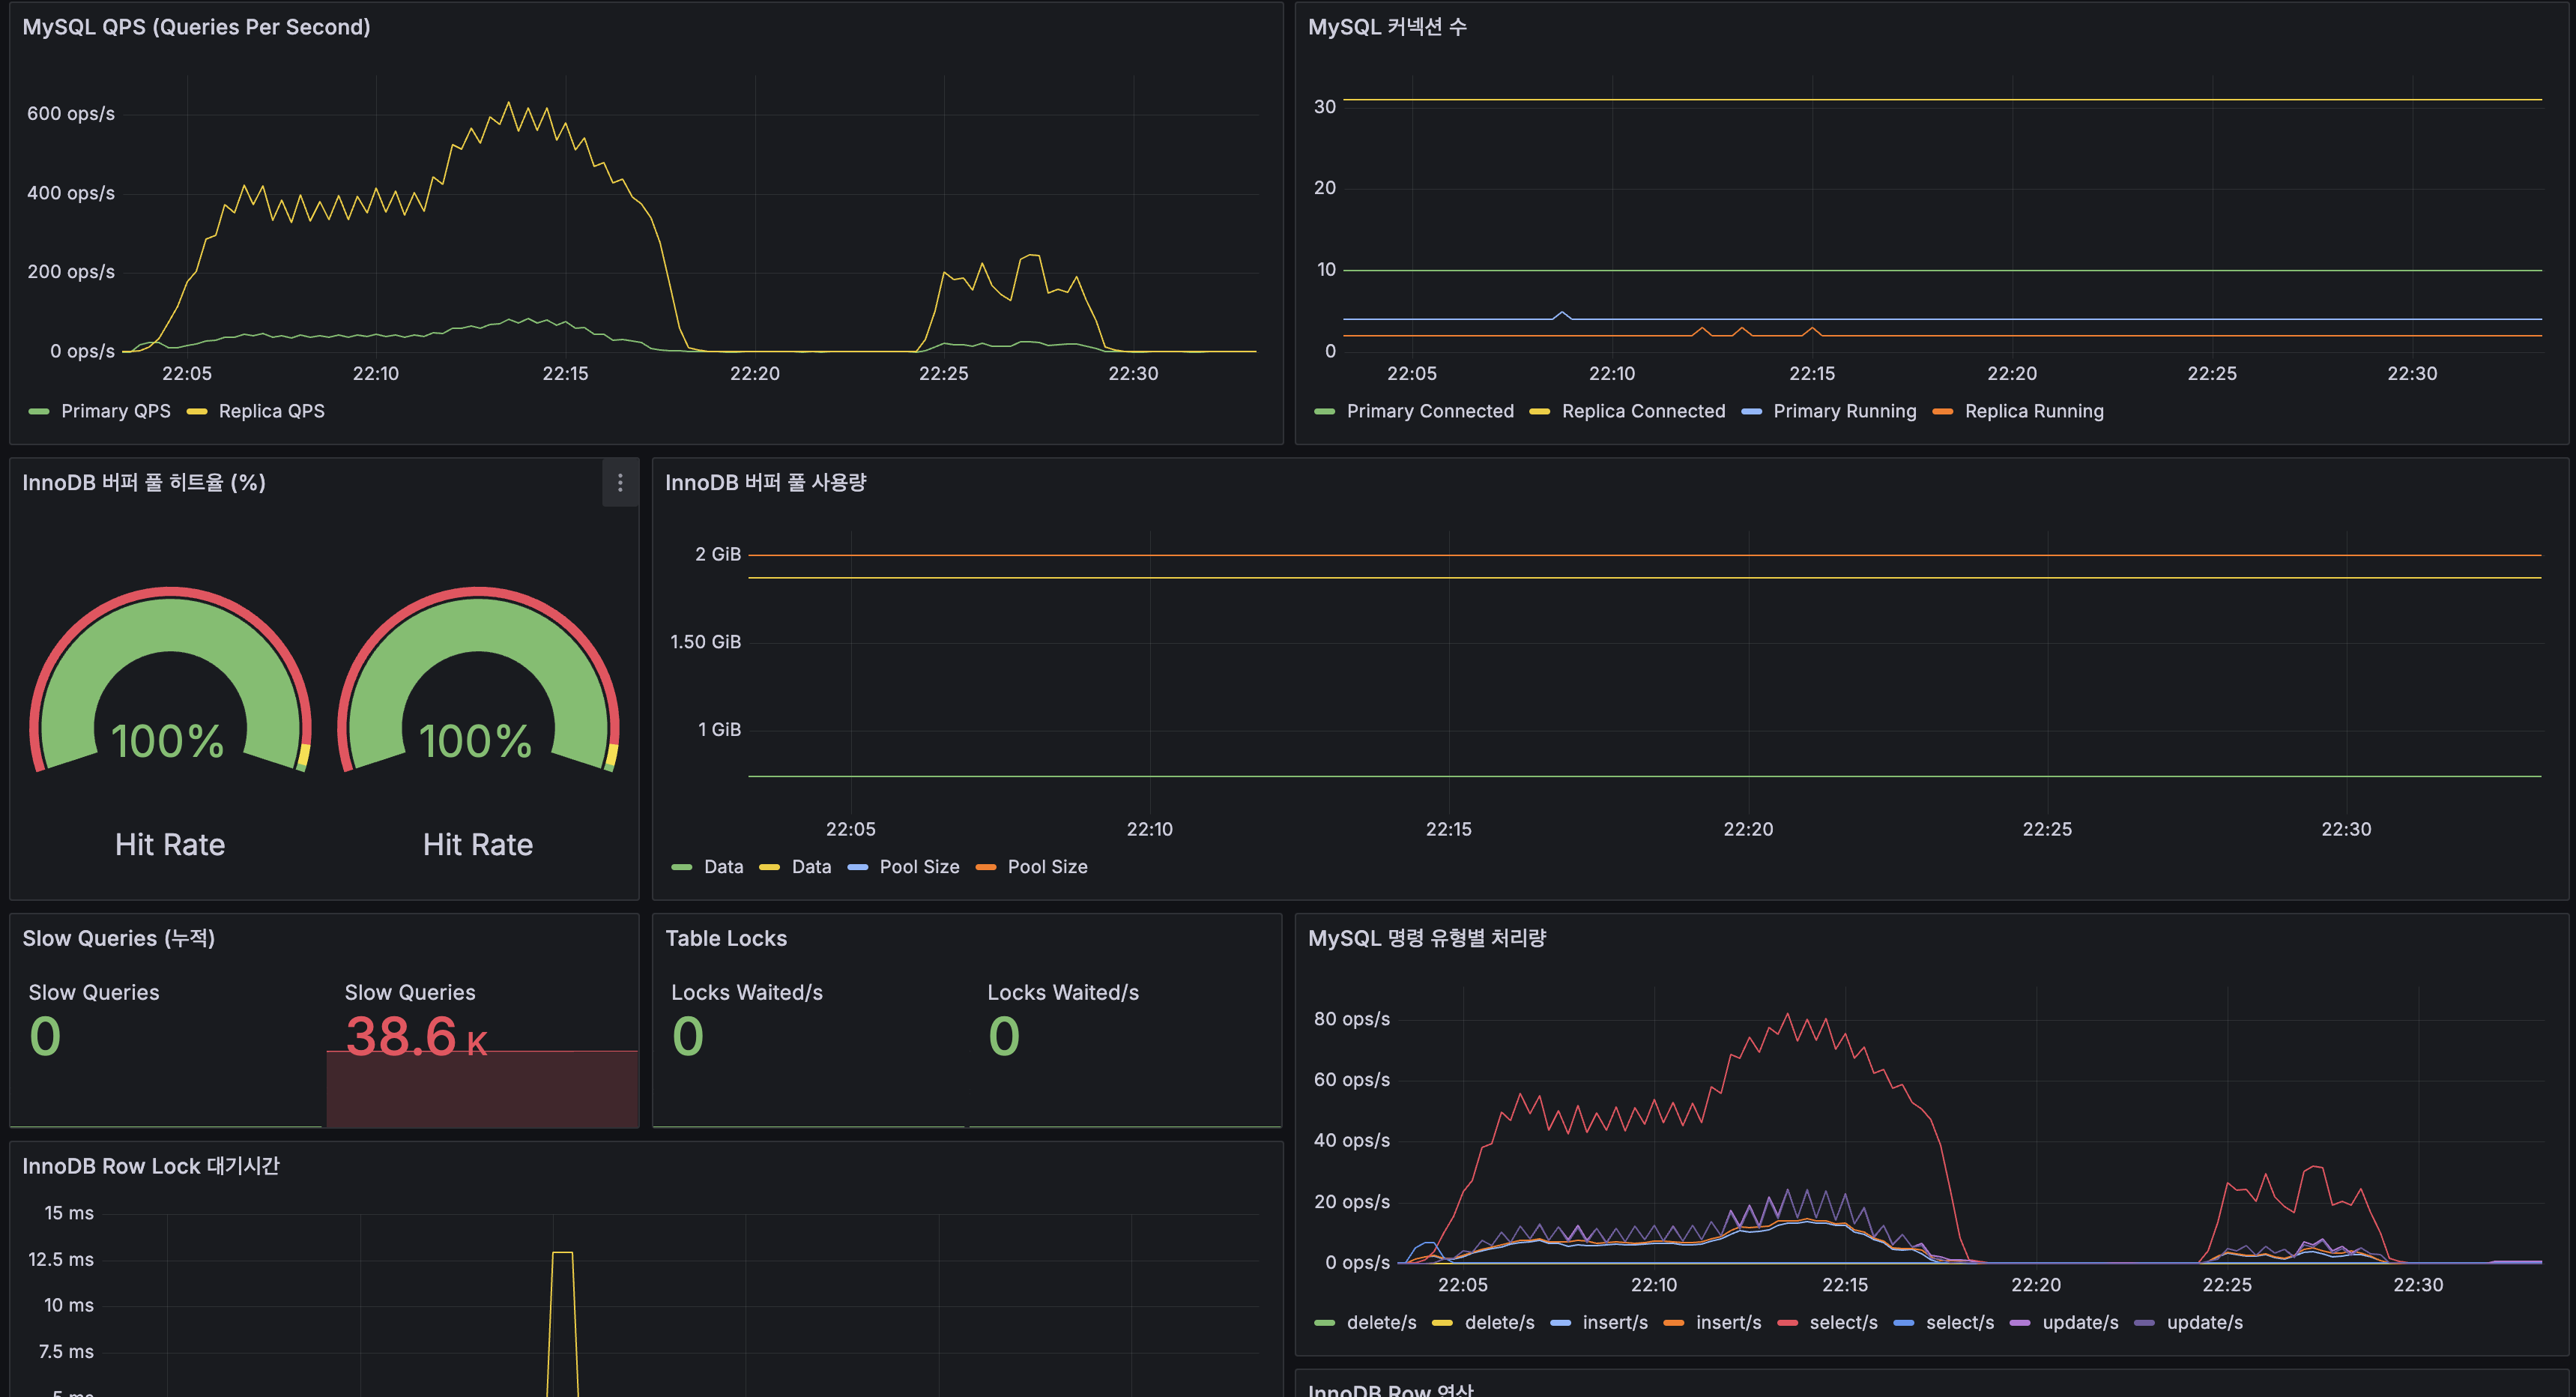
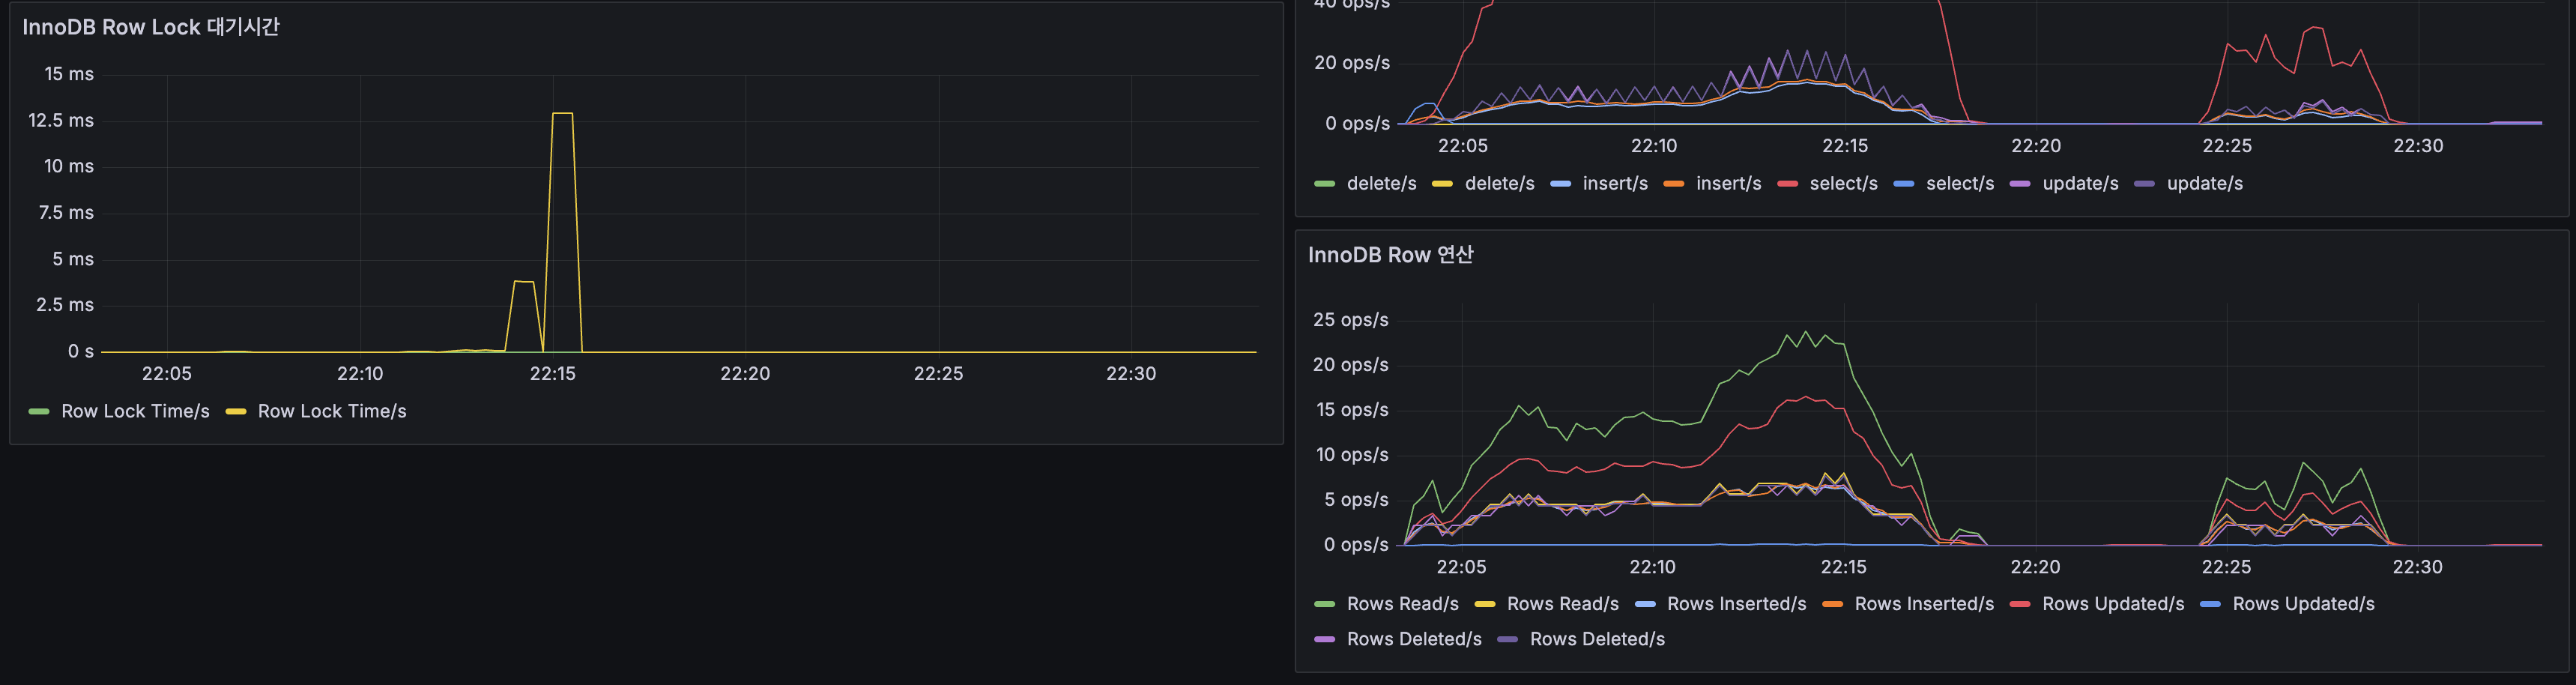
| MySQL | InnoDB 히트율 100%, Slow Query 0 (Primary), Row Lock 12ms 1회 | No |
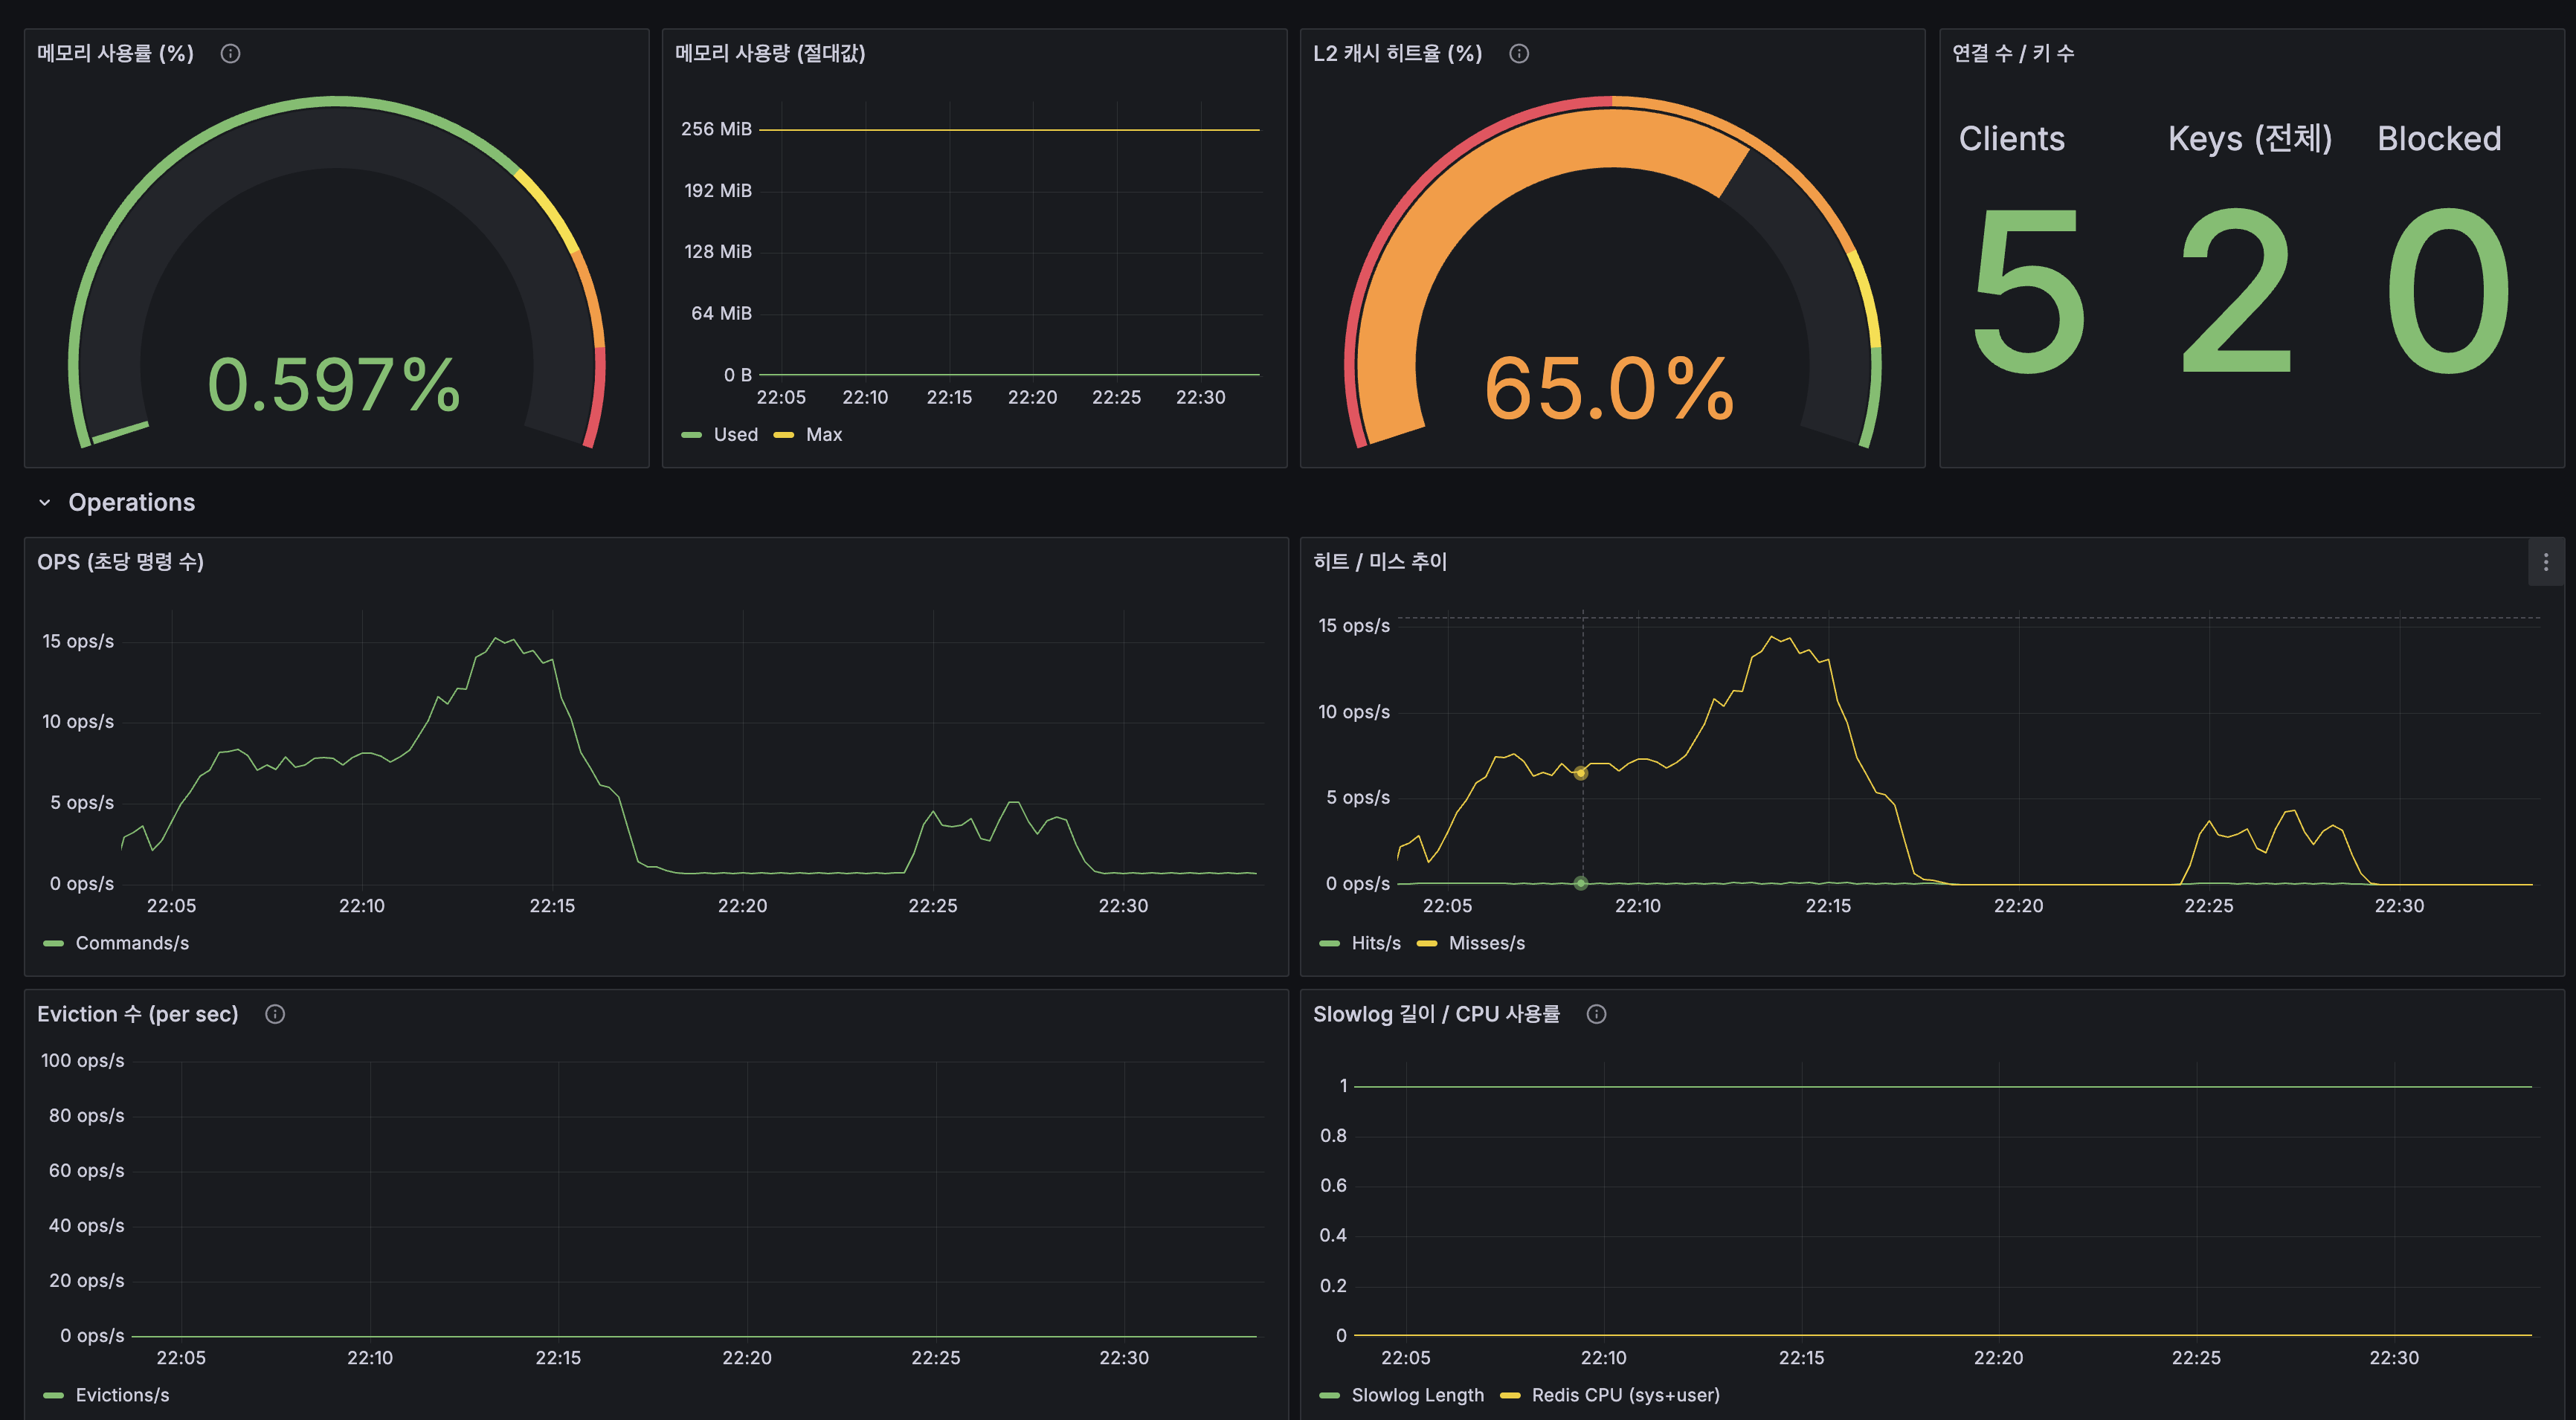
| Redis | OPS 50 ops/s (한계 10만), 메모리 0.6%, Eviction 0, Slowlog 0 | No |
| Kafka | Consumer Lag 일시 3K → 0 수렴, CDC Lag ~40ms | No (일시적) |
| Nginx | Active 200+, 자체 CPU 미미 | No (앱 대기) |
| 네트워크 | TTFB 3.95s로 서버 응답 대기가 대부분 | No (CPU의 결과) |
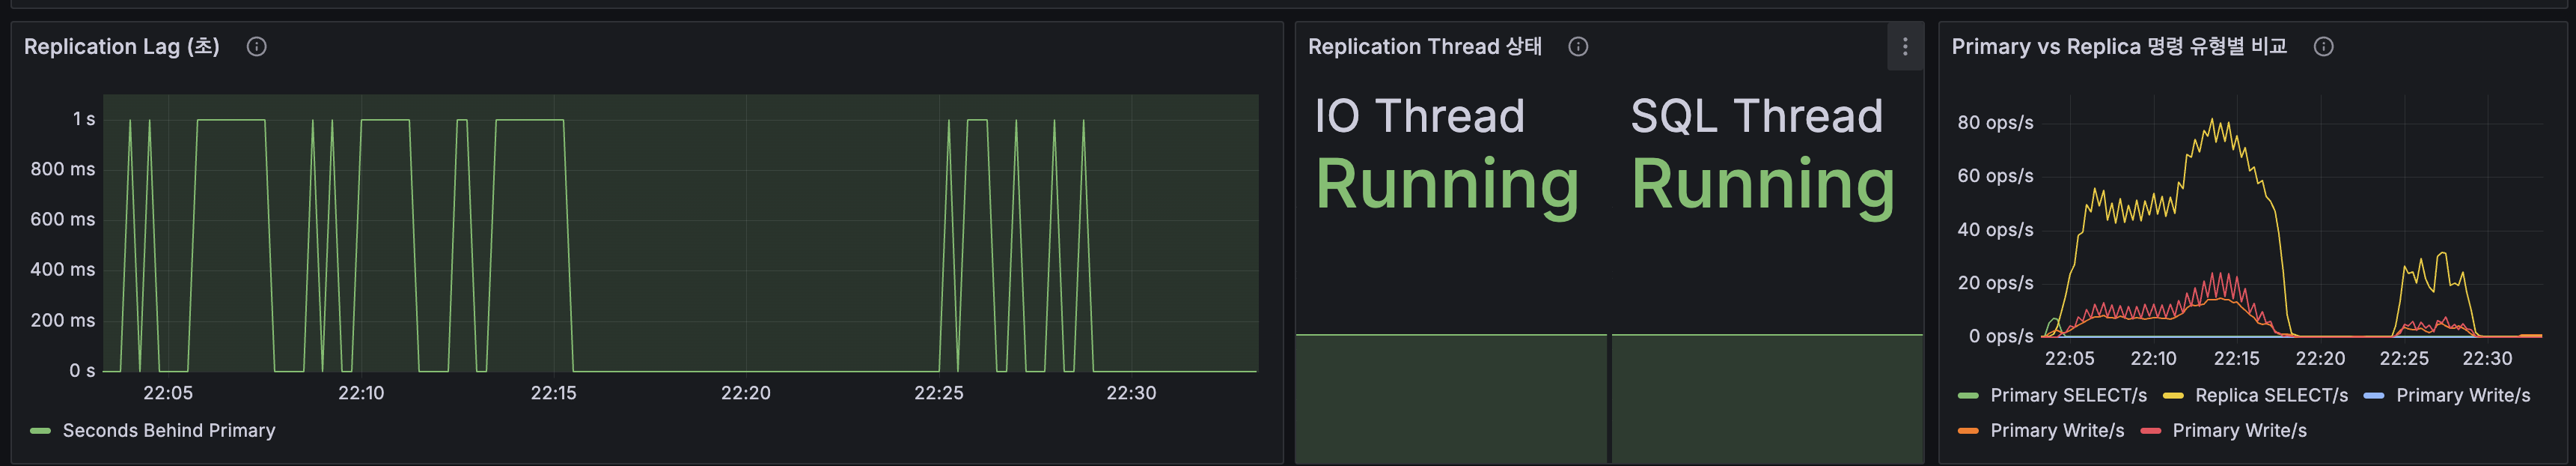
| Replication | Lag 0~1초, IO/SQL Thread Running | No |
stress 테스트(단일 서버)와 동일한 결론: 병목은 App CPU (Lucene BM25 스코어링 + Nori 형태소 분석)이다. App 스케일아웃에서 App 2대로 확장하여 100 VU에서 CPU 50%로 안정화했지만, 200 VU에서 다시 CPU 포화에 도달한다.
200+ VU를 지원하려면
| 대안 | 효과 | 실현 가능성 |
|---|---|---|
| App 3대로 확장 | CPU 4→6코어, ρ ≈ 0.67 (200 VU) | OCI Free Tier 한도 초과 |
| 캐시 히트율 개선 | Origin 조회 감소 → CPU 절감 | L2 65% → 80%+ 가능 (TTL 조정) |
| 상세 조회 캐시 강화 | 가장 느린 시나리오(P95 2.3s) 개선 | postDetail L1/L2 히트율 개선 여지 |
6. Grafana 대시보드
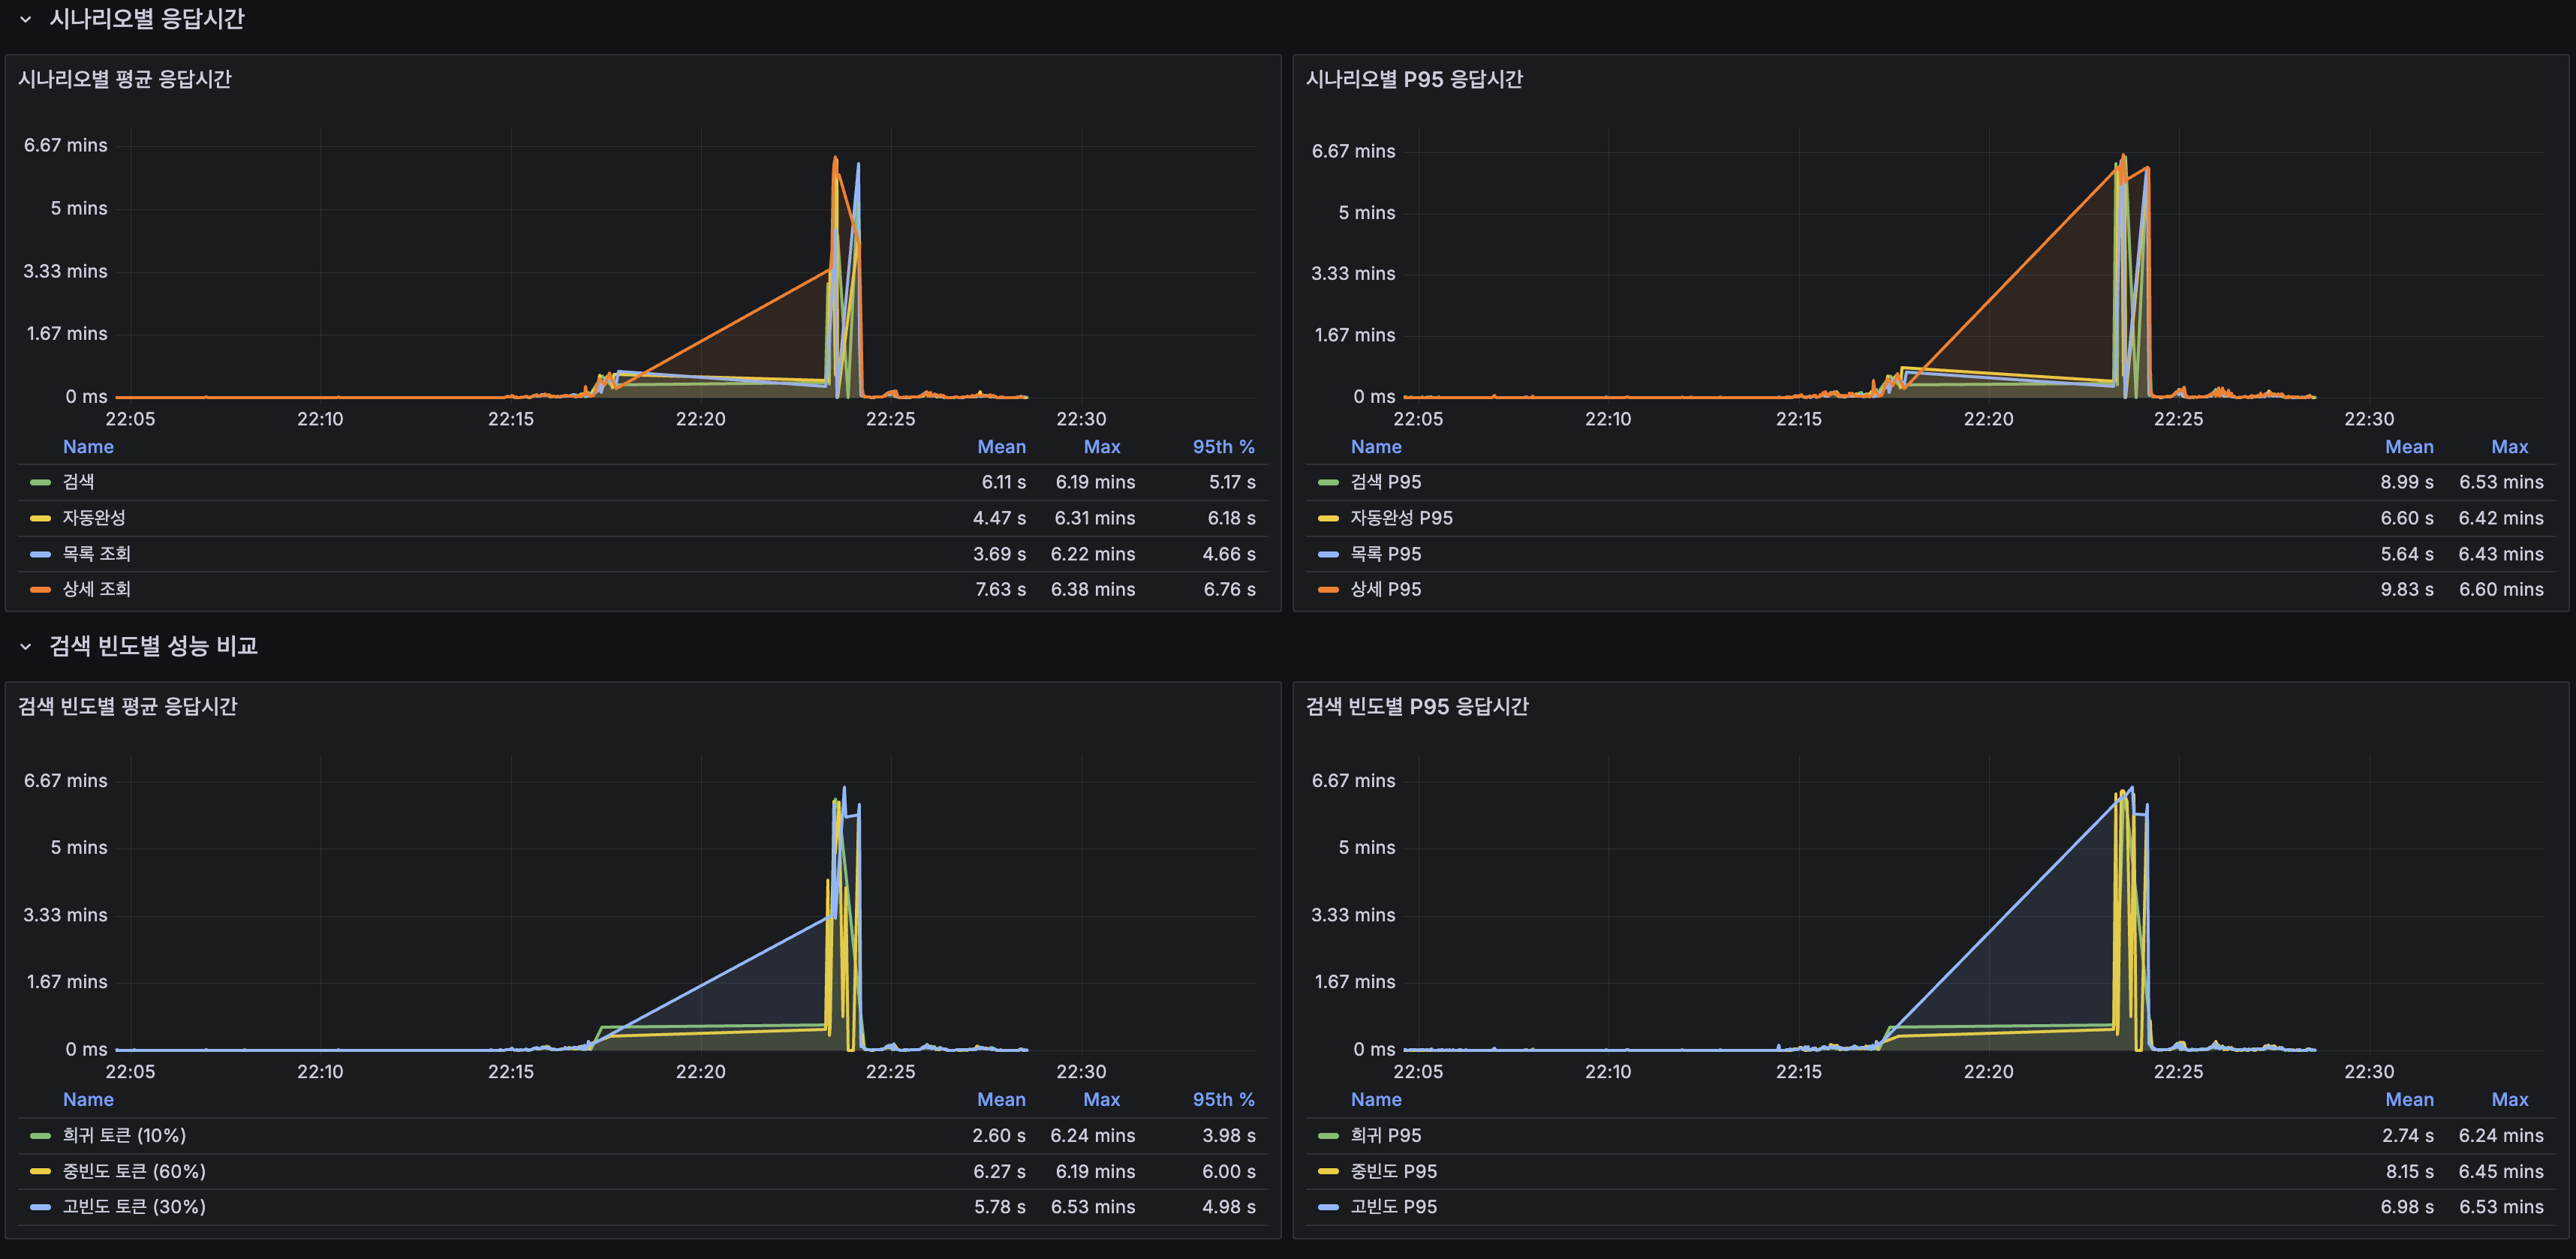
시나리오별 응답시간
- 200 VU 구간에서 모든 시나리오가 동시에 악화된다. 특정 API 하나가 병목이라기보다 시스템 전체가 CPU 포화에 빠졌다는 신호다
- 상세 조회(P95 9.83s)가 가장 느림. origin hit(Lucene + MySQL) 비율이 높기 때문
- 희귀 토큰(10%) 검색이 고빈도(30%) 대비 빠름. 고빈도 토큰은 매칭 문서가 많아 BM25 스코어링 비용이 큼
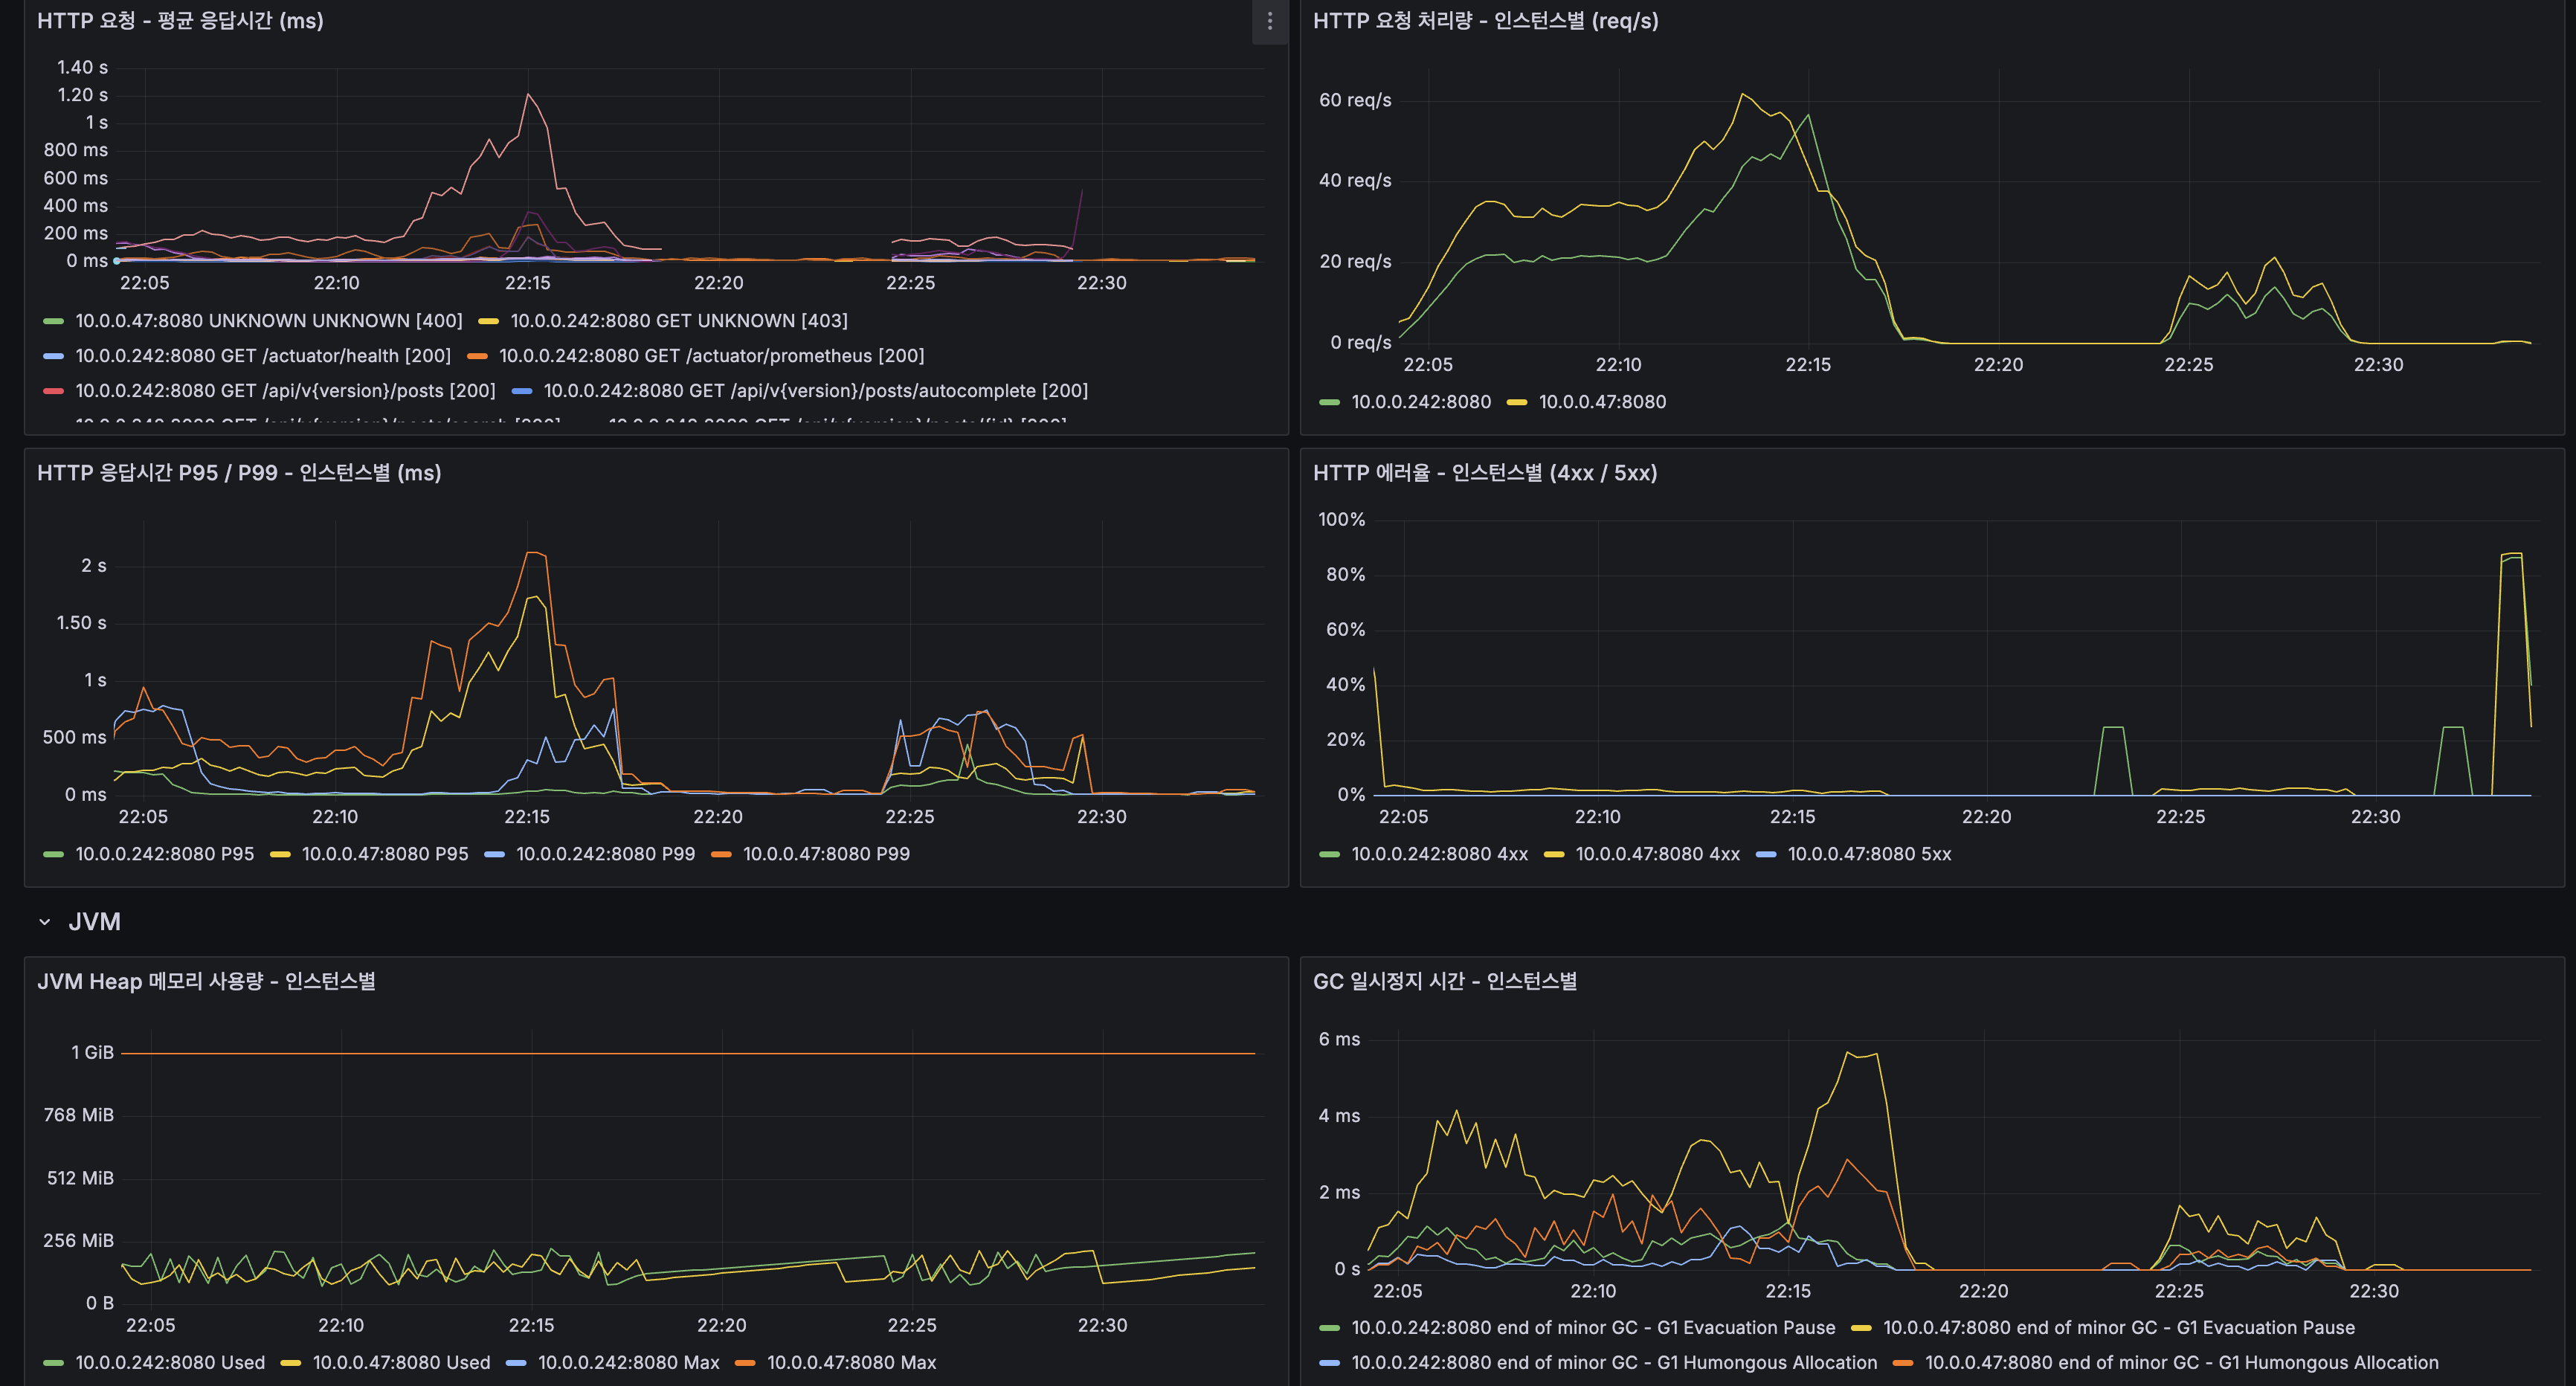
Spring Boot HTTP + JVM
- Heap: 두 인스턴스 모두 ~200-300MB 사용, 1G 한도 내 안정
- GC Pause: 100 VU에서 ~0.5ms, 200 VU 진입 시 6ms까지 상승하며 G1 Evacuation Pause 증가
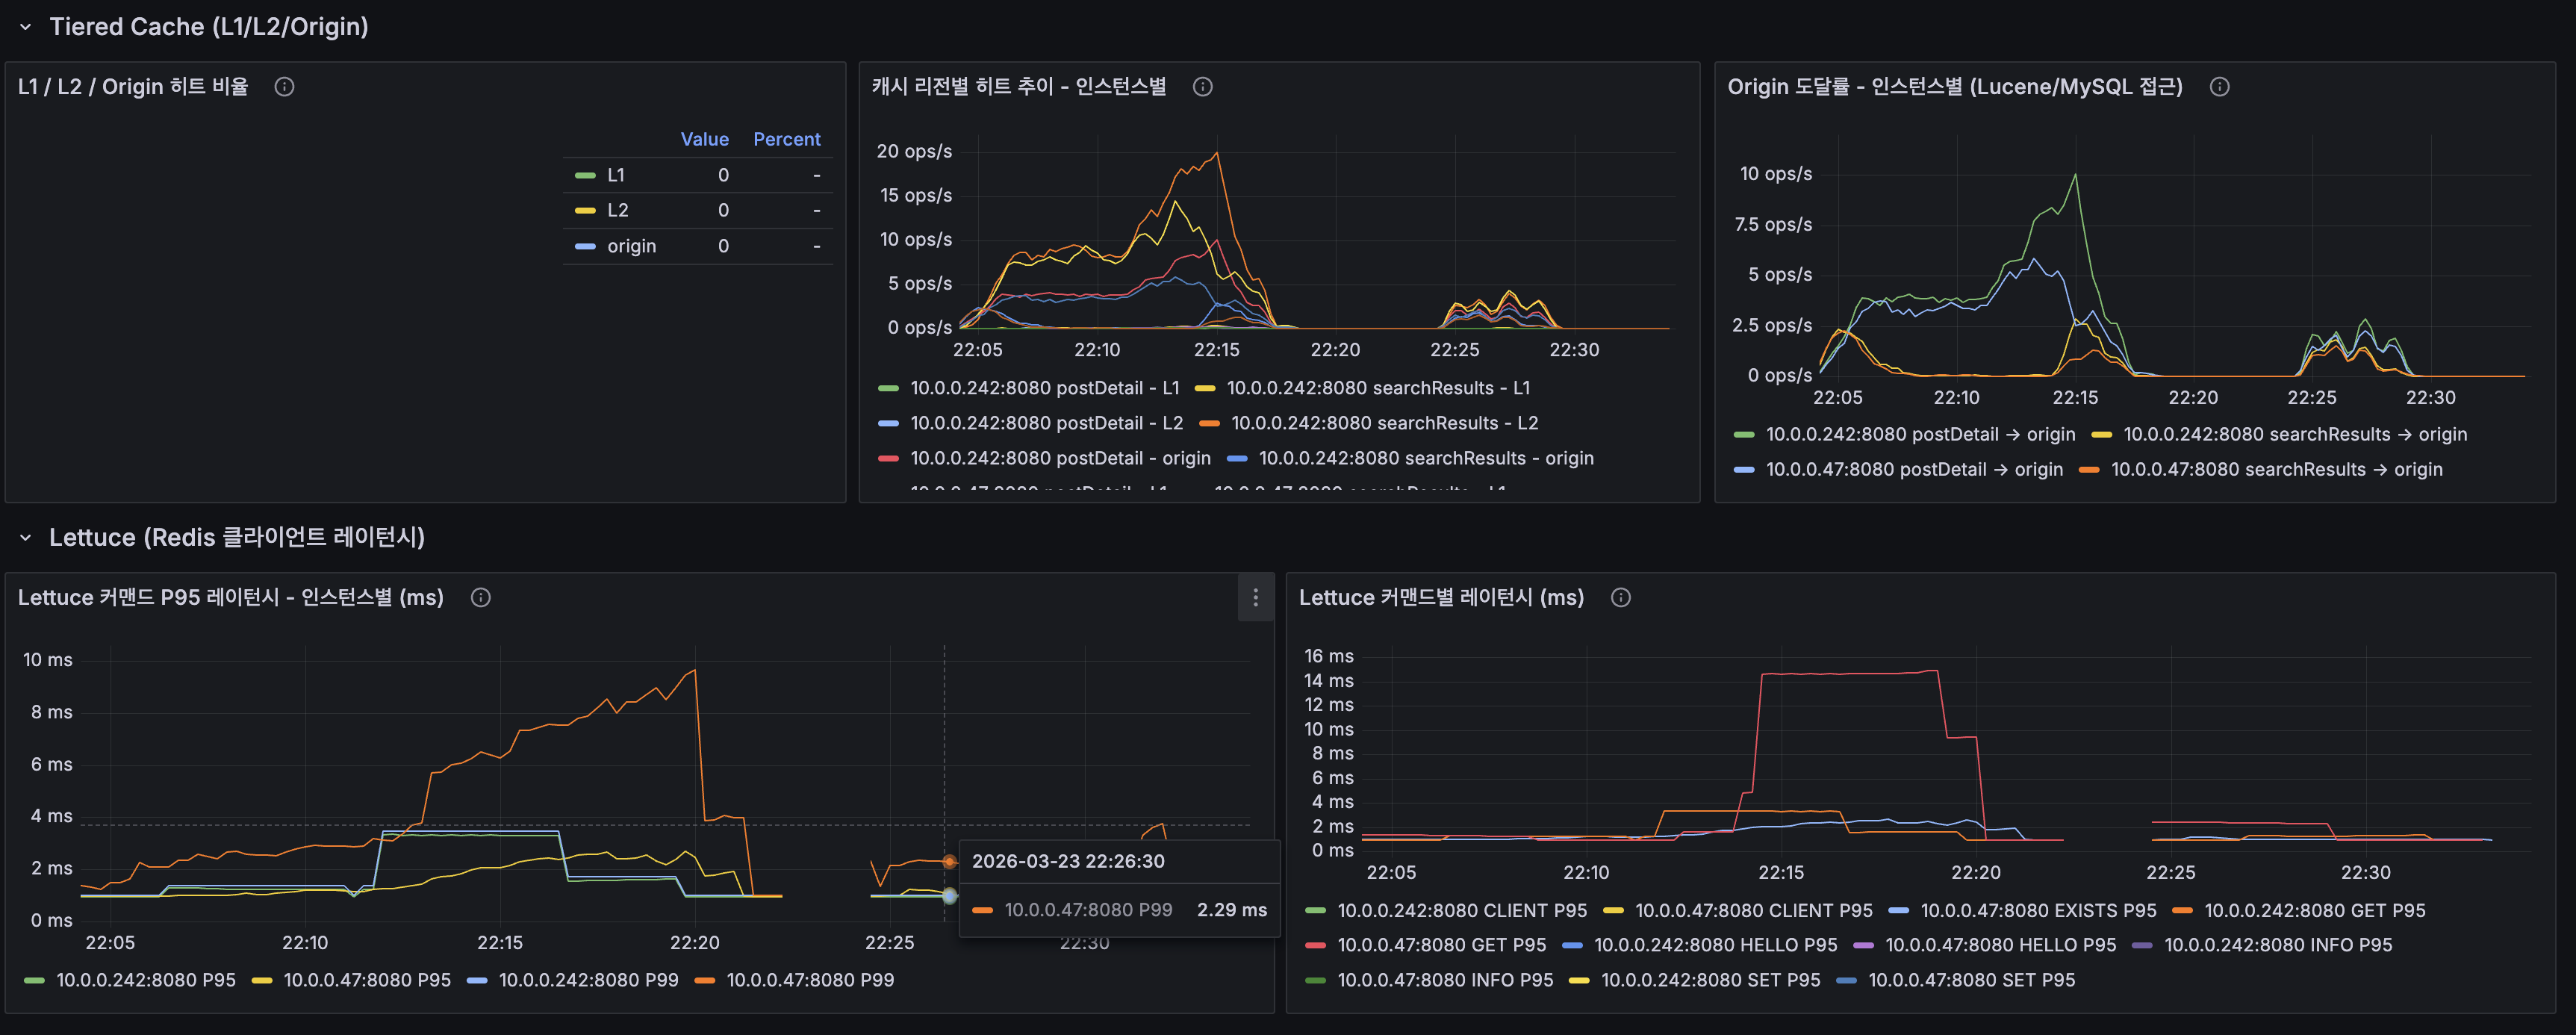
Tiered Cache + Lettuce
- Origin 도달률: 200 VU에서 10 ops/s까지 상승하며 캐시 미스 증가로 Lucene/MySQL 부하 집중
- Lettuce P95: 100 VU에서 ~2ms → 200 VU에서 10ms까지 스파이크 (CPU 경합으로 이벤트 루프 지연)
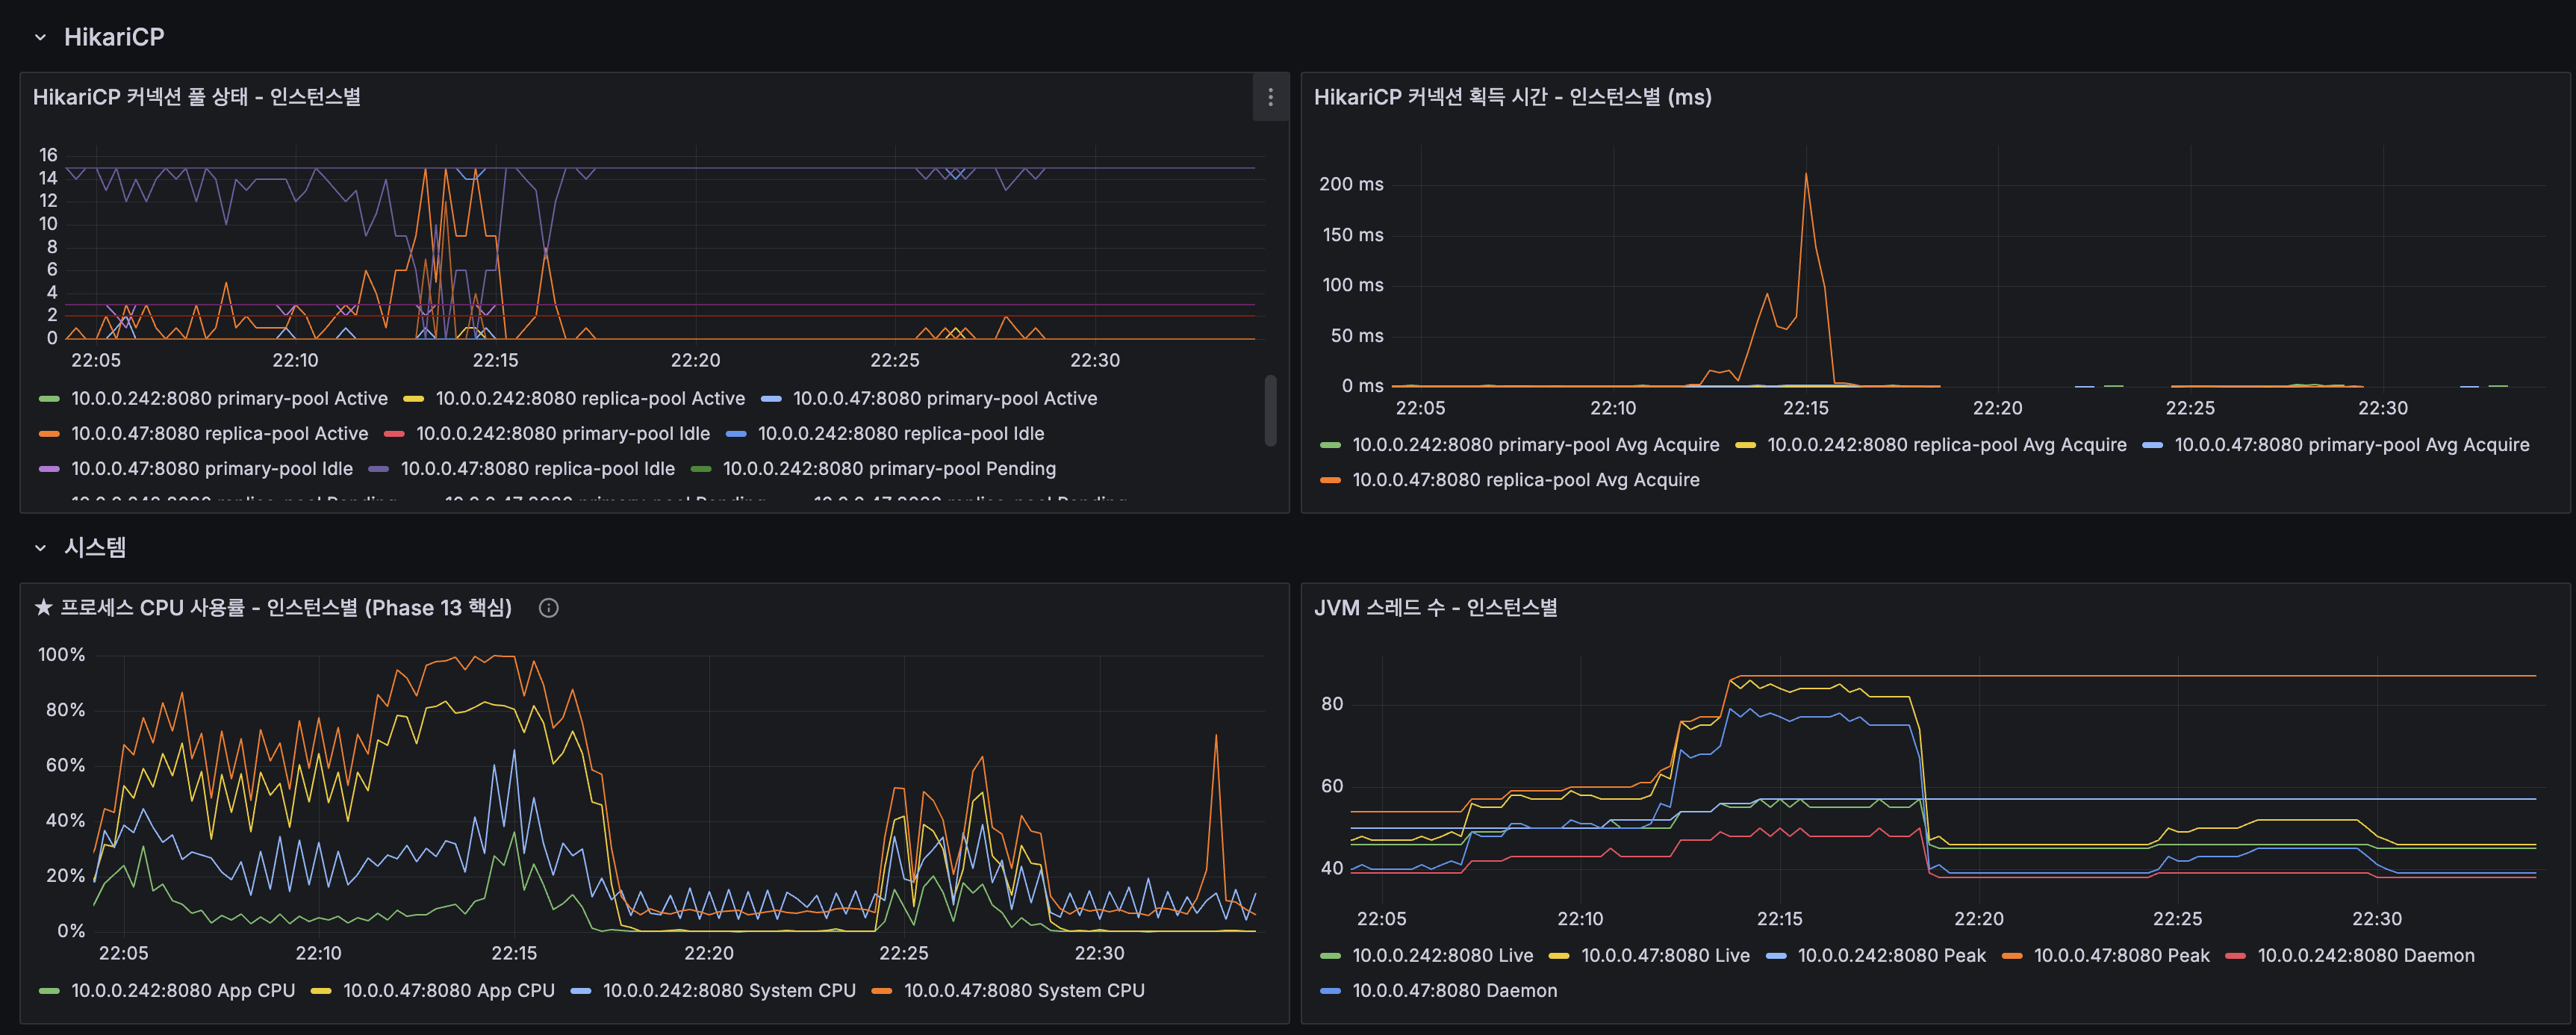
HikariCP + CPU
- Replica 풀: Active 최대 14~15까지 상승(200 VU). 읽기 부하 집중
- 커넥션 획득 시간: 200 VU 진입 직후 200ms 스파이크. CPU 포화의 증상
- App CPU: 100 VU에서 ~40-60%, 200 VU에서 80-100%로 병목 확인
컨테이너별 리소스
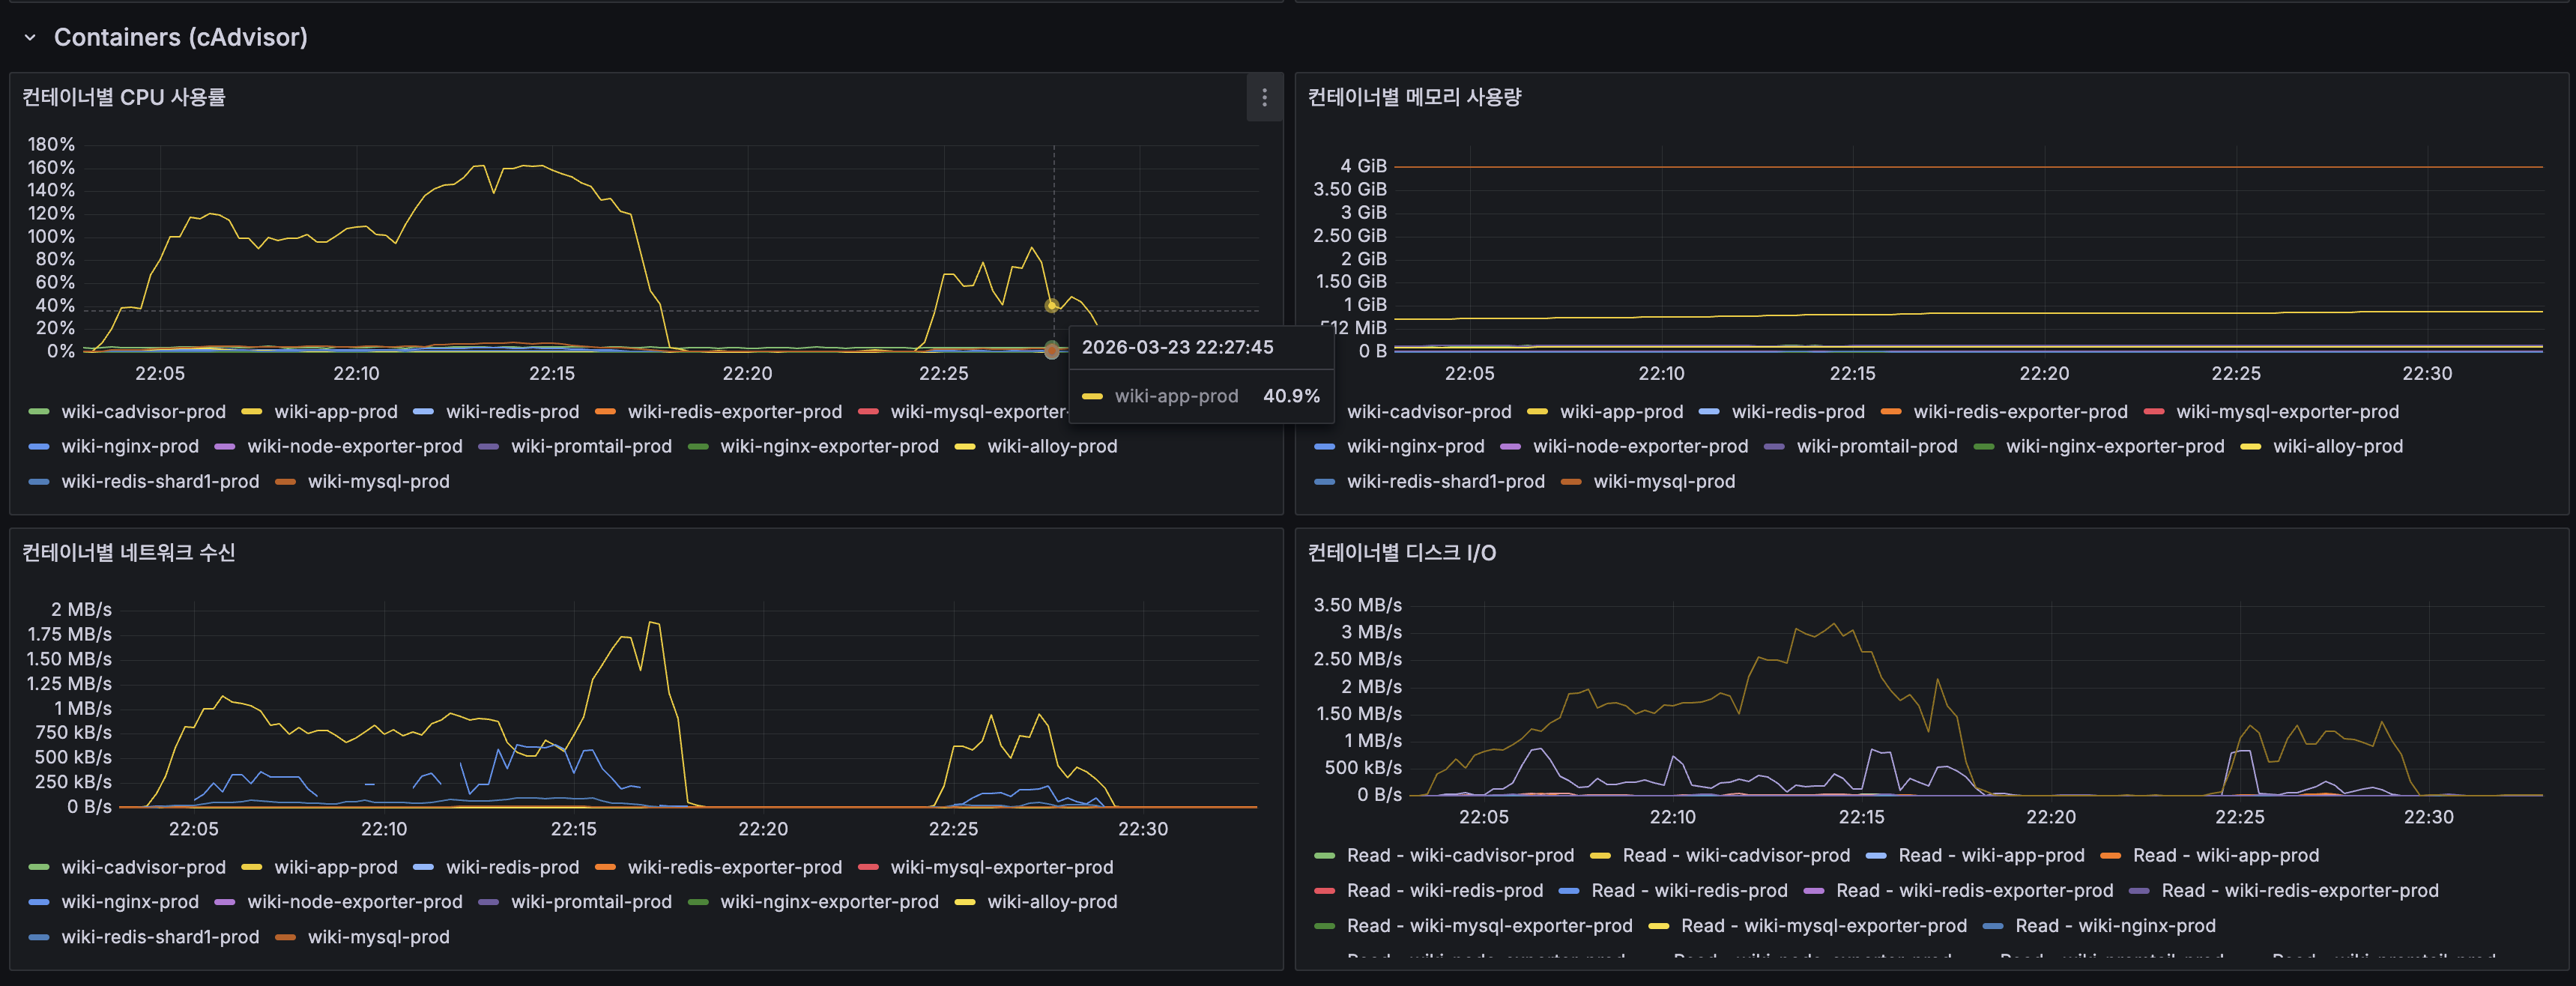
- wiki-app-prod CPU: 피크 180% (2코어 기준)
- wiki-mysql-prod CPU: 거의 0%, DB는 병목이 아님
- 메모리: App ~1G, MySQL ~3.5G로 안정적, OOM 위험 없음
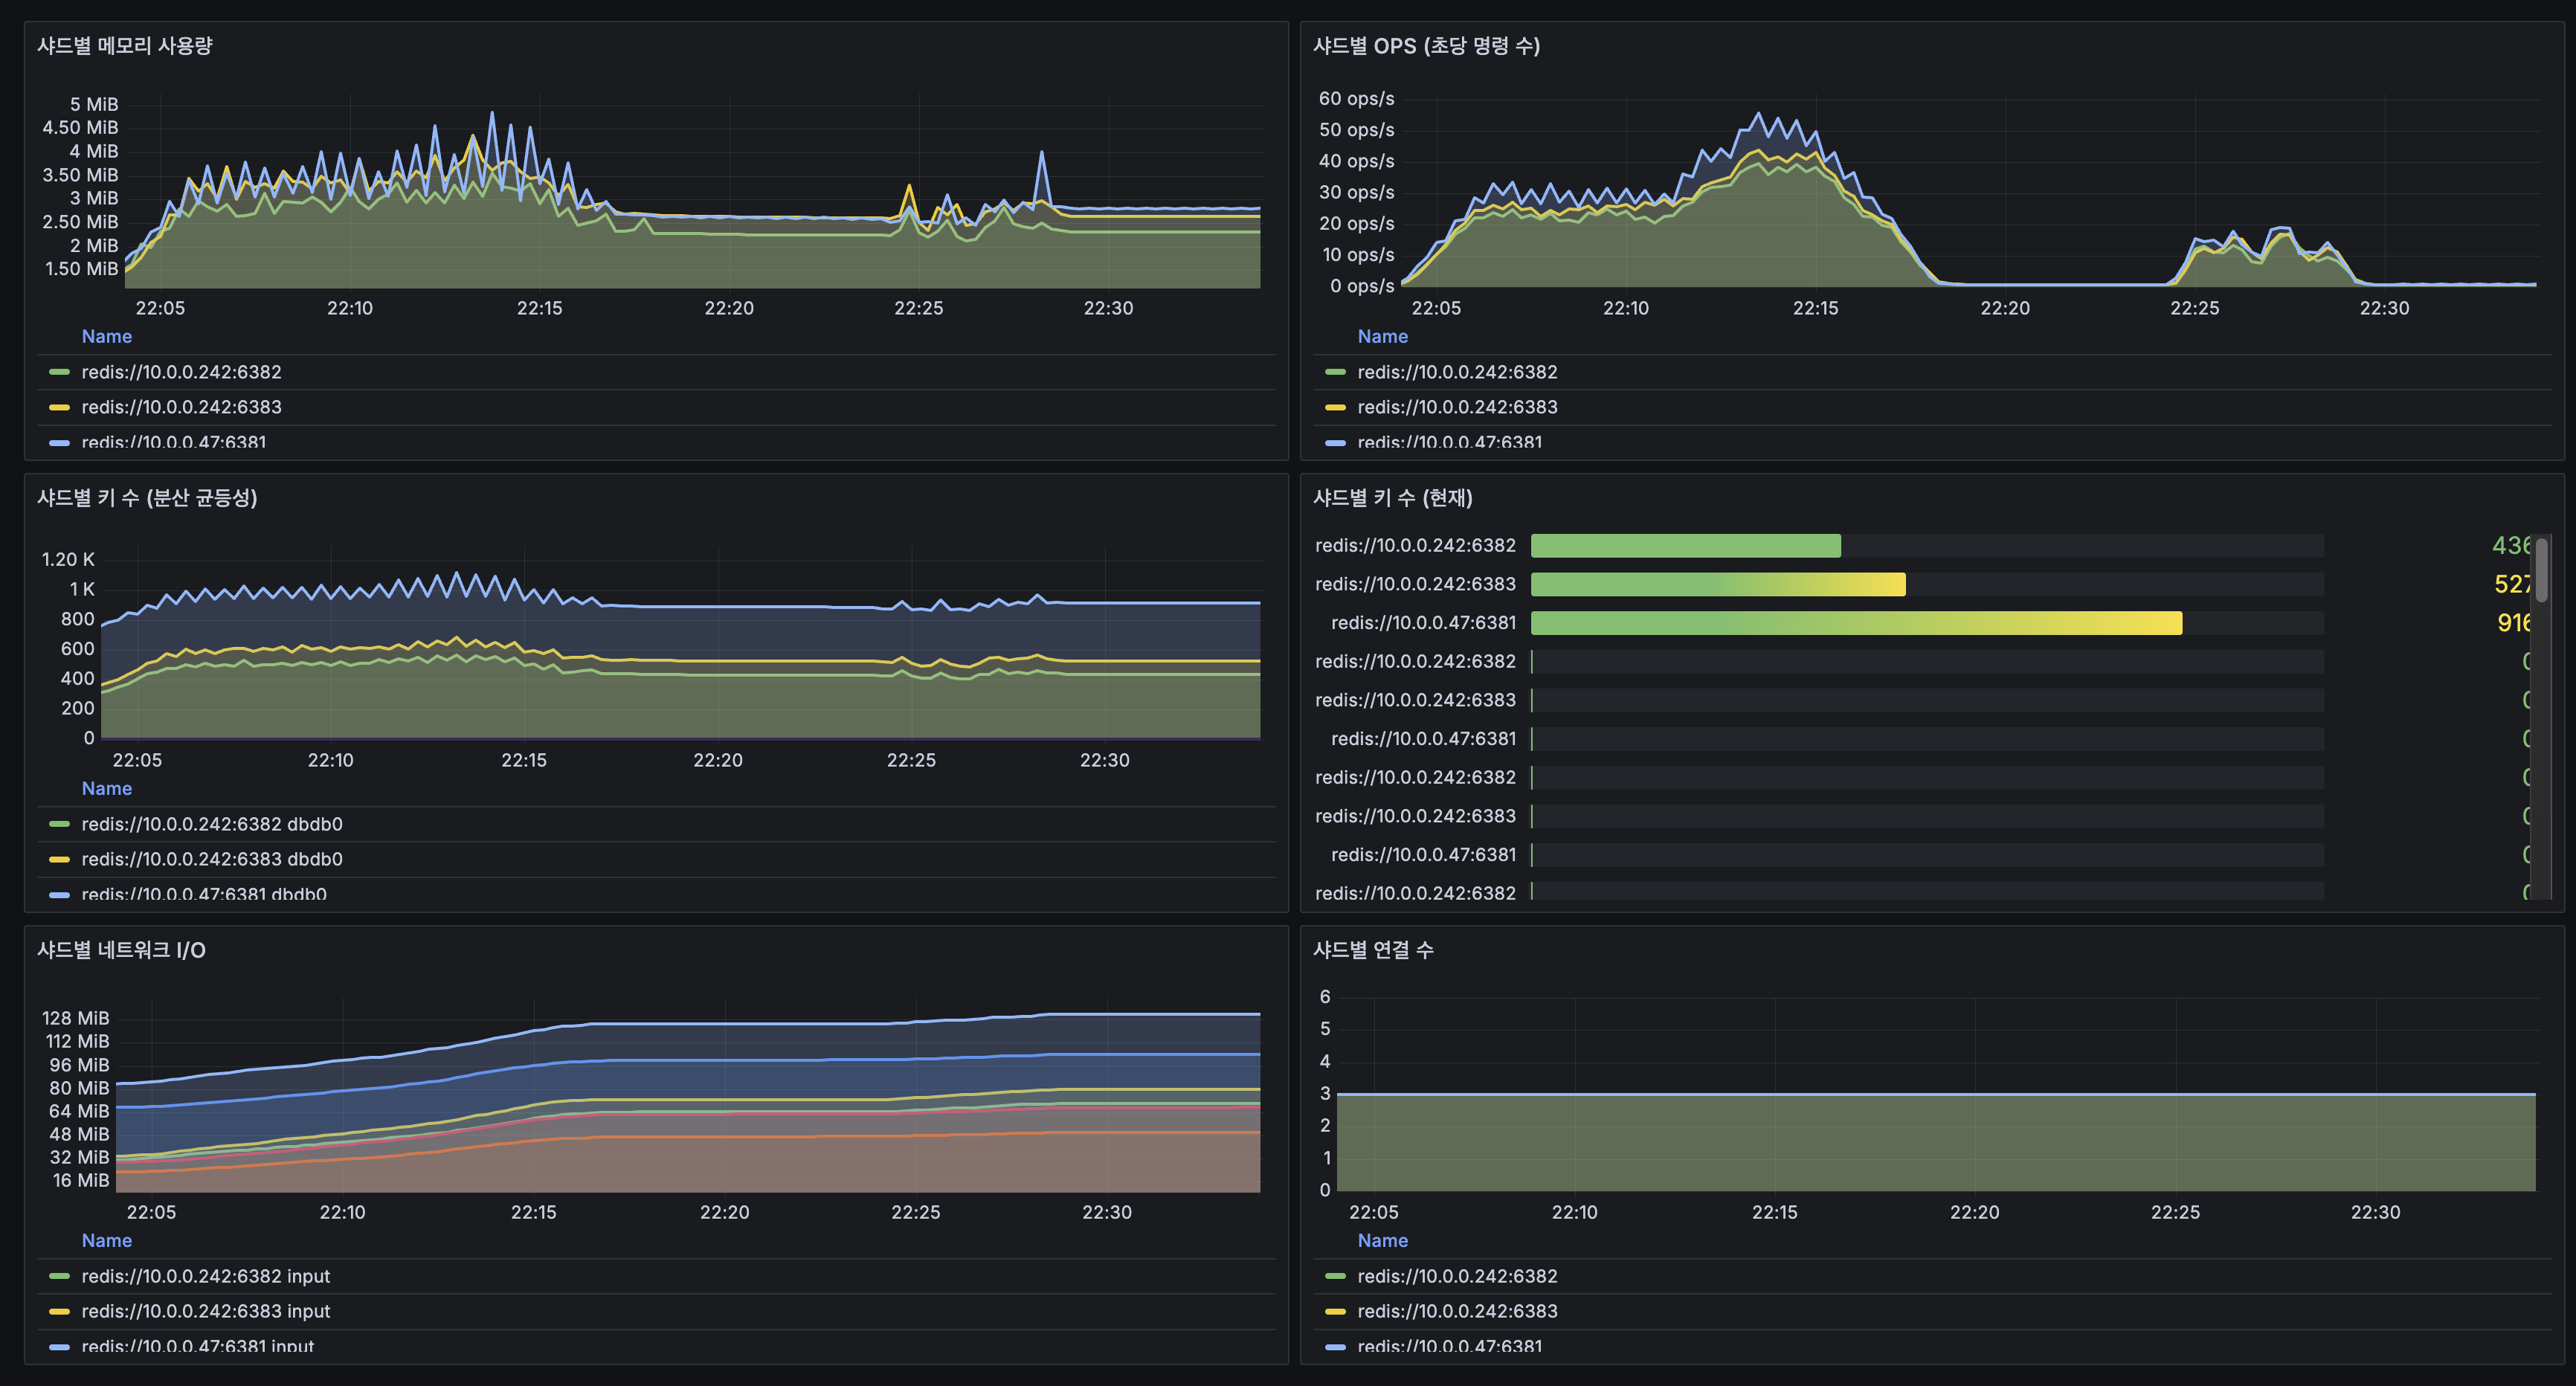
Redis 샤드별
- OPS: 200 VU에서 50 ops/s로 여유 (Redis 한계 10만 ops/s)
- 키 수: shard-1 916개, shard-2 436개, shard-3 527개
- 연결 수: 각 샤드 3개
Redis 통합
- 메모리 사용률: 0.597%로 극도로 여유
- L2 캐시 히트율: 65.0%. stress 부하로 cold query 비율 증가
- Eviction: 0, Slowlog: 0
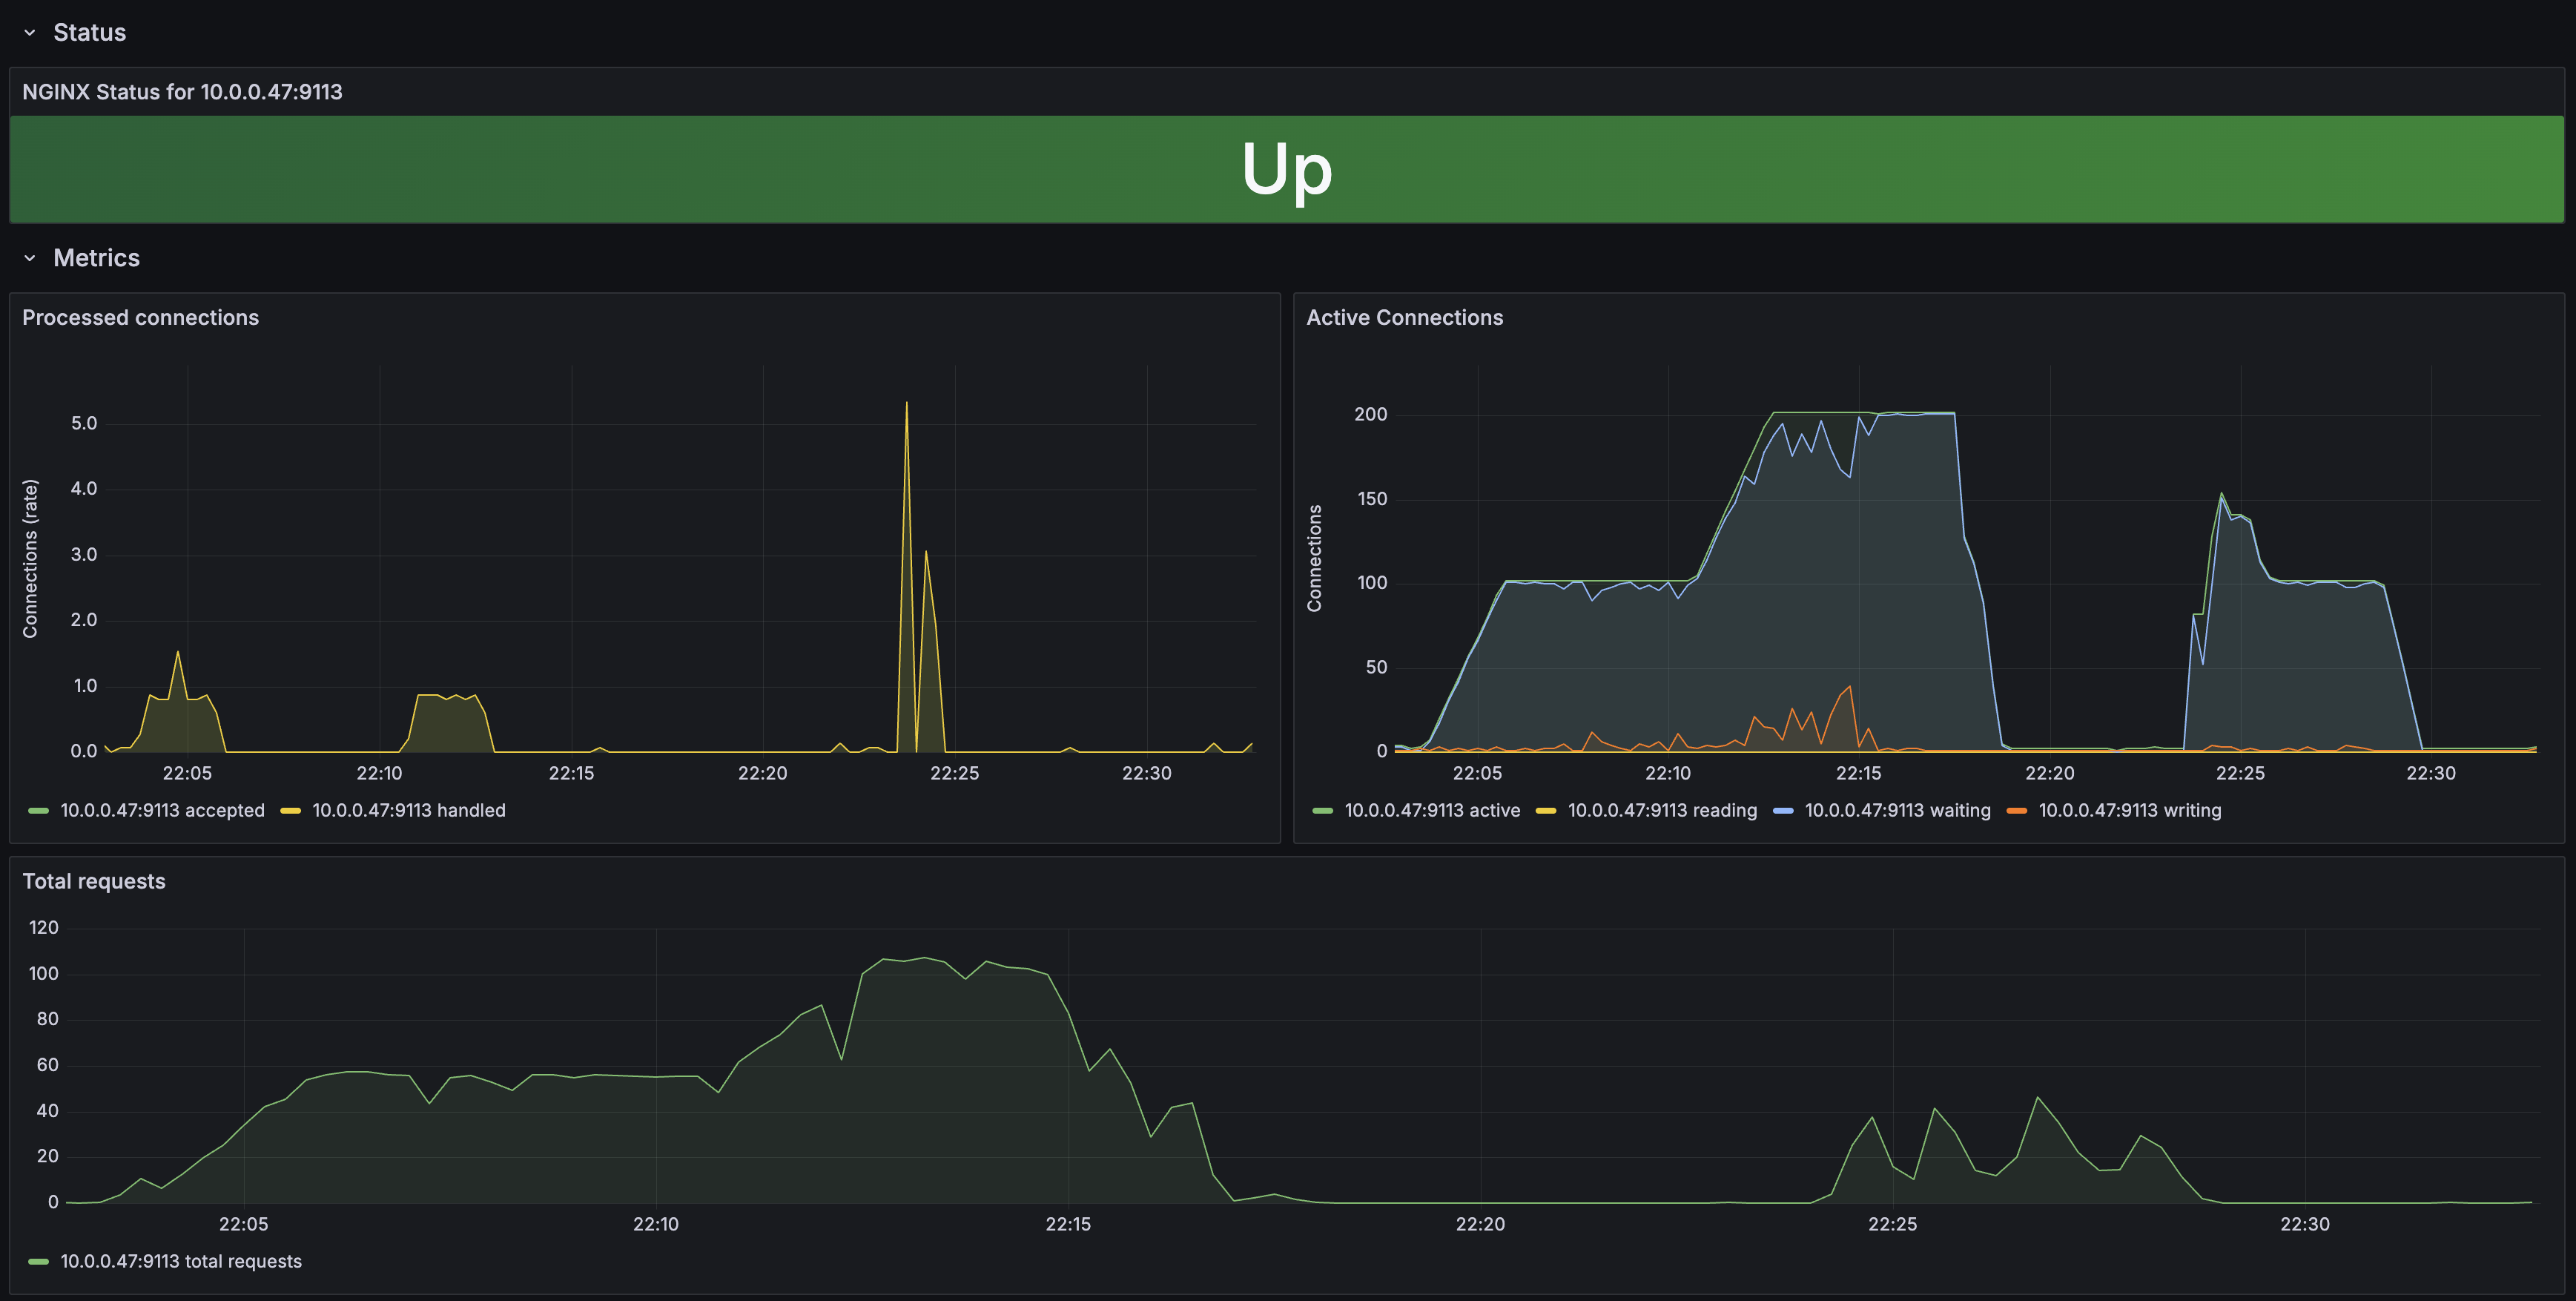
Nginx
- Active Connections: 200 VU에서 200+까지 상승
- Waiting 커넥션: 200 VU에서 급증. 앱 응답 대기 중인 커넥션
MySQL
- InnoDB 버퍼 풀 히트율: Primary/Replica 모두 100%로 DB I/O 병목 없음
- Table Locks: 0
MySQL Replication
- Replication Lag: 0~1초 진동으로 정상 범위
- R/W 분리: Primary SELECT ~10 ops/s, Replica SELECT ~70 ops/s
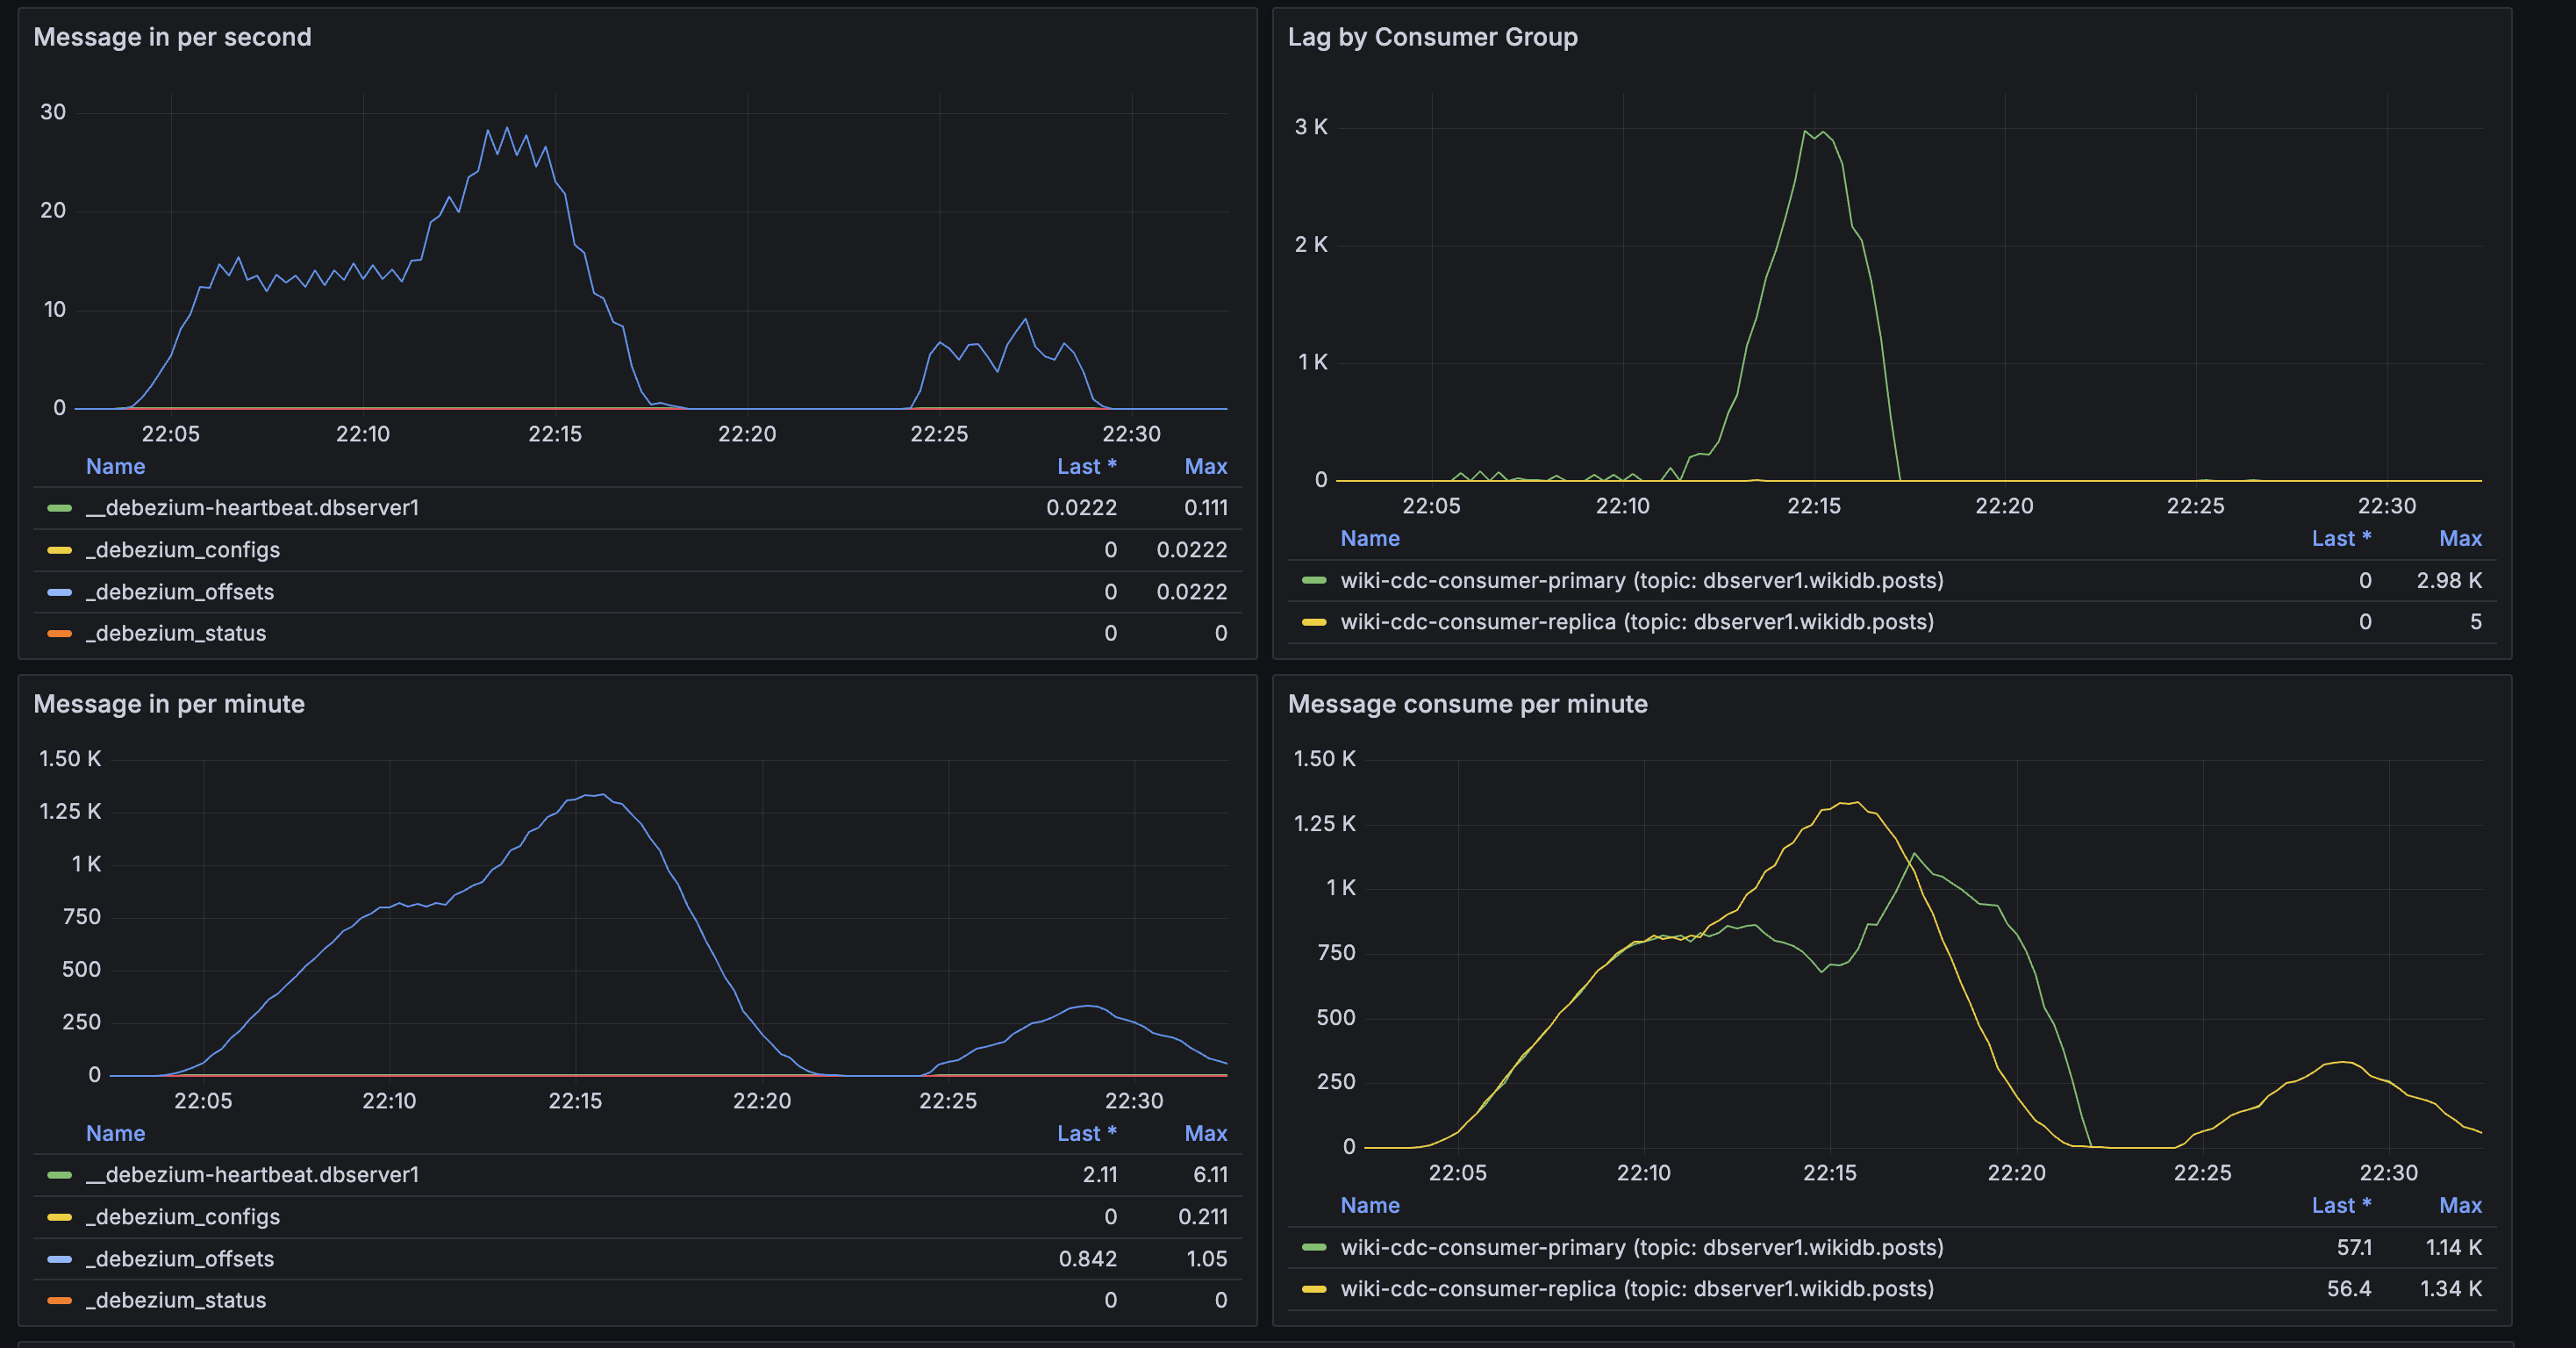
Kafka + CDC
- Consumer Lag: 100 VU에서 0, 200 VU에서 최대 ~3K까지 상승 → 이후 0으로 수렴
- 피크 메시지: ~28 msg/s
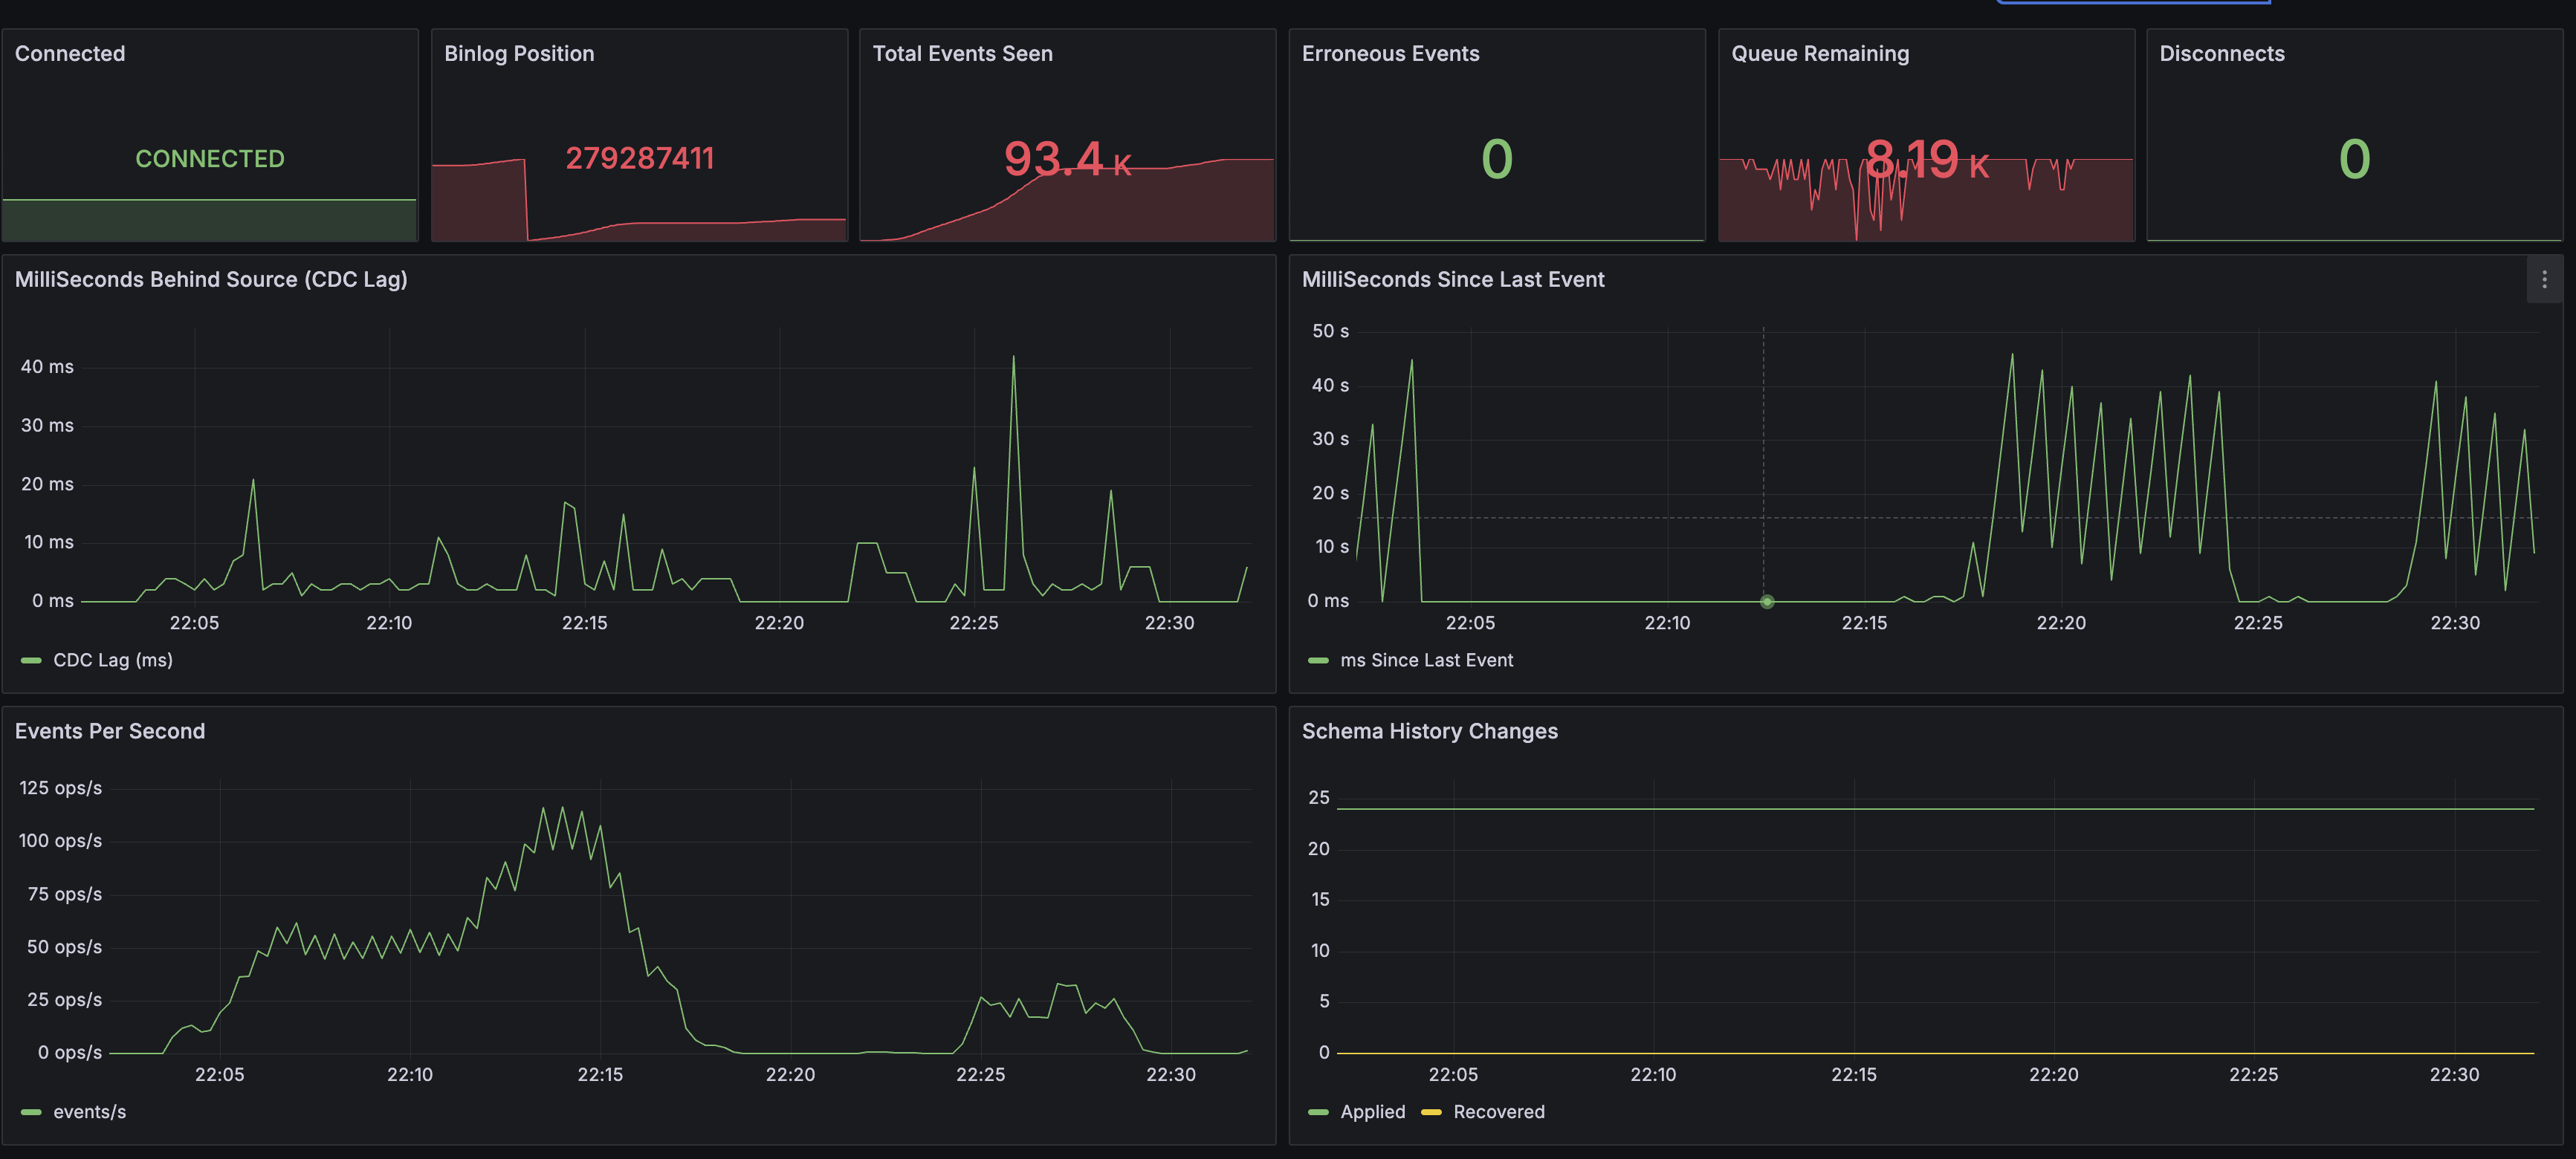
Debezium
- Connected: CONNECTED (전체 구간), Erroneous Events: 0
- CDC Lag: 피크 ~40ms로 거의 실시간
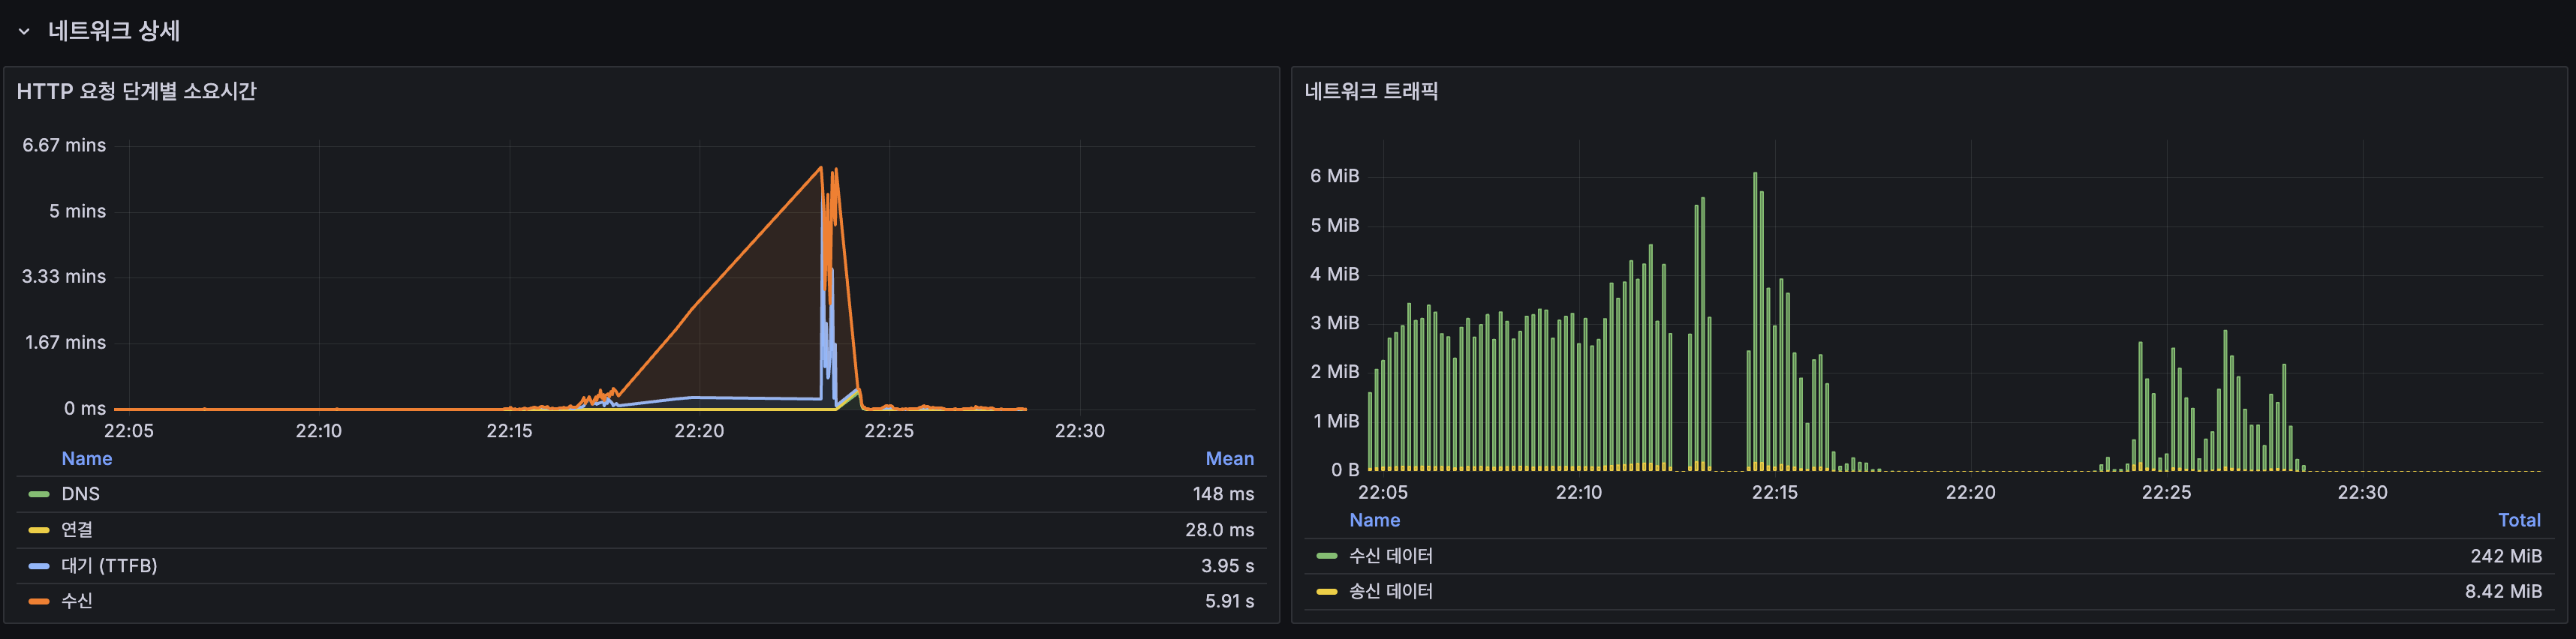
네트워크 상세
- TTFB: 3.95s, 200 VU 구간에서 서버 응답 대기가 대부분
- 총 수신 데이터: 242 MiB
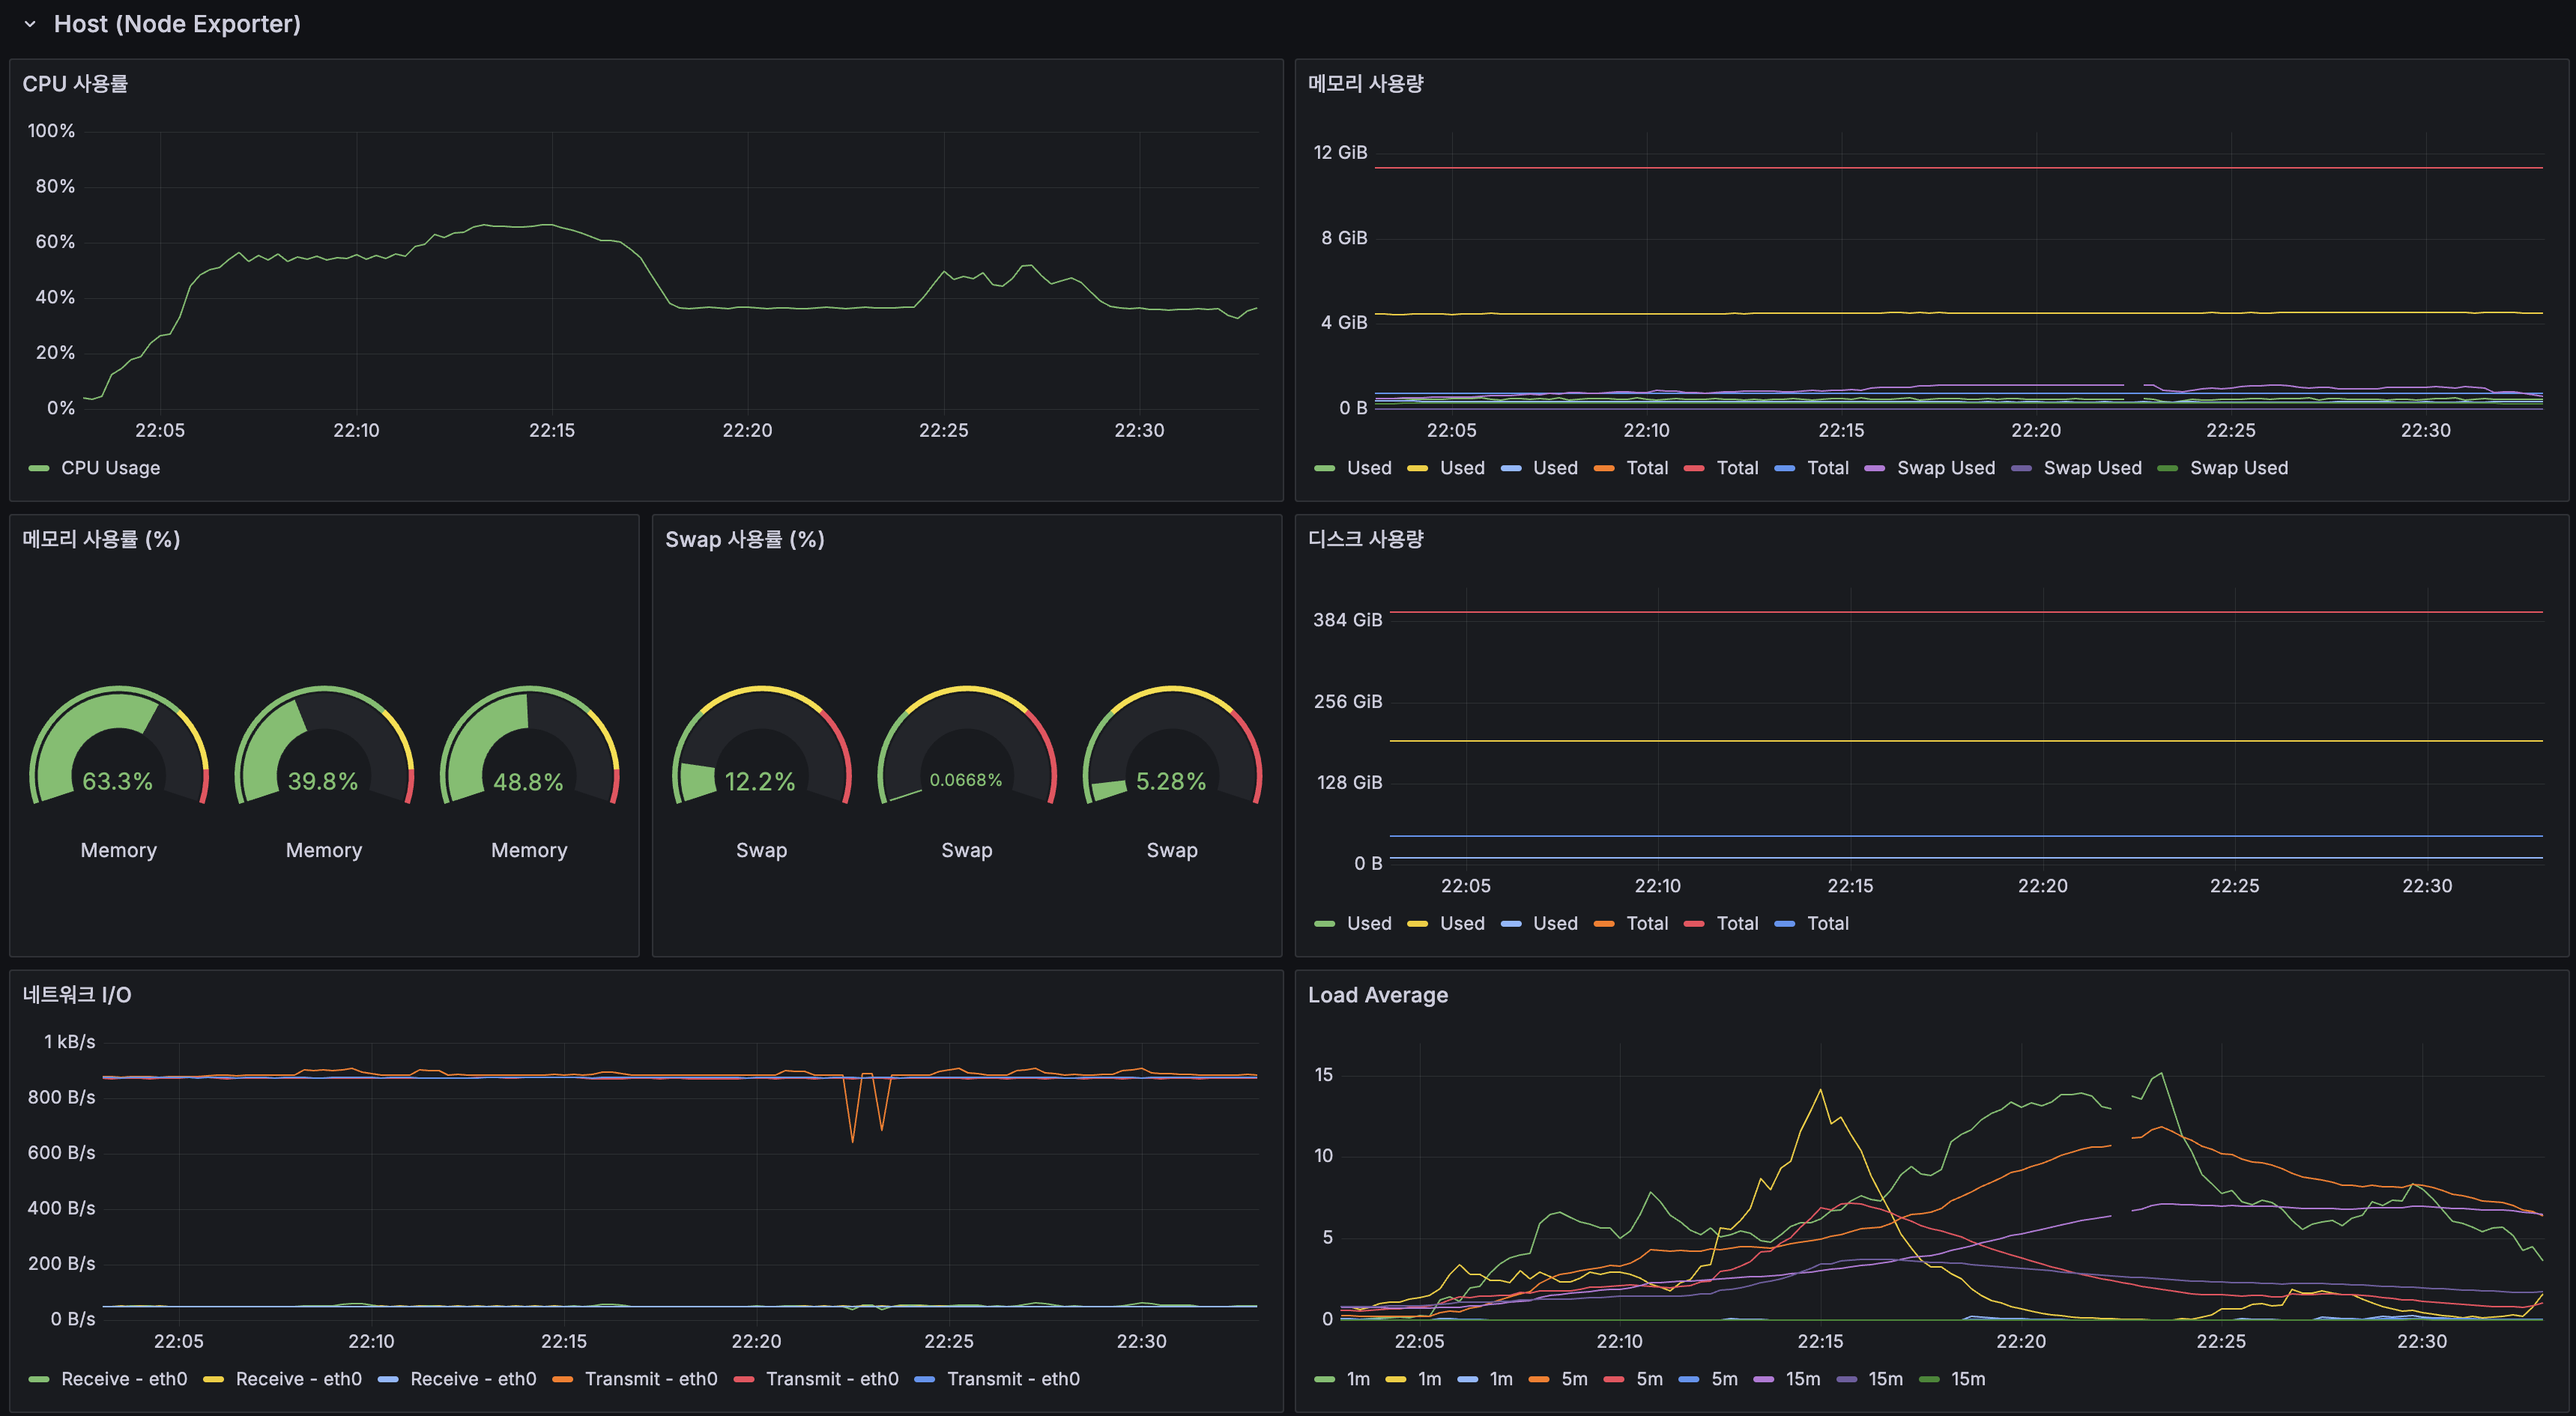
Host
- 서버 1 메모리: 63.3%, Swap: 12.2%
- 서버 1 Load Average 1m: 피크 ~15 (2코어 기준 7.5배)
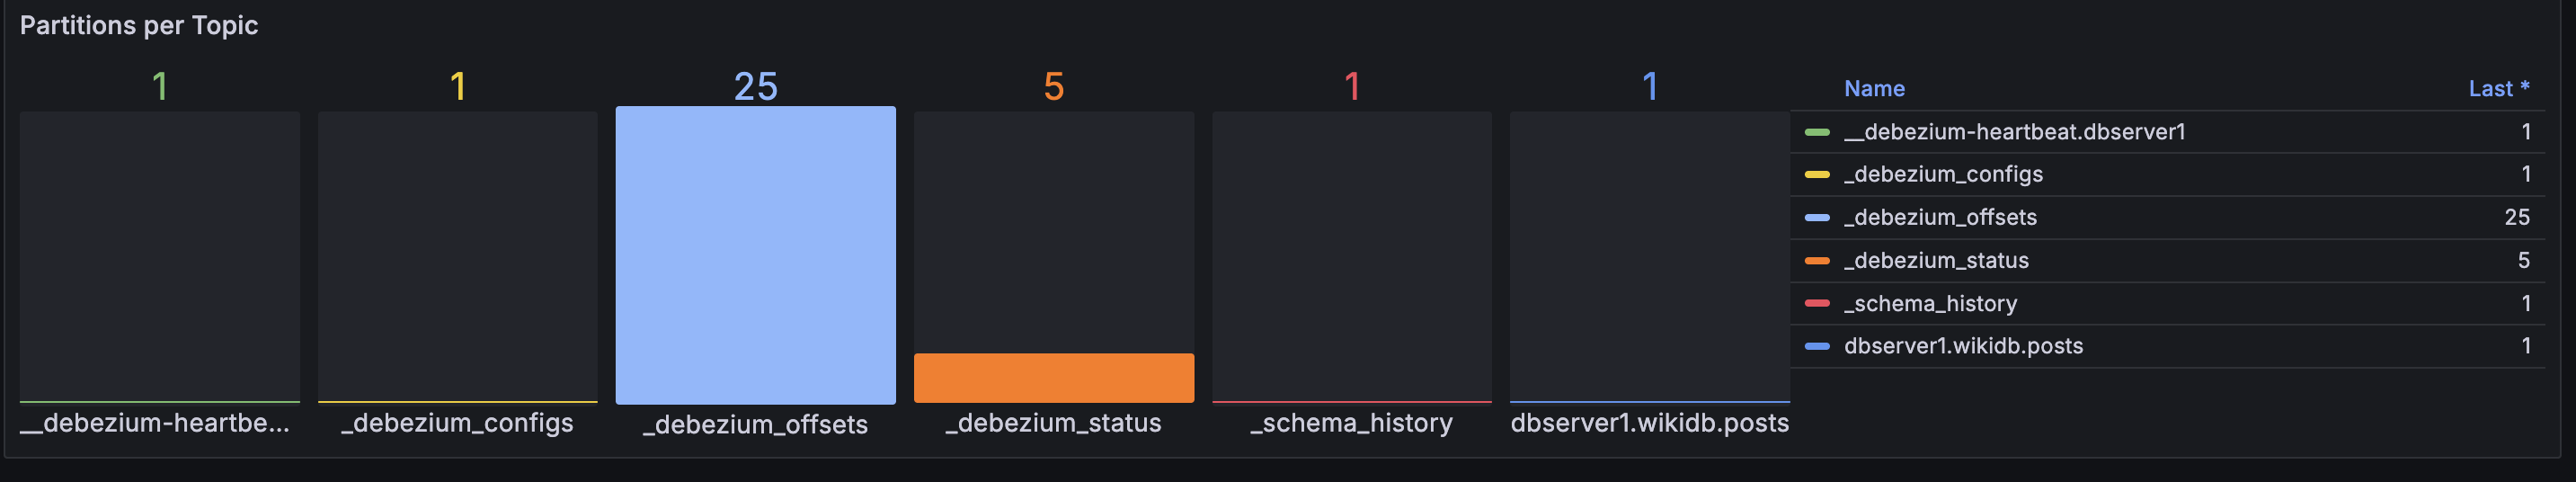
Kafka Topics
7. 성능 종합 비교
stress 테스트(단일) vs 분산
| 지표 | stress 테스트 (단일) | stress (분산) | 개선 |
|---|---|---|---|
| 최대 VU (에러 < 1%) | ~100-150 VU | ~150-200 VU | ~1.3-2배 |
| P95 (100 VU) | 1,400ms | ~200ms | 7배 개선 |
| 에러율 (200 VU) | 13.25% (100 VU에서) | 0.09% (200 VU에서) | 에러 거의 제거 |
| 처리량 피크 | ~30 req/s | ~109 req/s | 3.6배 |
| 회복 | 측정 안 함 | ~2분 내 정상 복귀 | |
| 병목 | App CPU (단일 2코어) | App CPU (분산 4코어) | 동일 병목, 한계점 상승 |
100 VU 구간 비교 (정상 부하)
| 지표 | Redis 샤딩 (Baseline) | stress 100 VU 구간 |
|---|---|---|
| 평균 | 42.8ms | ~50ms |
| P95 | 190ms | ~200ms |
| 에러율 | 0.00% | 0.00% |
100 VU에서는 Baseline과 동일. SLA(P95 < 300ms) 충족.
핵심 결론
- 100 VU에서 P95 200ms로 정상 부하에서 SLA 충족
- 200 VU에서 에러율 0.09%, stress 테스트(단일, 100 VU에서 13.25%)보다 압도적 개선
- App CPU가 여전히 근본 병목이며, 3대 이상 확장 없이는 200 VU가 실질적 한계
- MySQL, Redis, Kafka, Nginx 모두 여유, 앱 CPU만 해결하면 더 확장 가능
다음 글
카테고리 검색 필터링 + Facet 집계에서 Lucene Occur.FILTER 절로 카테고리 필터링을 구현하고, DB GROUP BY 간이 Facet으로 카테고리 분포를 제공합니다.
향후 계획
soak 테스트 (50 VU, 4시간)
검색 파이프라인 고도화(동의어 확장, 쿼리 이해, LTR 등) 완료 후 최종 아키텍처에서 실행 예정. 메모리 누수, GC Pause 누적, 커넥션 풀 drift, Redis 메모리 drift, Kafka Consumer Lag 축적을 30분 간격으로 관찰한다.
Chaos Engineering (장애 주입)
최종 아키텍처에서 8개 시나리오를 계획:
| # | 시나리오 | 기대 결과 |
|---|---|---|
| 1a | App graceful 중지 (SIGTERM) | Nginx → 다른 App 전환, 에러 0 |
| 1b | App crash (SIGKILL) | 진행 중 요청 유실, 이후 전환 |
| 2 | Redis 샤드 crash | 해당 샤드만 캐시 미스 |
| 3 | 토큰 BL Redis crash | 보수적 정책 (모든 토큰 거부) |
| 4 | MySQL Replica crash | 읽기 → Primary 라우팅 |
| 5 | Kafka crash | CDC 중단, fallback 동작 |
| 6 | Debezium crash | CDC 중단, 복구 후 catch-up |
| 7 | 네트워크 지연 100ms | 응답시간 증가, 기능 정상 |
| 8 | Redis+Kafka 동시 crash | 캐시 미스 + CDC 중단, 서비스 지속 |
Previous Post
In Redis Sharding — Workload Isolation with Consistent Hashing, we eliminated the KEYS blocking anti-pattern, implemented 3-node Consistent Hashing, and isolated the blacklist to a dedicated instance. This post verifies the entire distributed architecture with a stress test.
Previous Posts Summary
| Post | Key Metrics |
|---|---|
| Redis L2 Cache + Stateless Migration | L1 73% + L2 9% = 82% hit, Lettuce P95 2.5ms |
| MySQL Replication | GTID async, Primary 5 + Replica 15, Lag 0~1s |
| App Scale-Out | 482ms → 37ms (92% down), errors 13.25% → 0%, CPU 100% → 50% |
| CDC — Event-Driven Synchronization | PostService dual-write removed, OCP compliant |
| Redis Sharding | KEYS→SCAN, 3-node separation, workload isolation |
Load test after Redis Sharding (100 VU, 20 min):
| Metric | Result |
|---|---|
| Avg Response Time | 42.8ms |
| P95 | 190ms |
| Error Rate | 0.00% |
| Throughput (peak) | ~58 req/s |
Each component has been verified independently. However, the limits when everything operates together under high load had not been confirmed.
1. Why Now
Difference from the Stress Test
The stress test identified the single-server limit:
- Single server (1 App + 1 MySQL + 0 Redis) → 200 VU, 25 min → CPU 100%, P95 1.4s
- Established the rationale for “scale-out is needed”
This test identifies the distributed architecture’s limit:
- Distributed architecture (2 Apps + MySQL Primary/Replica + Redis 3-shard + Kafka + Debezium) → stress (re-exploring the limit)
- Answers “Is it production-ready?”
Deferred Soak Test
The soak test (50 VU, 4 hours) explicitly deferred in the stress test is only meaningful after the distributed infrastructure is in place. On a single server, 50 VU x 4 hours would quickly crash at CPU 100%, but with a distributed architecture, we look for problems that emerge over time while CPU has headroom.
“Time-based” problems that soak tests find:
- Memory leaks: Heap usage gradually rises even after GC → OOM
- GC Pause accumulation: G1 GC Mixed/Full GC frequency increases over time
- DB Connection Pool Drift: HikariCP active connections gradually rise → pool exhaustion
- Redis Memory Drift: used_memory gradually rises → eviction → risk of blacklist key loss
- Kafka Consumer Lag accumulation: Initially 0 but lag increases over time
- Replication Lag accumulation: MySQL Replica gradually falls behind under load
Industry examples:
- Netflix: Found a DirectByteBuffer leak in Zuul proxy after 48 hours of soak testing — GC handled it in short tests but caused OOM over long durations
- LinkedIn: Found repeated rebalancing due to misconfigured
max.poll.recordsin Kafka Consumer during a 4-hour soak - Stripe: Soak test revealed Ruby GC heap fragmentation growing proportionally with time, causing P99 latency to triple after 2 hours
2. Test Environment
Infrastructure Configuration
| Server | Role | Specs |
|---|---|---|
| Server 1 | App + DB Primary + Redis + Nginx | ARM 2-core, 12GB |
| Server 2 | App + DB Replica + Redis Shard + Kafka | ARM 2-core, 12GB |
| Server 3 | Grafana + Loki + k6 + InfluxDB | AMD 1-core, 6GB |
| Server 4 | Prometheus + Node Exporter | AMD 1-core, 6GB |
Data State
| Item | Value |
|---|---|
| posts table | ~14.25M rows |
| Lucene index | ~20GB (Primary + Replica) |
| Redis autocomplete KV | Tens to hundreds of thousands of keys (distributed across 3 shards) |
| Redis cache L2 | Thousands of hot post keys (distributed across 3 shards) |
| Redis token blacklist | Hundreds to thousands of keys (dedicated instance) |
3. Stress Test Plan
VU Target Rationale
In the stress test, the ARM 2-core single server hit its limit at 100-150 VU (CPU 100%). After App Scale-Out to 2 App instances, CPU stabilized at 50% under 100 VU. With simple linear scaling, the limit would be 200-300 VU, but Amdahl’s Law means contention on shared resources (MySQL Primary, Nginx, Redis) prevents linear scaling.
Profile (25 min)
0~3 min: 0 → 100 VU (warm-up)3~8 min: 100 VU hold (normal load — Baseline comparison)8~12 min: 100 → 200 VU (overload entry)12~22 min: 200 VU hold (limit exploration)22~25 min: 200 → 0 VU (recovery)Traffic Distribution
| Scenario | Ratio | Description |
|---|---|---|
| Search | 30% | Mixed Korean/English 15 keywords |
| Autocomplete | 25% | 12 prefixes |
| Detail View | 20% | Hot posts 80% + random 20% |
| List View | 15% | Pages 0~9 |
| Write | 5% | Post creation |
| Likes | 5% | Targeting hot posts |
Success Criteria
| Metric | Stress Test (single) | Target (distributed) |
|---|---|---|
| Max VU (error rate < 1%) | ~100-150 VU | 200+ VU |
| P95 (100 VU) | 1,400ms | < 200ms |
| Error Rate (200 VU) | 13.25% (at 100 VU) | < 1% |
4. Stress Test Results
k6 Console Results
| Scenario | Avg | P95 |
|---|---|---|
| Overall | 897.69ms | 1,910.67ms |
| Search (all) | 955.03ms | 1,985.55ms |
| Search (rare 10%) | 785.60ms | 1,861.00ms |
| Search (mid-frequency 60%) | 940.54ms | 1,926.67ms |
| Search (high-frequency 30%) | 1,042.18ms | 1,999.72ms |
| Autocomplete | 693.41ms | 1,797.56ms |
| Latest Posts | 672.73ms | 1,714.21ms |
| Detail View | 1,305.00ms | 2,299.64ms |
| Write (create + likes) | 519.76ms | 1,607.26ms |
| Error Rate | 0.09% | |
| Total Requests | 54,165 |
k6 Overview Dashboard
| Metric | Value | Analysis |
|---|---|---|
| Avg Response Time | 1.08s | Spiked at 200 VU compared to 100 VU segment (42.8ms) |
| P95 | 2.20s | 11.5x worse than Redis Sharding P95 (190ms) |
| P99 | 5.73s | Extreme latency — queue explosion during CPU saturation |
| Error Rate | 0.105% | Target (< 1%) achieved |
| Peak Throughput | 109 req/s | Peak during 100 VU segment, actually dropped at 200 VU |
Response Time Trend:
- 0~8 min (0→100 VU): Avg ~50ms, P95 ~200ms — matches Baseline
- 8~12 min (100→200 VU): P95 surges by the minute — entering CPU saturation
- 12~22 min (200 VU hold): P95/P99 explode to seconds — queueing avalanche
- 22~25 min (200→0 VU): Returns to normal within ~2 min after load reduction
5. Root Cause Analysis — App CPU Saturation as the Fundamental Bottleneck
100 VU vs 200 VU Comparison
| Metric | 100 VU Segment | 200 VU Segment | Degradation |
|---|---|---|---|
| Avg | ~50ms | 897ms | 18x |
| P95 | ~200ms | 1,911ms | 9.5x |
| P99 | ~400ms | 5,730ms | 14x |
| Throughput | ~60 req/s | ~25 req/s (drop) | -58% |
| App CPU | ~50% | 80-100% | Saturated |
The throughput actually dropping is a queueing avalanche — new requests arrive faster than the app can process them, causing the queue to snowball.
Elimination Method — Evidence That CPU Is the Bottleneck
| Component | Status at 200 VU | Bottleneck? |
|---|---|---|
| App CPU | 80-100%, Load Average ~15 (7.5x for 2 cores) | YES |
| MySQL | InnoDB hit rate 100%, Slow Query 0 (Primary), Row Lock 12ms x1 | No |
| Redis | OPS 50 ops/s (limit 100K), memory 0.6%, Eviction 0, Slowlog 0 | No |
| Kafka | Consumer Lag briefly 3K → converges to 0, CDC Lag ~40ms | No (transient) |
| Nginx | Active 200+, negligible CPU usage | No (waiting on app) |
| Network | TTFB 3.95s — mostly server response wait | No (consequence of CPU) |
| Replication | Lag 0~1s, IO/SQL Thread Running | No |
Same conclusion as the stress test (single server): The bottleneck is App CPU (Lucene BM25 scoring + Nori morphological analysis). App Scale-Out to 2 App instances stabilized CPU at 50% for 100 VU, but CPU saturation is reached again at 200 VU.
Supporting 200+ VU
| Alternative | Effect | Feasibility |
|---|---|---|
| Scale to 3 Apps | CPU 4→6 cores, rho ≈ 0.67 (200 VU) | Exceeds OCI Free Tier limit |
| Improve cache hit rate | Fewer origin lookups → CPU savings | L2 65% → 80%+ possible (TTL tuning) |
| Strengthen detail view cache | Improve the slowest scenario (P95 2.3s) | Room for postDetail L1/L2 hit rate improvement |
6. Grafana Dashboards
Per-Scenario Response Time
- At 200 VU, all scenarios degrade simultaneously — not a specific API bottleneck but system-wide CPU saturation
- Detail view (P95 9.83s) is the slowest — high origin hit rate (Lucene + MySQL)
- Rare token (10%) search is faster than high-frequency (30%) — high-frequency tokens match more documents, increasing BM25 scoring cost
Spring Boot HTTP + JVM
- Heap: Both instances ~200-300MB usage, stable within 1G limit
- GC Pause: ~0.5ms at 100 VU, rises to 6ms upon entering 200 VU — increased G1 Evacuation Pause
Tiered Cache + Lettuce
- Origin reach rate: rises to 10 ops/s at 200 VU — increased cache misses concentrate load on Lucene/MySQL
- Lettuce P95: ~2ms at 100 VU → spikes to 10ms at 200 VU (event loop delay from CPU contention)
HikariCP + CPU
- Replica pool: Active reaches max 14~15 (200 VU) — read load concentration
- Connection acquisition time: 200ms spike right after entering 200 VU — symptom of CPU saturation
- App CPU: ~40-60% at 100 VU, 80-100% at 200 VU — bottleneck confirmed
Per-Container Resources
- wiki-app-prod CPU: Peak 180% (relative to 2 cores)
- wiki-mysql-prod CPU: Nearly 0% — DB is not the bottleneck
- Memory: App ~1G, MySQL ~3.5G — stable, no OOM risk
Redis Per-Shard
- OPS: 50 ops/s at 200 VU — plenty of headroom (Redis limit 100K ops/s)
- Key count: shard-1 916, shard-2 436, shard-3 527
- Connections: 3 per shard
Redis Aggregate
- Memory usage: 0.597% — extremely spare
- L2 cache hit rate: 65.0% — cold query ratio increased under stress load
- Eviction: 0, Slowlog: 0
Nginx
- Active Connections: rises to 200+ at 200 VU
- Waiting connections: surges at 200 VU — connections waiting for app response
MySQL
- InnoDB buffer pool hit rate: 100% for both Primary/Replica — no DB I/O bottleneck
- Table Locks: 0
MySQL Replication
- Replication Lag: oscillates between 0~1s — within normal range
- R/W split: Primary SELECT ~10 ops/s, Replica SELECT ~70 ops/s
Kafka + CDC
- Consumer Lag: 0 at 100 VU, rises to max ~3K at 200 VU → then converges to 0
- Peak messages: ~28 msg/s
Debezium
- Connected: CONNECTED (entire duration), Erroneous Events: 0
- CDC Lag: Peak ~40ms — near real-time
Network Details
- TTFB: 3.95s — server response wait dominates at 200 VU
- Total received data: 242 MiB
Host
- Server 1 memory: 63.3%, Swap: 12.2%
- Server 1 Load Average 1m: Peak ~15 (7.5x for 2 cores)
Kafka Topics
7. Performance Summary Comparison
Stress Test (Single) vs Distributed
| Metric | Stress Test (single) | Stress (distributed) | Improvement |
|---|---|---|---|
| Max VU (error < 1%) | ~100-150 VU | ~150-200 VU | ~1.3-2x |
| P95 (100 VU) | 1,400ms | ~200ms | 7x improvement |
| Error Rate (200 VU) | 13.25% (at 100 VU) | 0.09% (at 200 VU) | Errors nearly eliminated |
| Peak Throughput | ~30 req/s | ~109 req/s | 3.6x |
| Recovery | Not measured | Normal within ~2 min | |
| Bottleneck | App CPU (single 2-core) | App CPU (distributed 4-core) | Same bottleneck, higher limit |
100 VU Segment Comparison (Normal Load)
| Metric | Redis Sharding (Baseline) | Stress 100 VU Segment |
|---|---|---|
| Avg | 42.8ms | ~50ms |
| P95 | 190ms | ~200ms |
| Error Rate | 0.00% | 0.00% |
At 100 VU, identical to Baseline. SLA (P95 < 300ms) met.
Key Conclusions
- P95 200ms at 100 VU — SLA met under normal load
- 0.09% error rate at 200 VU — dramatically improved from stress test (single, 13.25% at 100 VU)
- App CPU remains the fundamental bottleneck — 200 VU is the practical limit without scaling beyond 3+ instances
- MySQL, Redis, Kafka, Nginx all have headroom — resolving App CPU alone enables further scaling
Future Plans
Soak Test (50 VU, 4 Hours)
Planned for the final architecture after search pipeline improvements (synonym expansion, query understanding, LTR, etc.) are complete. Will monitor memory leaks, GC Pause accumulation, connection pool drift, Redis memory drift, and Kafka Consumer Lag accumulation at 30-minute intervals.
Chaos Engineering (Fault Injection)
8 scenarios planned for the final architecture:
| # | Scenario | Expected Result |
|---|---|---|
| 1a | App graceful stop (SIGTERM) | Nginx → routes to other App, 0 errors |
| 1b | App crash (SIGKILL) | In-flight requests lost, then routes to other App |
| 2 | Redis shard crash | Cache miss only for that shard |
| 3 | Token BL Redis crash | Conservative policy (reject all tokens) |
| 4 | MySQL Replica crash | Reads → routed to Primary |
| 5 | Kafka crash | CDC halted, fallback behavior |
| 6 | Debezium crash | CDC halted, catch-up after recovery |
| 7 | Network delay 100ms | Response time increase, functionality intact |
| 8 | Redis + Kafka simultaneous crash | Cache miss + CDC halt, service continues |

댓글
댓글 수정/삭제는 GitHub Discussions에서 가능합니다.