MySQL Replication: R/W 분리와 DataSource 라우팅
목차
이전 글
Redis L2 캐시 + 자동완성 flat KV: Trie 퇴역과 Stateless 전환에서 Caffeine(L1) + Redis(L2) 2계층 캐시를 구현하고, Trie 자동완성을 Redis flat KV O(1) GET으로 전환하여 앱을 Stateless로 만들었습니다.
이전 글 요약
| 글 | 핵심 수치 | 결론 |
|---|---|---|
| 캐싱 전략 | 전체 응답 776ms→54ms (14x) | Caffeine L1 캐시 도입 |
| Trie 자동완성 | 사전순→인기순, “삼ㅅ”→“삼성전자” | 검색 로그 기반 자동완성 |
| stress 테스트 | 200 VU → CPU 100%, P95 1,413ms | 단일 서버 한계 ~100-150 VU |
| Redis L2 캐시 | L1 73% + L2 9% = 82% 히트, Origin 19% | Stateless 전환 완료 |
stress 테스트에서 확인한 핵심 병목:
| 지표 | 100 VU | 200 VU | 판단 |
|---|---|---|---|
| CPU | ~40% | 100% 포화 | 근본 병목 |
| P95 | ~400ms | 1,413ms | SLA(300ms) 위반 |
| HikariCP Acquire | 0.05ms | 1,250ms | CPU 포화의 증상 |
JVM/Tomcat 튜닝(스레드 200→100)은 79% 악화로 역효과. CPU-bound 병목에서 튜닝은 한계가 있으며, 분산 전환이 필요하다는 결론.
앱은 Stateless가 되었지만, DB는 여전히 단일 MySQL입니다. 앱 인스턴스를 2대로 늘리면 HikariCP 커넥션이 2배(20×2=40)로 증가하고, 읽기 부하가 단일 MySQL에 집중됩니다. MySQL Replication을 구성하여 읽기 부하를 분산시켜야 합니다.
1. 정상 상태: MySQL은 병목이 아니다
stress 테스트와 Redis L2 캐시 데이터를 보면 MySQL은 현재 병목이 아닙니다:
| 지표 | stress 테스트 (200 VU) | Redis L2 After (100 VU) | 판단 |
|---|---|---|---|
| InnoDB Buffer Pool 히트율 | 100% | 100% | DB I/O 병목 없음 |
| Table Lock | 0 | 0 | 락 경합 없음 |
| Row Lock | 최대 300µs | 최대 23µs | 무시 가능 |
| MySQL CPU (cAdvisor) | 거의 0% | 거의 0% | MySQL은 CPU를 거의 안 먹음 |
| HikariCP Acquire | 1,250ms (200 VU) | 0.1-0.5ms (100 VU) | 200 VU에서의 대기는 CPU 포화의 증상 |
stress 테스트 글에서도 “HikariCP Active 60+는 풀이 부족해서가 아니라 CPU 포화로 요청 처리가 느려져 커넥션 점유 시간이 길어진 것”이라고 분석했습니다. 병목은 App CPU(Lucene BM25)이지 MySQL이 아닙니다.
2. 문제 인식: 그런데 왜 Replication인가
다음 단계인 App 스케일아웃의 전제조건(Bottom-Up 인프라 준비)입니다.
분산 전환의 순서와 근거: Redis L2 캐시 → 앱 Stateless 전환 (캐시/토큰 공유) ← 완료 Replication → DB 읽기 분리 (스케일아웃 시 DB 부하 분산) ← 지금 App 스케일아웃 → 앱 인스턴스 확장 (CPU 분산) ← 다음
왜 Replication이 스케일아웃보다 먼저인가: App 2대 → HikariCP 커넥션 2배(20x2=40) → 단일 MySQL에 쓰기+읽기 모두 집중 현재는 MySQL이 여유 있지만, App 2대에서 Origin 19% 쿼리가 2배가 되면 단일 MySQL에 모든 트래픽이 몰리는 구조가 된다.
미리 읽기를 Replica로 분리해두면: - Primary는 쓰기(10-20%)만 담당 → 스케일아웃 시에도 Primary 부하 안정 - Replica가 읽기(80-90%) 분담 → App 인스턴스 수에 비례하는 읽기 부하를 흡수“현재 MySQL이 느려서”가 아니라 “앱을 늘렸을 때 MySQL이 버틸 수 있도록” 하는 선제적 조치입니다.
이 접근 방식의 근거:
MySQL 공식 문서(19.4.5 Using Replication for Scale-Out)에서도 Replication의 주요 용도를 “읽기가 많고 쓰기가 적은(high reads, low writes) 환경에서 읽기를 Replica로 분산”이라고 정의합니다. 이 프로젝트의 커뮤니티 게시판이 정확히 이 패턴(읽기 80-90%, 쓰기 10-20%)에 해당합니다.
AWS RDS 공식 문서(Read Replicas)에서도 “읽기 작업을 수평 확장(elastically scale out)하여 단일 DB 인스턴스의 용량 제약을 넘어서라”고 권장하며, Aurora는 Auto Scaling으로 Replica를 자동 조절하는 기능까지 제공합니다. Replica는 “문제 발생 후 대응”이 아니라 “확장 계획에 맞춘 사전 구성”입니다.
단, Replica 도입 전에 애플리케이션 레벨 최적화가 먼저 완료되어야 합니다. 쿼리 튜닝, 인덱싱, 캐싱 없이 Replica만 추가하면 오히려 성능이 악화될 수 있습니다(Medium - Your Read Replicas Aren’t Helping). 이 프로젝트에서는 FULLTEXT ngram부터 Lucene 전환, 캐싱 전략, Redis L2까지 애플리케이션 레벨 최적화를 모두 완료한 후에 Replica를 도입하므로, 올바른 순서를 따르고 있습니다.
3. 대안 검토: Replication을 건너뛸 수 없는 이유
| 대안 | 검토 결과 | 판단 |
|---|---|---|
| Replication 건너뛰고 바로 App 2대 | 현재 MySQL이 여유 있으니 2대 운영해도 버틸 수 있다. 하지만 App 2대 × HikariCP 20 = 40 커넥션이 단일 MySQL에 몰리고, 향후 App 3대 이상 확장 시 DB가 병목이 될 수 있다. 사전 분리가 없으면 나중에 서비스 운영 중 긴급 Replication 구성이 필요하며, 훨씬 위험 | 탈락 |
| HikariCP 커넥션 풀 크기만 증가 (20→40) | stress 테스트에서 확인: HikariCP 병목은 풀 부족이 아니라 CPU 포화의 증상. 풀을 올려도 근본 해결 안 됨 | 탈락 |
| Redis L2 캐시 히트율 더 올리기 | Redis L2에서 L1+L2 합산 82% 히트, Origin 19%. 나머지 19%는 cold query + 쓰기 연산이라 캐시로 더 줄이기 어려움 | 탈락 |
| ProxySQL (커넥션 프록시) | 앱 코드 변경 없이 R/W 분리 가능. 하지만 프록시 서버 추가 필요 (Free Tier 자원 소모), 쿼리 파싱 오버헤드, 장애 포인트 추가 | 탈락 (앱 레벨 라우팅이 더 단순) |
| MySQL Replication | 미리 읽기를 Replica로 분리하여 스케일아웃 시 DB 부하를 사전 분산. Primary는 쓰기 전용, Replica는 읽기 전용 | 선택 |
앱 레벨 라우팅 vs ProxySQL 선택 근거: Spring에서 @Transactional(readOnly=true) 기반 라우팅은 이미 서비스 코드에 readOnly 분리가 되어 있으므로 코드 변경이 최소이고, 별도 프록시 인프라가 불필요합니다. ProxySQL은 쿼리를 파싱하여 SELECT/INSERT를 분기하는데, 현재 규모에서는 운영 복잡도에 비해 이점이 제한적이었습니다.
Replication의 이점
Replication 추가 후: App → Write → MySQL Primary (서버 1) App → Read → MySQL Replica (서버 2)
Write(INSERT/UPDATE/DELETE): ~10-20% 트래픽 → Primary Read(SELECT): ~80-90% 트래픽 → Replica → Primary QPS 대폭 감소, Replica가 읽기 분담커뮤니티 서비스 특성상 읽기가 대부분이므로 Replication 효과가 큽니다.
자원 배분 비용 분석 (Oracle Cloud Free Tier)
이 프로젝트는 AWS/GCP가 아닌 Oracle Cloud Free Tier(서버 2대, 합계 4코어/24GB)이므로, 인프라 비용은 “월 N만원”이 아니라 고정 자원 안에서의 배분 트레이드오프입니다.
Replica 도입의 자원 비용: 서버 2 MySQL Replica: 4G (InnoDB BP 2G + 오버헤드) → 서버 2의 남은 메모리: 12G - 4.1G = ~7.9G → 다음 단계 App2(2G) + Lucene(페이지 캐시)에 ~5.9G 확보 — 충분
서버 1 Primary: → Binlog 디스크: 7일 보관 × 쓰기 비율 → 수백 MB 수준 (1,215만 건이지만 쓰기 빈도 낮음) → Primary CPU: 읽기 80%가 Replica로 이동 → 상당한 CPU 절감
Replica 도입의 이득: Primary QPS ~300 → ~60 (쓰기 20%만) → CPU 여유 확보 App 스케일아웃 시 DB 병목 제거 Replica 장애 시 Primary fallback → 가용성 유지
판단: 서버 2 메모리 4G 투자 → Primary CPU 80% 절감 + App 스케일아웃 전제조건 → 투자 가치 있음실무(AWS)에서의 비용 비교 참고: RDS Primary(db.r6g.large, 월 ~30만원)에 Read Replica 추가(동일 스펙, 월 ~30만원). 하지만 Primary를 다운스케일(db.r6g.medium, 월 ~15만원)할 수 있으므로 총 비용은 30만원 → 45만원(+50%)이지만, 읽기 TPS가 2배로 증가하여 TPS당 비용은 오히려 감소합니다.
4. Replication 방식 선택
| 방식 | 장점 | 단점 | 판단 |
|---|---|---|---|
| 비동기 Replication | 설정 간단, Primary 성능 영향 없음 | Replica 지연(lag) 가능 | 선택 |
| 반동기(Semi-sync) | 최소 1대 ACK 보장 | Primary 쓰기 지연, 플러그인 필요 | 현재 요구사항 대비 복잡도 과다 |
| 그룹 Replication (InnoDB Cluster) | 자동 failover, 멀티 Primary | 최소 3대 필요, 복잡 | Free Tier 불가 |
비동기 Replication 선택 근거:
- 커뮤니티 게시판에서 Replica 지연(수 ms~수 초)은 허용 가능
- Primary 쓰기 성능에 영향 없음
- 서버 2대로 구성 가능 (Free Tier 제약)
Replication Lag 허용 범위
| 데이터 | 지연 허용 | 근거 |
|---|---|---|
| 게시글 목록/검색 | 수 초 허용 | 새 글이 1-2초 늦게 보여도 UX 영향 없음 |
| 게시글 상세 | 수 초 허용 | Redis L2 캐시가 서빙, DB 직접 조회 빈도 낮음 |
| 좋아요 수 | 수 초 허용 | 실시간 정확도 불필요 |
| 작성자 본인 수정/삭제 후 조회 | 수 초 허용 | 아래 “Write 후 Read” 분석 참조 |
”Write 후 Read” 일관성 문제
게시글 수정(PUT /posts/1 → @Transactional)과 수정 후 조회(GET /posts/1 → @Transactional(readOnly=true))는 별개의 HTTP 요청이며 별개의 트랜잭션입니다. 쓰기가 Primary에서 커밋된 후 읽기가 Replica로 가면, Replication Lag만큼 옛날 데이터를 볼 수 있습니다.
문제 시나리오: 1. PUT /posts/1 → Primary에서 UPDATE 커밋 (0ms) 2. GET /posts/1 → Replica에서 SELECT (Lag 200ms → 아직 반영 안 됨) 3. 사용자: "수정이 안 됐네?" (stale read)주의: 같은 @Transactional 안에서의 write+read는 같은 커넥션(Primary)을 사용하므로 일관성이 보장됩니다. 하지만 HTTP 요청이 분리되면 별개 트랜잭션이므로 이 보장이 없습니다.
해결 방법 검토:
| 방법 | 장점 | 단점 | 판단 |
|---|---|---|---|
| stale 허용 | 코드 변경 없음 | 본인 글 수정 후 1-2초 옛날 데이터 | 선택 |
| 수정 API 응답에 결과 포함 | PUT 응답 자체에 수정된 데이터 반환 → GET 불필요 | 프론트엔드 변경 필요 | 보완 가능 |
| forcePrimary 플래그 | 수정 후 쿠키/파라미터로 N초간 Primary 강제 | 라우팅 로직 복잡화 | 현재 서비스 특성 대비 복잡도 과다 |
선택 근거: 커뮤니티 게시판에서 수정 후 1-2초 지연은 실질적으로 문제가 되지 않습니다. 사용자가 수정 버튼을 누르고 → 성공 알림을 확인하고 → 페이지가 리로드되는 시간(~1-2초) 동안 Replication이 따라잡습니다. 비동기 Replication의 일반적인 lag은 수십~수백 ms 수준이므로, 대부분의 경우 사용자가 인지하기 전에 동기화가 완료됩니다.
5. 아키텍처
서버 토폴로지

서버 2 메모리 배분 (Replica 추가 후)

6. 구현
6-1. MySQL Primary 설정 (서버 1)
현재 MySQL에 Binlog + server-id + GTID를 추가합니다.
docker-compose.yml.j2 (서버 1 MySQL command 추가): --server-id=1 --log-bin=mysql-bin --binlog-format=ROW --binlog-expire-logs-seconds=604800 --gtid-mode=ON --enforce-gtid-consistency=ON ... (기존 character-set, innodb-buffer-pool-size 등 유지)GTID 사용 이유: Position 기반(MASTER_LOG_FILE + MASTER_LOG_POS)은 failover 시 위치 추적이 복잡합니다. GTID(Global Transaction ID)는 트랜잭션 단위로 고유 ID를 부여하므로 Replica가 SOURCE_AUTO_POSITION=1로 자동으로 동기화 위치를 결정합니다.
Primary MySQL 포트 노출 변경: 현재 127.0.0.1:3306:3306 (localhost만)으로 바인딩되어 있어 서버 2에서 접근 불가. Replica 연결을 위해 private network에서 접근 가능하도록 변경:
# 변경 전ports: - "127.0.0.1:3306:3306"
# 변경 후 — private IP에서만 접근 허용 (public 노출 없음)ports: - "{{ hostvars['app-arm'].private_ip }}:3306:3306"OCI VCN Security List에서 서버 2 → 서버 1 TCP/3306 인바운드도 허용해야 합니다.
Replication 전용 사용자 생성 (init script):
CREATE USER IF NOT EXISTS 'repl'@'%' IDENTIFIED WITH caching_sha2_password BY '${MYSQL_REPL_PASSWORD}';GRANT REPLICATION SLAVE ON *.* TO 'repl'@'%';FLUSH PRIVILEGES;MySQL 8.0 기본 인증 플러그인은
caching_sha2_password이므로 명시적으로 지정합니다.
6-2. MySQL Replica 구성 (서버 2)
서버 2에 MySQL Replica 컨테이너를 배포합니다.
# 서버 2 docker-compose.yml.j2mysql-replica: image: mysql:8.0 container_name: wiki-mysql-replica command: > --server-id=2 --read-only=ON --super-read-only=ON --relay-log=relay-bin --log-replica-updates=ON --gtid-mode=ON --enforce-gtid-consistency=ON --innodb-buffer-pool-size=2G --character-set-server=utf8mb4 --collation-server=utf8mb4_0900_ai_ci --performance-schema=ON
--log-slave-updates는 MySQL 8.0.26부터--log-replica-updates로 변경됨 (deprecated 용어 사용 회피).
--super-read-only=ON은--read-only=ON만으로는 SUPER 권한 사용자가 쓸 수 있는 구멍을 막습니다 (Percona 권장).
초기 데이터 동기화: mysqldump에서 CLONE PLUGIN으로 전환:
처음에는 mysqldump(102GB)로 시도했으나 3가지 문제가 발생했습니다:
- dump 파일에
CREATE TABLE이 누락 (스키마와 데이터 분리 필요) --binary-mode필요 (LONGTEXT 바이너리 데이터)- 스키마 적재 후 컬럼 길이 불일치 (
Data too long for column)
MySQL 8.0 CLONE PLUGIN으로 전환:
-- Replica에서 한 줄로 Primary 전체 데이터 복사CLONE INSTANCE FROM 'repl'@'10.0.0.47':3306 IDENTIFIED BY '...';- 133.5GB를 ~83MB/s로 약 28분 만에 복사 완료
- GTID 위치 자동 설정 (dump처럼 수동 GTID purge 불필요)
- Replica 자동 재시작 후 바로
CHANGE REPLICATION SOURCE TO실행 가능
Replication 시작:
CHANGE REPLICATION SOURCE TO SOURCE_HOST='${PRIMARY_PRIVATE_IP}', SOURCE_USER='repl', SOURCE_PASSWORD='${MYSQL_REPL_PASSWORD}', SOURCE_AUTO_POSITION=1, GET_SOURCE_PUBLIC_KEY=1;START REPLICA;
GET_SOURCE_PUBLIC_KEY=1은caching_sha2_password인증 시 RSA 공개키를 Primary에서 자동 수신하기 위해 필요합니다.
6-3. Spring DataSource 라우팅
@Transactional(readOnly = true) → Replica, @Transactional → Primary로 자동 라우팅합니다.
핵심: LazyConnectionDataSourceProxy로 감싸야 합니다.
Spring은 @Transactional 동기화가 초기화되기 전에 DataSource.getConnection()을 호출합니다. 이 시점에 TransactionSynchronizationManager.isCurrentTransactionReadOnly()는 항상 false를 반환하여, 모든 쿼리가 Primary로 갑니다. LazyConnectionDataSourceProxy는 실제 Statement 생성 시점까지 커넥션 획득을 지연시켜서, 트랜잭션 속성이 설정된 후에 라우팅 결정을 합니다.
// 1. RoutingDataSource: readOnly 플래그에 따라 Primary/Replica 분기public class ReadWriteRoutingDataSource extends AbstractRoutingDataSource { @Override protected Object determineCurrentLookupKey() { return TransactionSynchronizationManager.isCurrentTransactionReadOnly() ? "replica" : "primary"; }}
// 2. DataSourceConfig: Primary + Replica HikariCP 풀 + LazyProxy@Configurationpublic class DataSourceConfig {
@Bean @ConfigurationProperties("spring.datasource.primary.hikari") public HikariDataSource primaryDataSource() { return new HikariDataSource(); }
@Bean @ConfigurationProperties("spring.datasource.replica.hikari") public HikariDataSource replicaDataSource() { return new HikariDataSource(); }
@Bean public DataSource dataSource() { ReadWriteRoutingDataSource routingDS = new ReadWriteRoutingDataSource(); routingDS.setTargetDataSources(Map.of( "primary", primaryDataSource(), "replica", replicaDataSource() )); routingDS.setDefaultTargetDataSource(primaryDataSource());
// LazyConnectionDataSourceProxy: 트랜잭션 속성 설정 후 커넥션 획득 (필수) return new LazyConnectionDataSourceProxy(routingDS); }}# application.yml — HikariCP 풀 분리spring: datasource: primary: hikari: jdbc-url: jdbc:mysql://${DB_PRIMARY_HOST}:3306/${DB_NAME} username: ${DB_USERNAME} password: ${DB_PASSWORD} maximum-pool-size: 5 # 쓰기 10-20% → 적은 풀 pool-name: primary-pool replica: hikari: jdbc-url: jdbc:mysql://${DB_REPLICA_HOST}:3306/${DB_NAME} username: ${DB_USERNAME} password: ${DB_PASSWORD} maximum-pool-size: 15 # 읽기 80-90% → 큰 풀 pool-name: replica-pool read-only: trueHikariCP 풀 사이즈 근거: 기존 단일 DataSource 20개를 Primary 5 + Replica 15로 분배. 쓰기(INSERT/UPDATE/DELETE)는 전체의 10-20%이므로 5개로 충분. 읽기는 80-90%이므로 15개 할당. 합계 20개로 기존 MySQL 커넥션 총량 유지.
기존 코드 변경 최소화: PostService, UserService, CategoryService 등은 이미 @Transactional(readOnly = true) / @Transactional을 구분하고 있으므로, DataSource 라우팅만 추가하면 자동으로 Read/Write 분리가 동작합니다.
Flyway 마이그레이션: Primary 전용 실행:
Flyway 자동설정은 컨텍스트의 DataSource 빈을 잡아서 마이그레이션을 실행합니다. Routing DataSource(LazyProxy)를 받으면 마이그레이션 시점에 트랜잭션이 없으므로 라우팅이 불확실합니다. @FlywayDataSource로 Primary를 명시하여 마이그레이션이 항상 Primary에서만 실행되도록 합니다:
@Bean@FlywayDataSourcepublic DataSource flywayDataSource() { return primaryDataSource(); // Primary 직접 지정}Baeldung “Multiple Databases With Flyway” 참고: “If you like to use a different DataSource, you can create one and mark its @Bean as @FlywayDataSource.”
Replica 장애 시 동작:
AbstractRoutingDataSource는 setLenientFallback(true) (기본값)로 설정되어 있어, 현재 lookup key에 해당하는 DataSource가 없으면 defaultTargetDataSource(Primary)로 fallback합니다. 하지만 이건 키가 매핑에 없는 경우에만 적용되며, Replica DataSource가 등록되어 있지만 커넥션 획득에 실패하는 경우에는 예외가 그대로 전파됩니다.
Replica 장애 시 현실적 대응: 1. Grafana 알림 (IO/SQL Thread 중단 → Critical)으로 즉시 감지 2. application.yml에서 Replica URL → Primary URL로 변경 + 재배포 3. 또는 Replica 복구
자동 failover가 아닌 수동 대응을 선택한 이유: - 자동 failover 구현은 커넥션 풀 교체, 헬스체크, 서킷 브레이커 등 복잡도가 높음 - Free Tier 2대 체제에서 Replica 장애 빈도는 매우 낮음 (물리 서버 장애 수준) - Grafana 알림 + 수동 대응(수 분)이 현실적6-4. 모니터링 추가
| 메트릭 | 소스 | 의미 |
|---|---|---|
| Replication Lag | mysql_slave_status_seconds_behind_master (mysqld-exporter) | Replica 지연 시간. 10초 이상 시 경고 |
| Replica IO Thread | mysql_slave_status_slave_io_running | Binlog 수신 스레드 동작 여부 |
| Replica SQL Thread | mysql_slave_status_slave_sql_running | Binlog 적용 스레드 동작 여부 |
| Replica QPS | mysql-exporter (서버 2) | Replica의 읽기 처리량 |
| Primary/Replica 커넥션 풀 | hikaricp_connections_active{pool="primary-pool"}, {pool="replica-pool"} | R/W 분리 확인 |
Grafana 알림:
- Replication Lag > 10초 (5분 지속) → Warning
- IO/SQL Thread 중단 (1분 지속) → Critical
MySQL 8.0.22+에서
SHOW MASTER STATUS는SHOW BINARY LOG STATUS로,SHOW SLAVE STATUS는SHOW REPLICA STATUS로 변경됨. mysqld-exporter는 내부적으로 호환 처리하므로 메트릭 이름은 기존(mysql_slave_status_*)을 유지합니다.
7. Before vs After
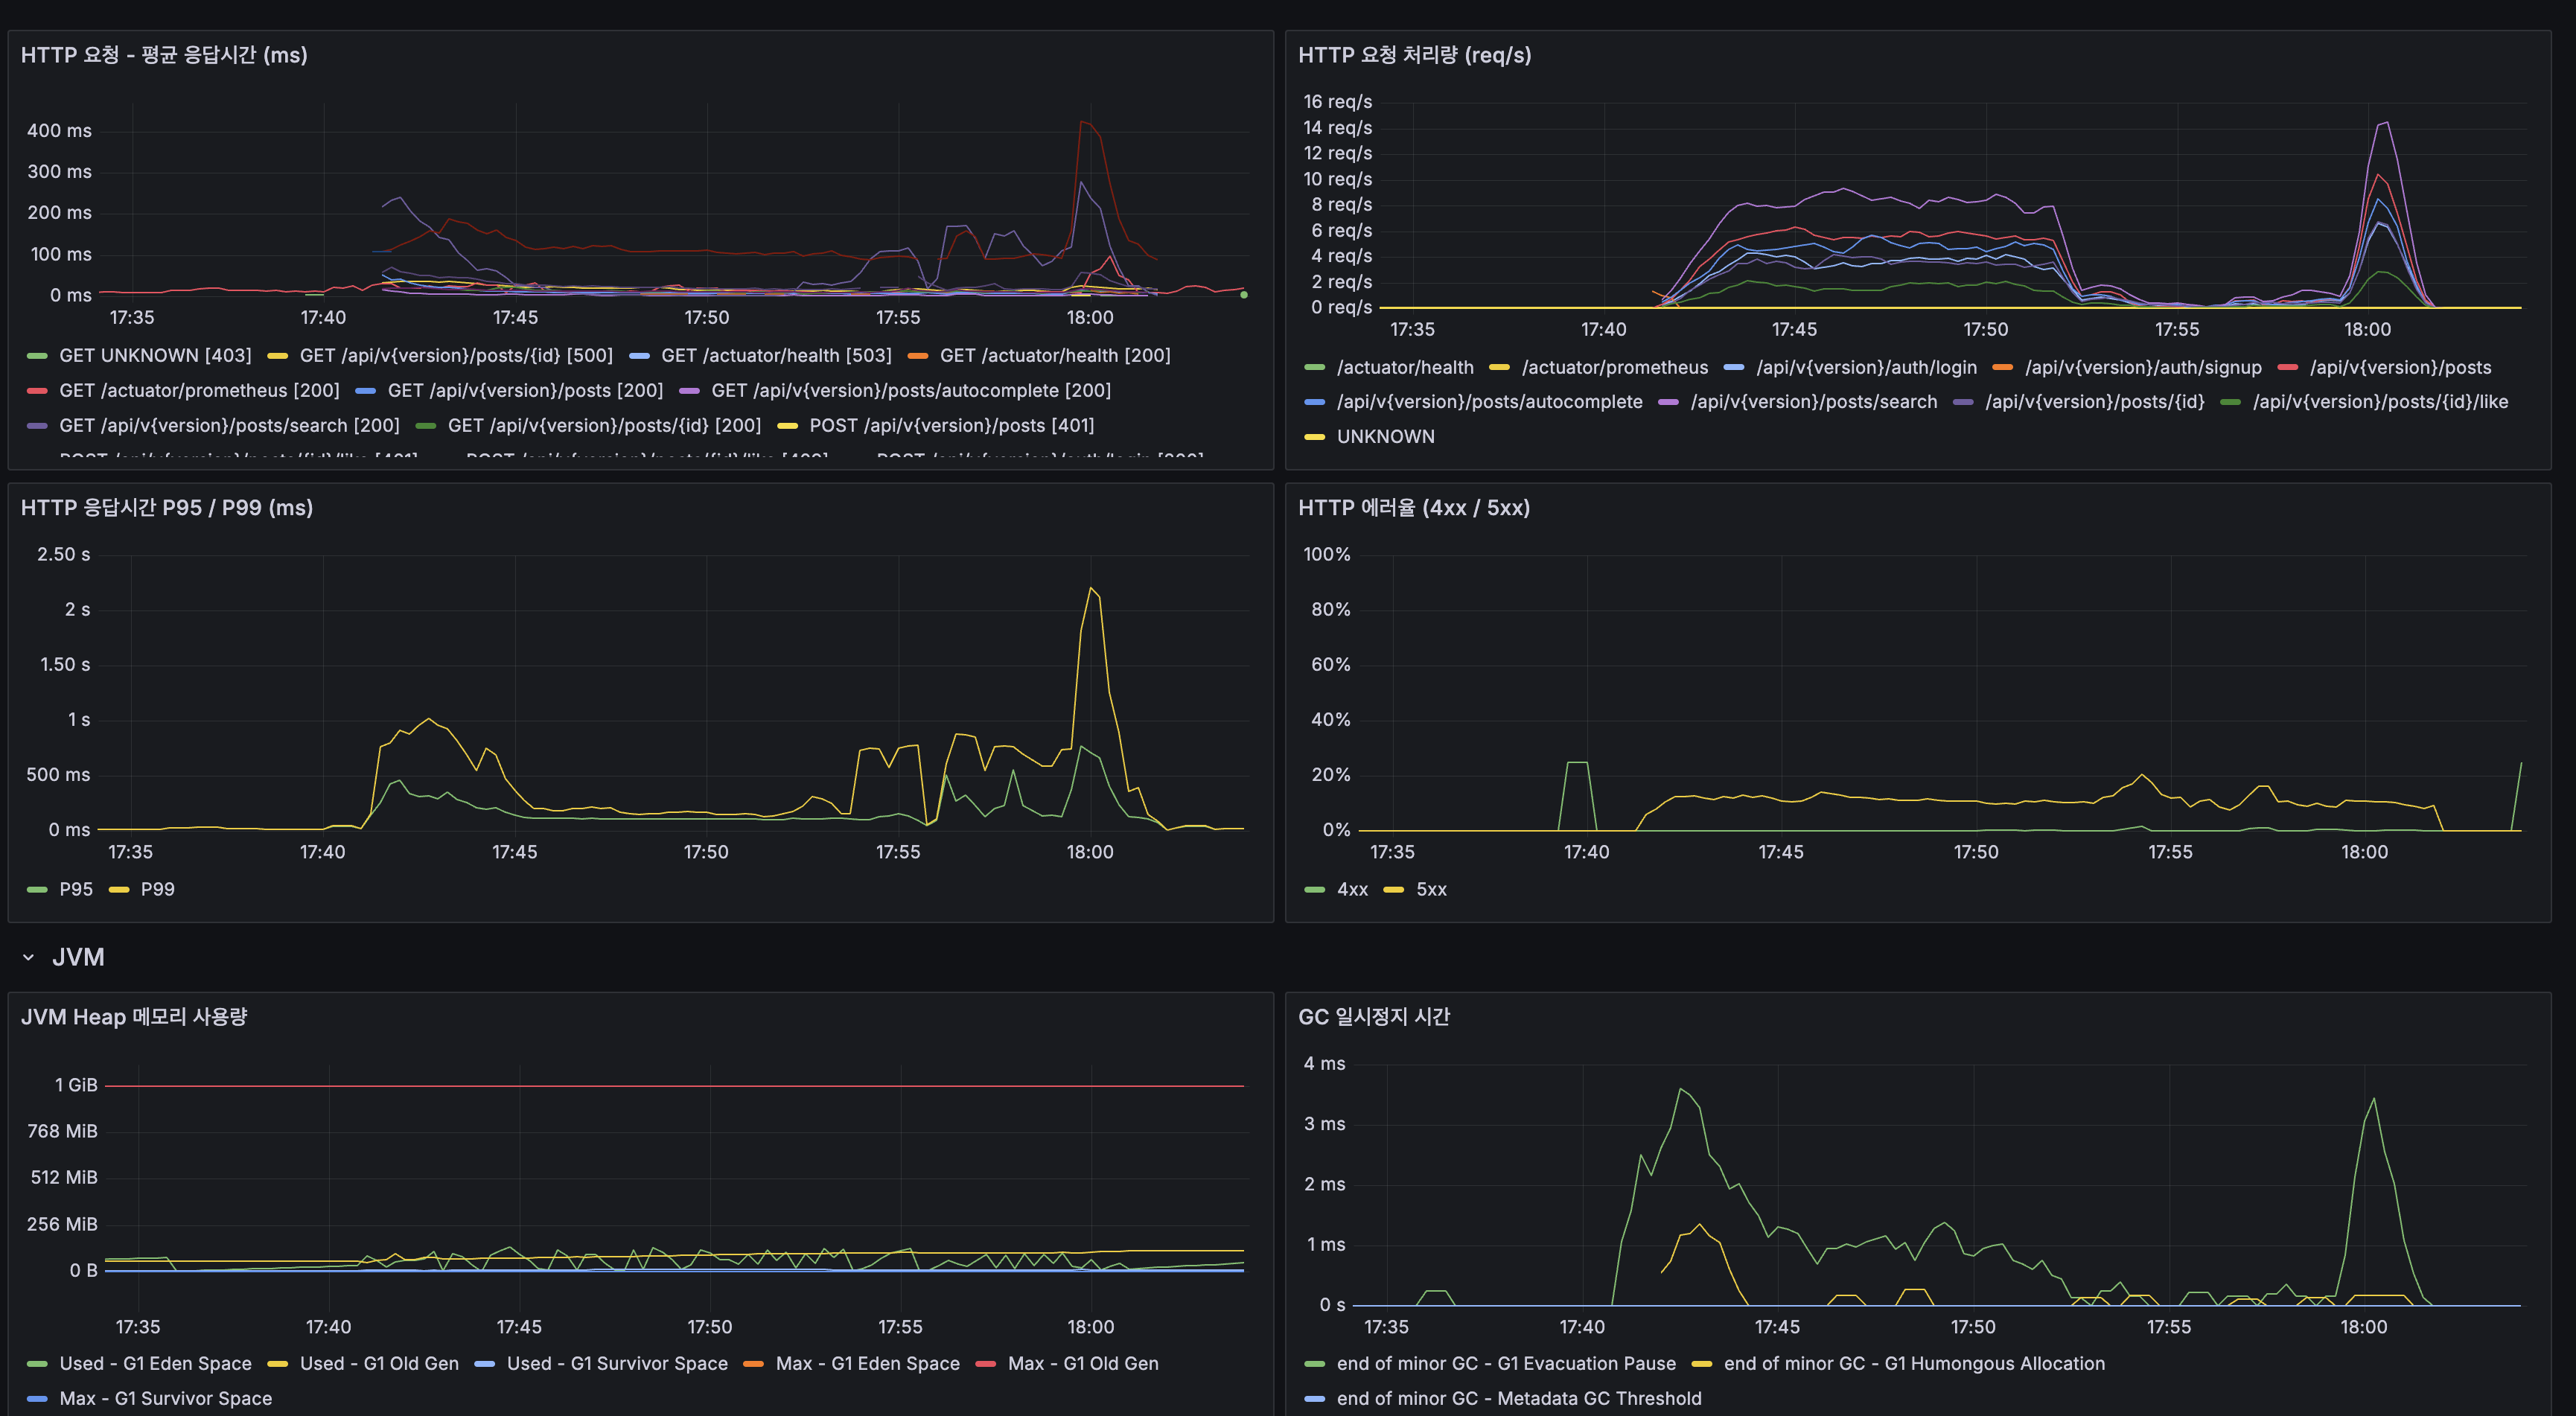
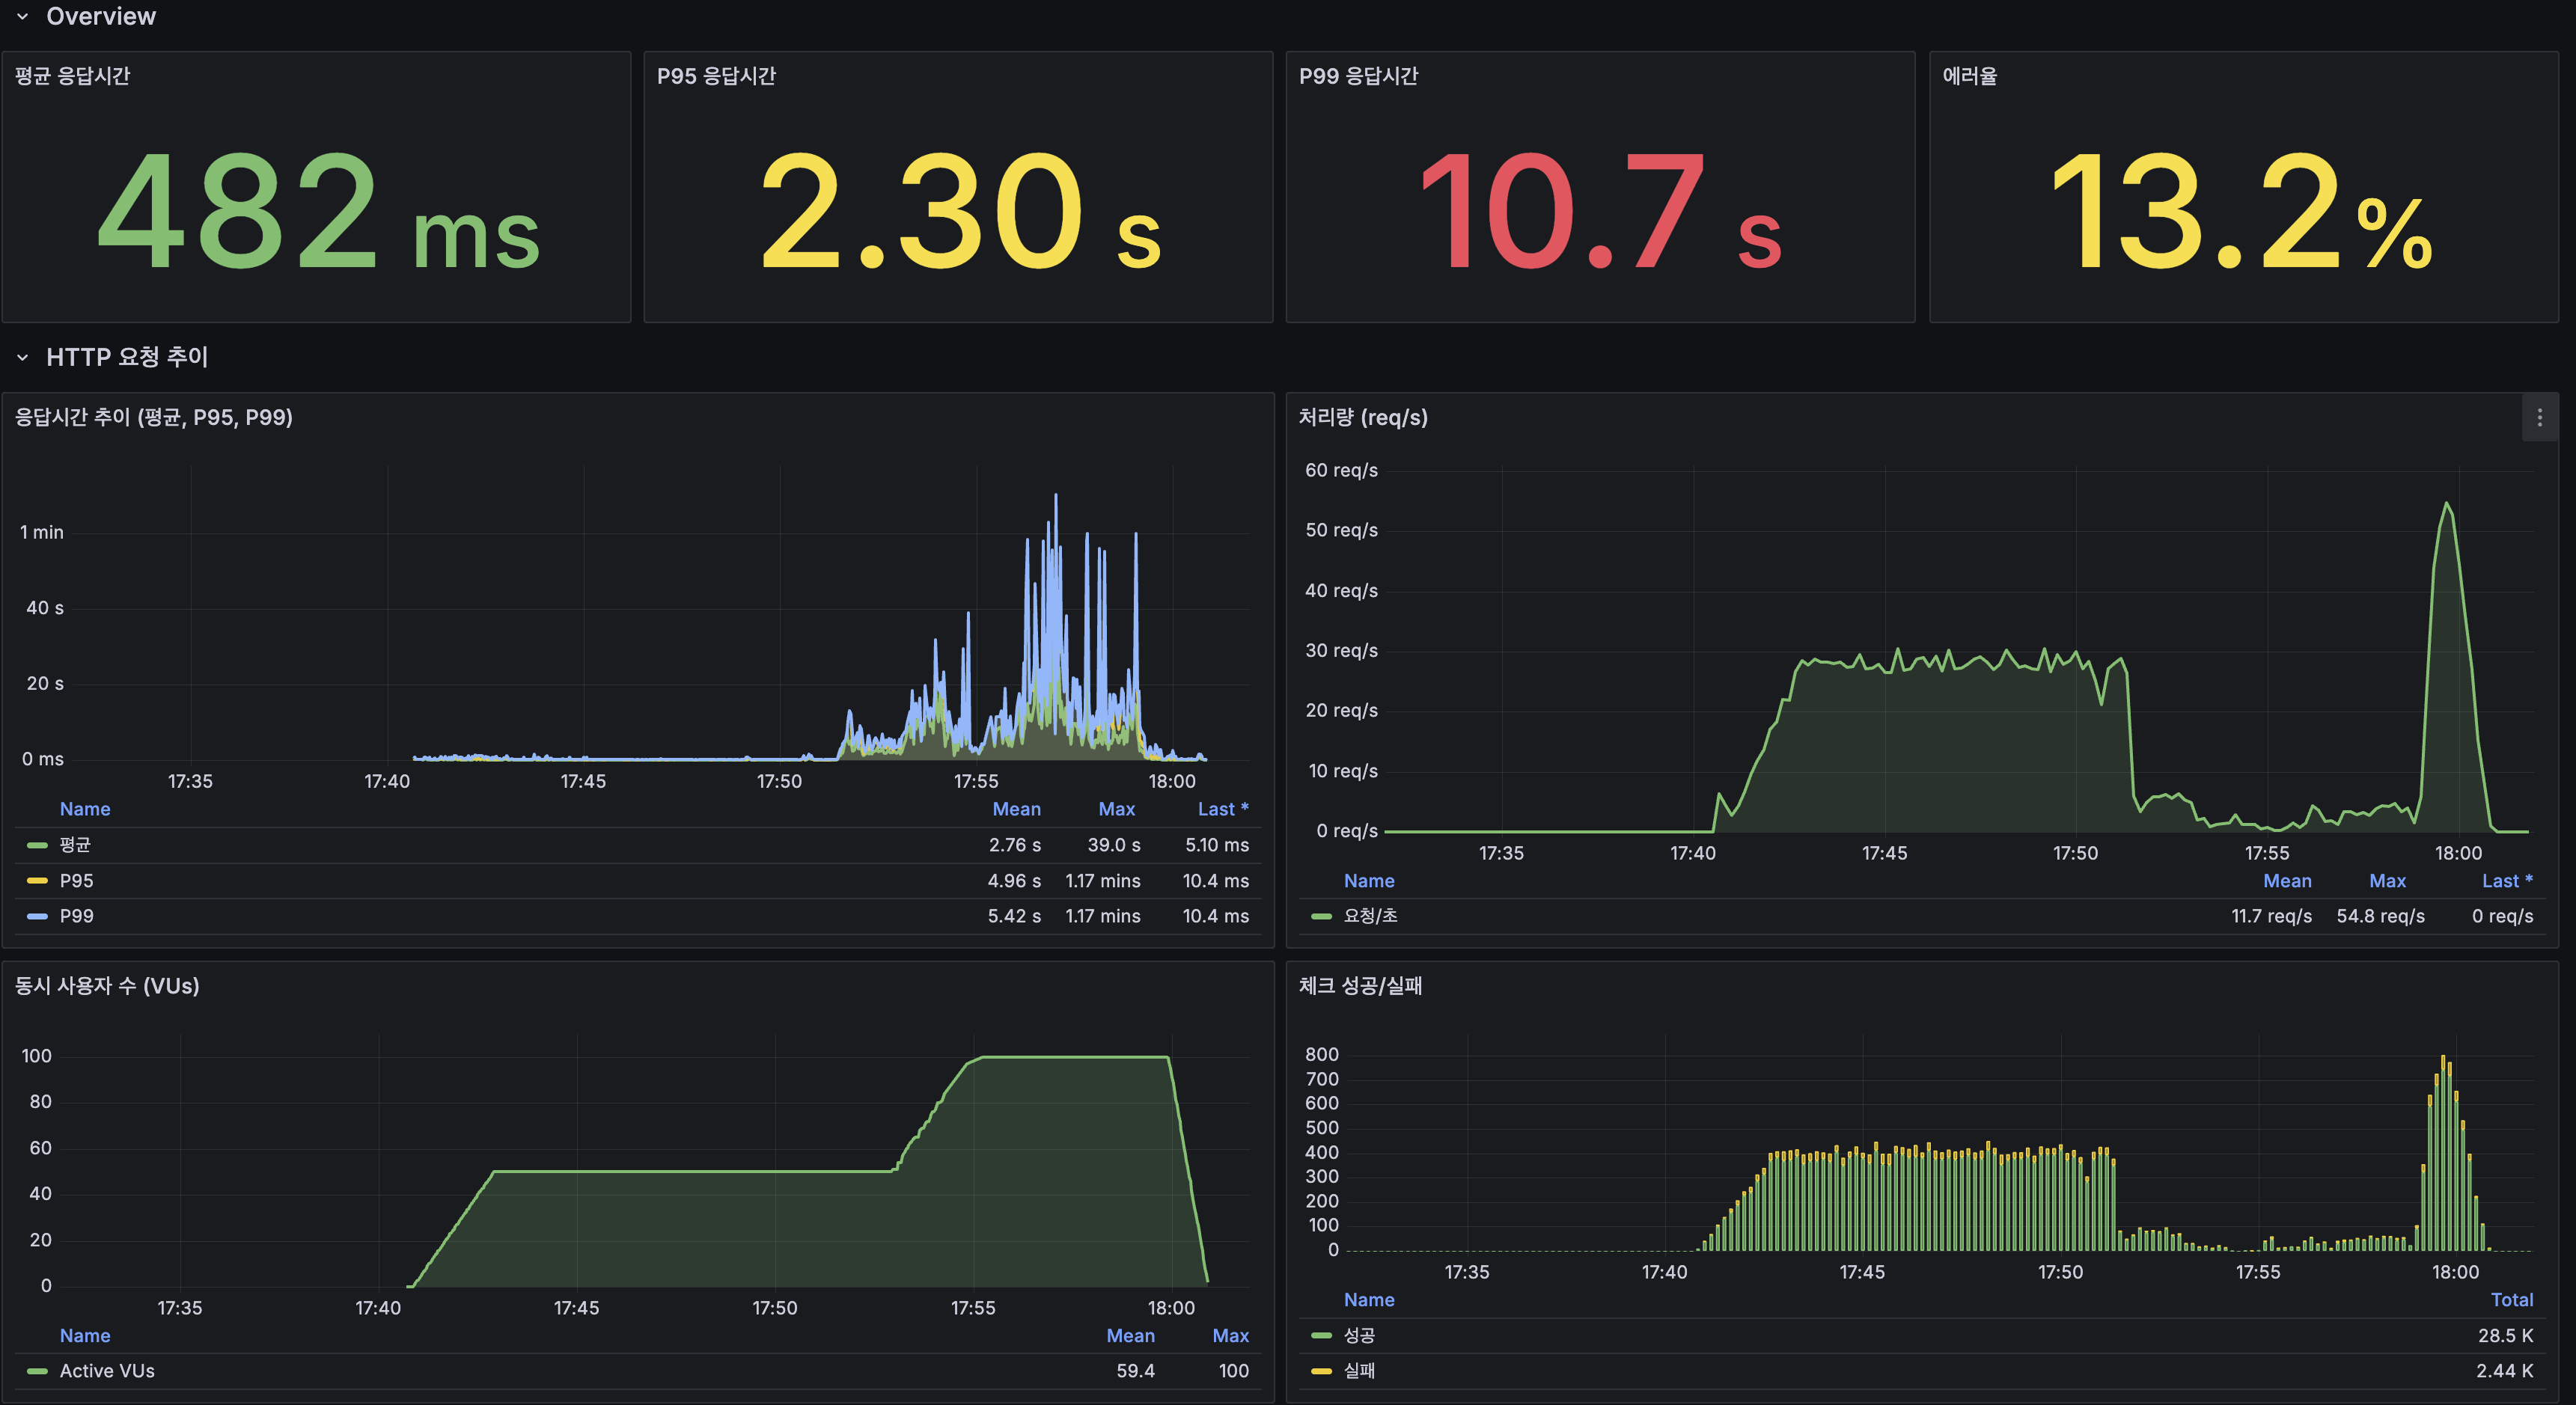
k6 100 VU load 테스트 결과
테스트 환경: 서버 1 ARM 2코어/12GB에 Spring Boot 2GB(JVM 힙 1GB) + MySQL Primary 4GB(InnoDB BP 2GB) + Redis 256MB. 서버 2 ARM 2코어/12GB에 MySQL Replica 4GB(InnoDB BP 2GB). 데이터: 1,215만 건.
| 지표 | 값 |
|---|---|
| 총 요청 수 | 21,120 |
| 평균 응답시간 | 482ms |
| P95 | 2,300ms |
| 에러율 | 13.25% |
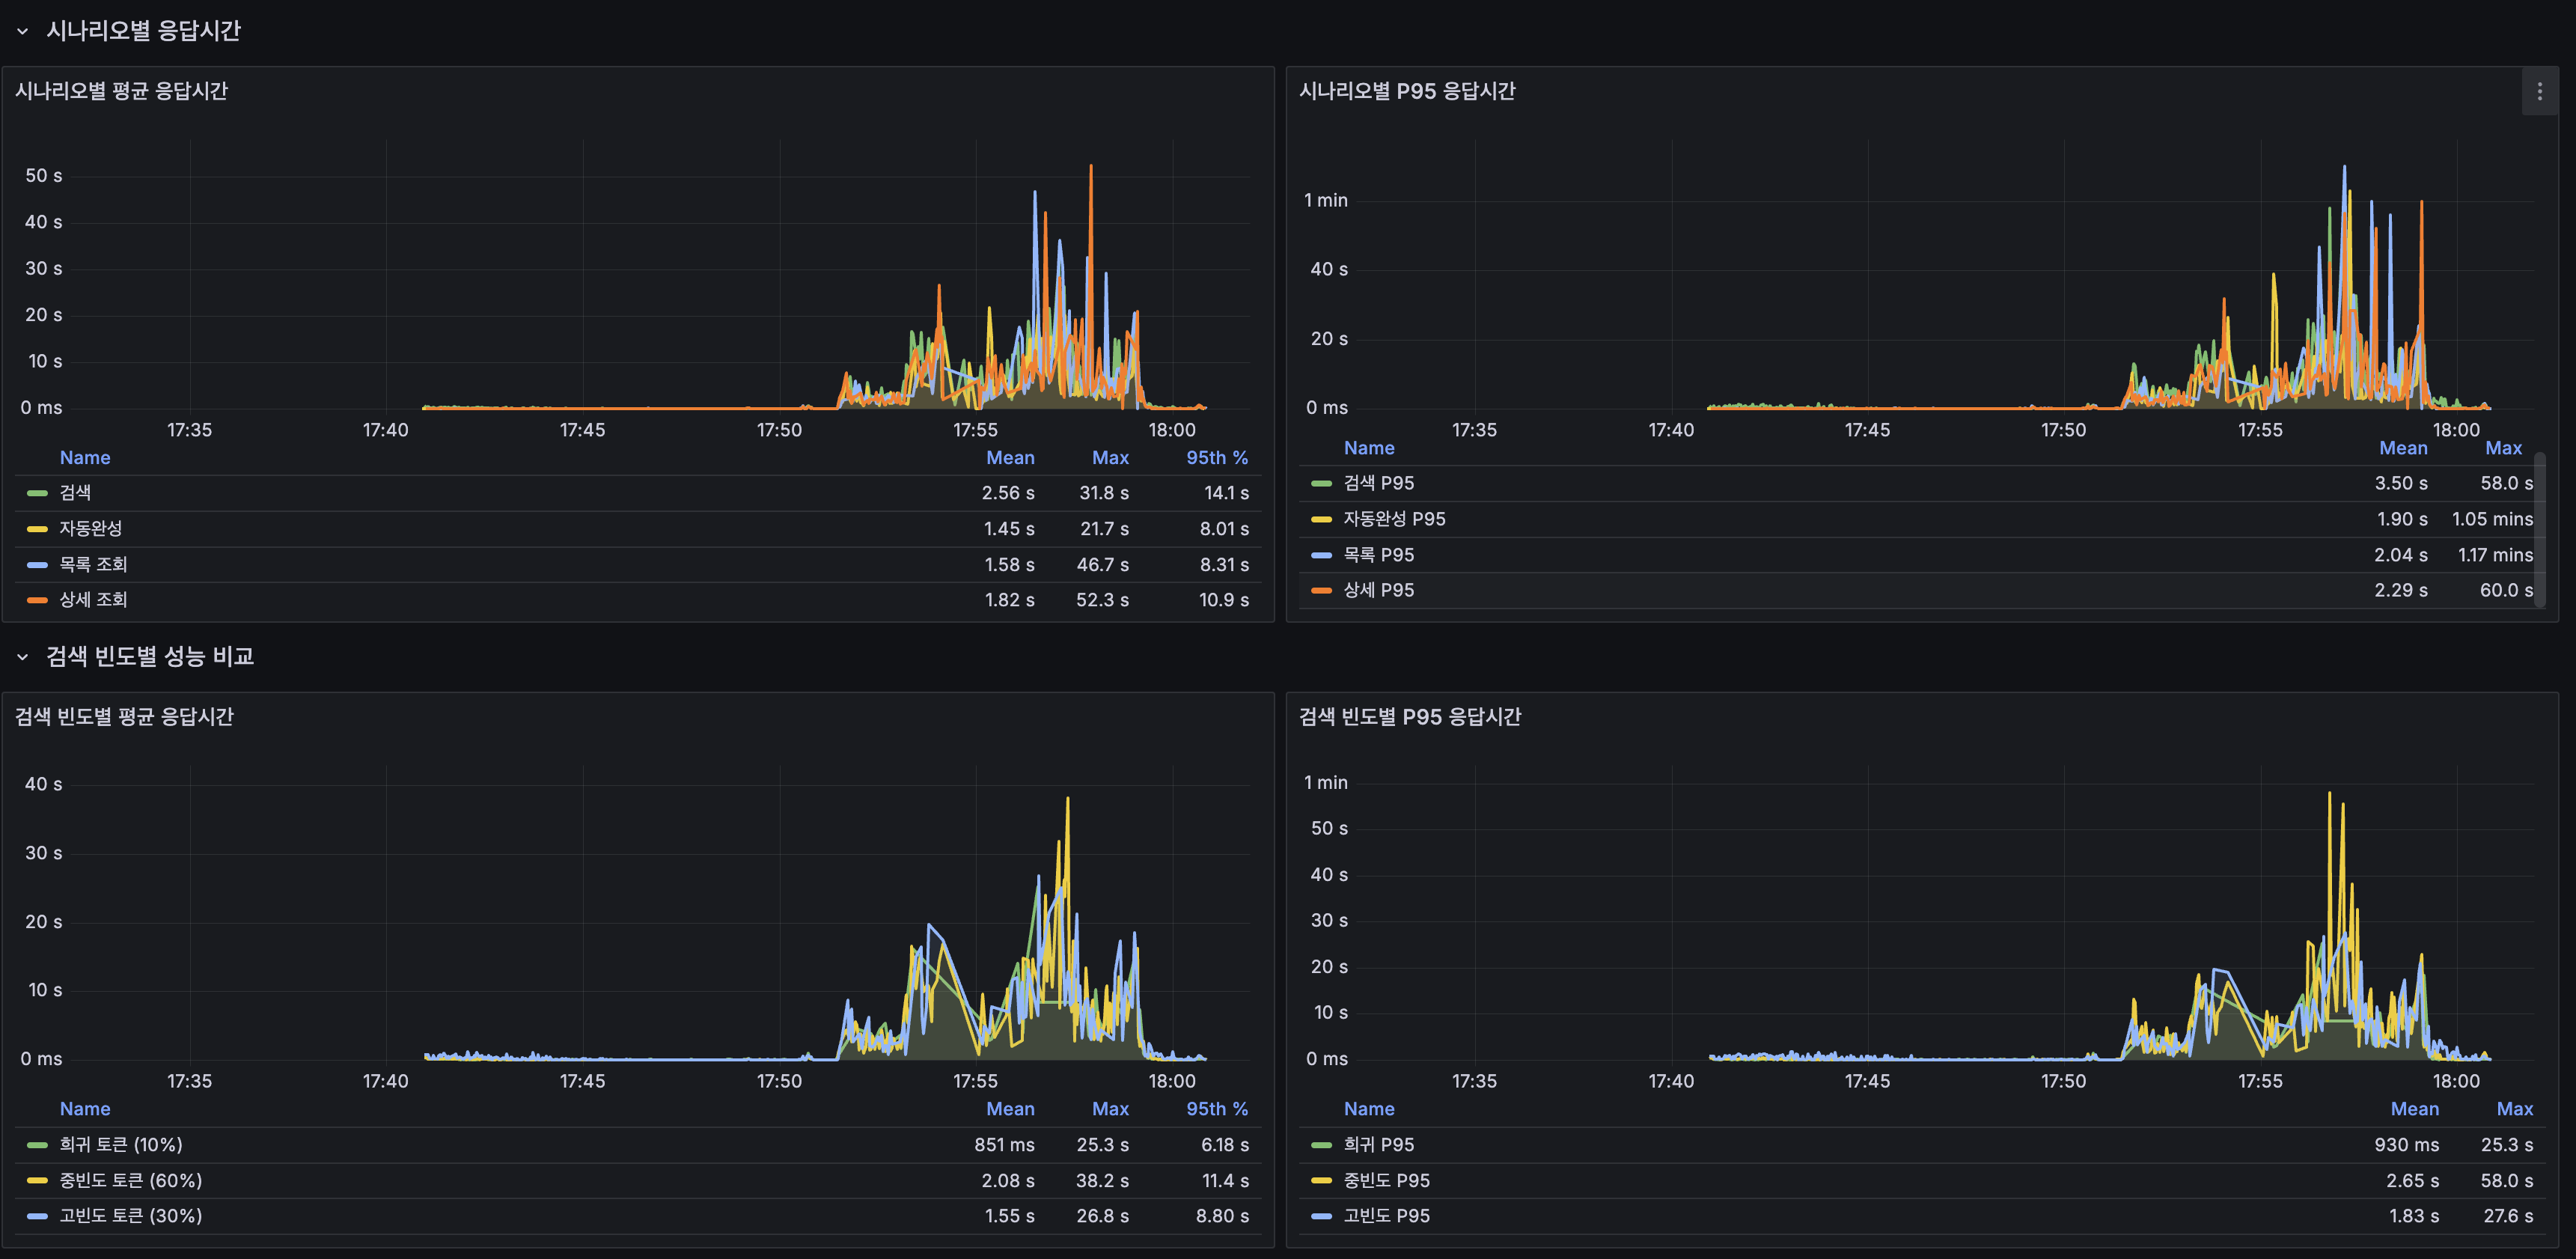
시나리오별 성능
| 시나리오 | 평균 | P95 |
|---|---|---|
| 검색 (전체) | 573ms | 3,044ms |
| 검색 (희귀 토큰 10%) | 502ms | 3,030ms |
| 검색 (중빈도 토큰 60%) | 567ms | 3,048ms |
| 검색 (고빈도 토큰 30%) | 610ms | 3,099ms |
| 자동완성 | 386ms | 2,023ms |
| 최신 게시글 목록 | 469ms | 2,145ms |
| 상세 조회 | 540ms | 2,330ms |
| 쓰기 (생성+좋아요) | 317ms | 1,483ms |
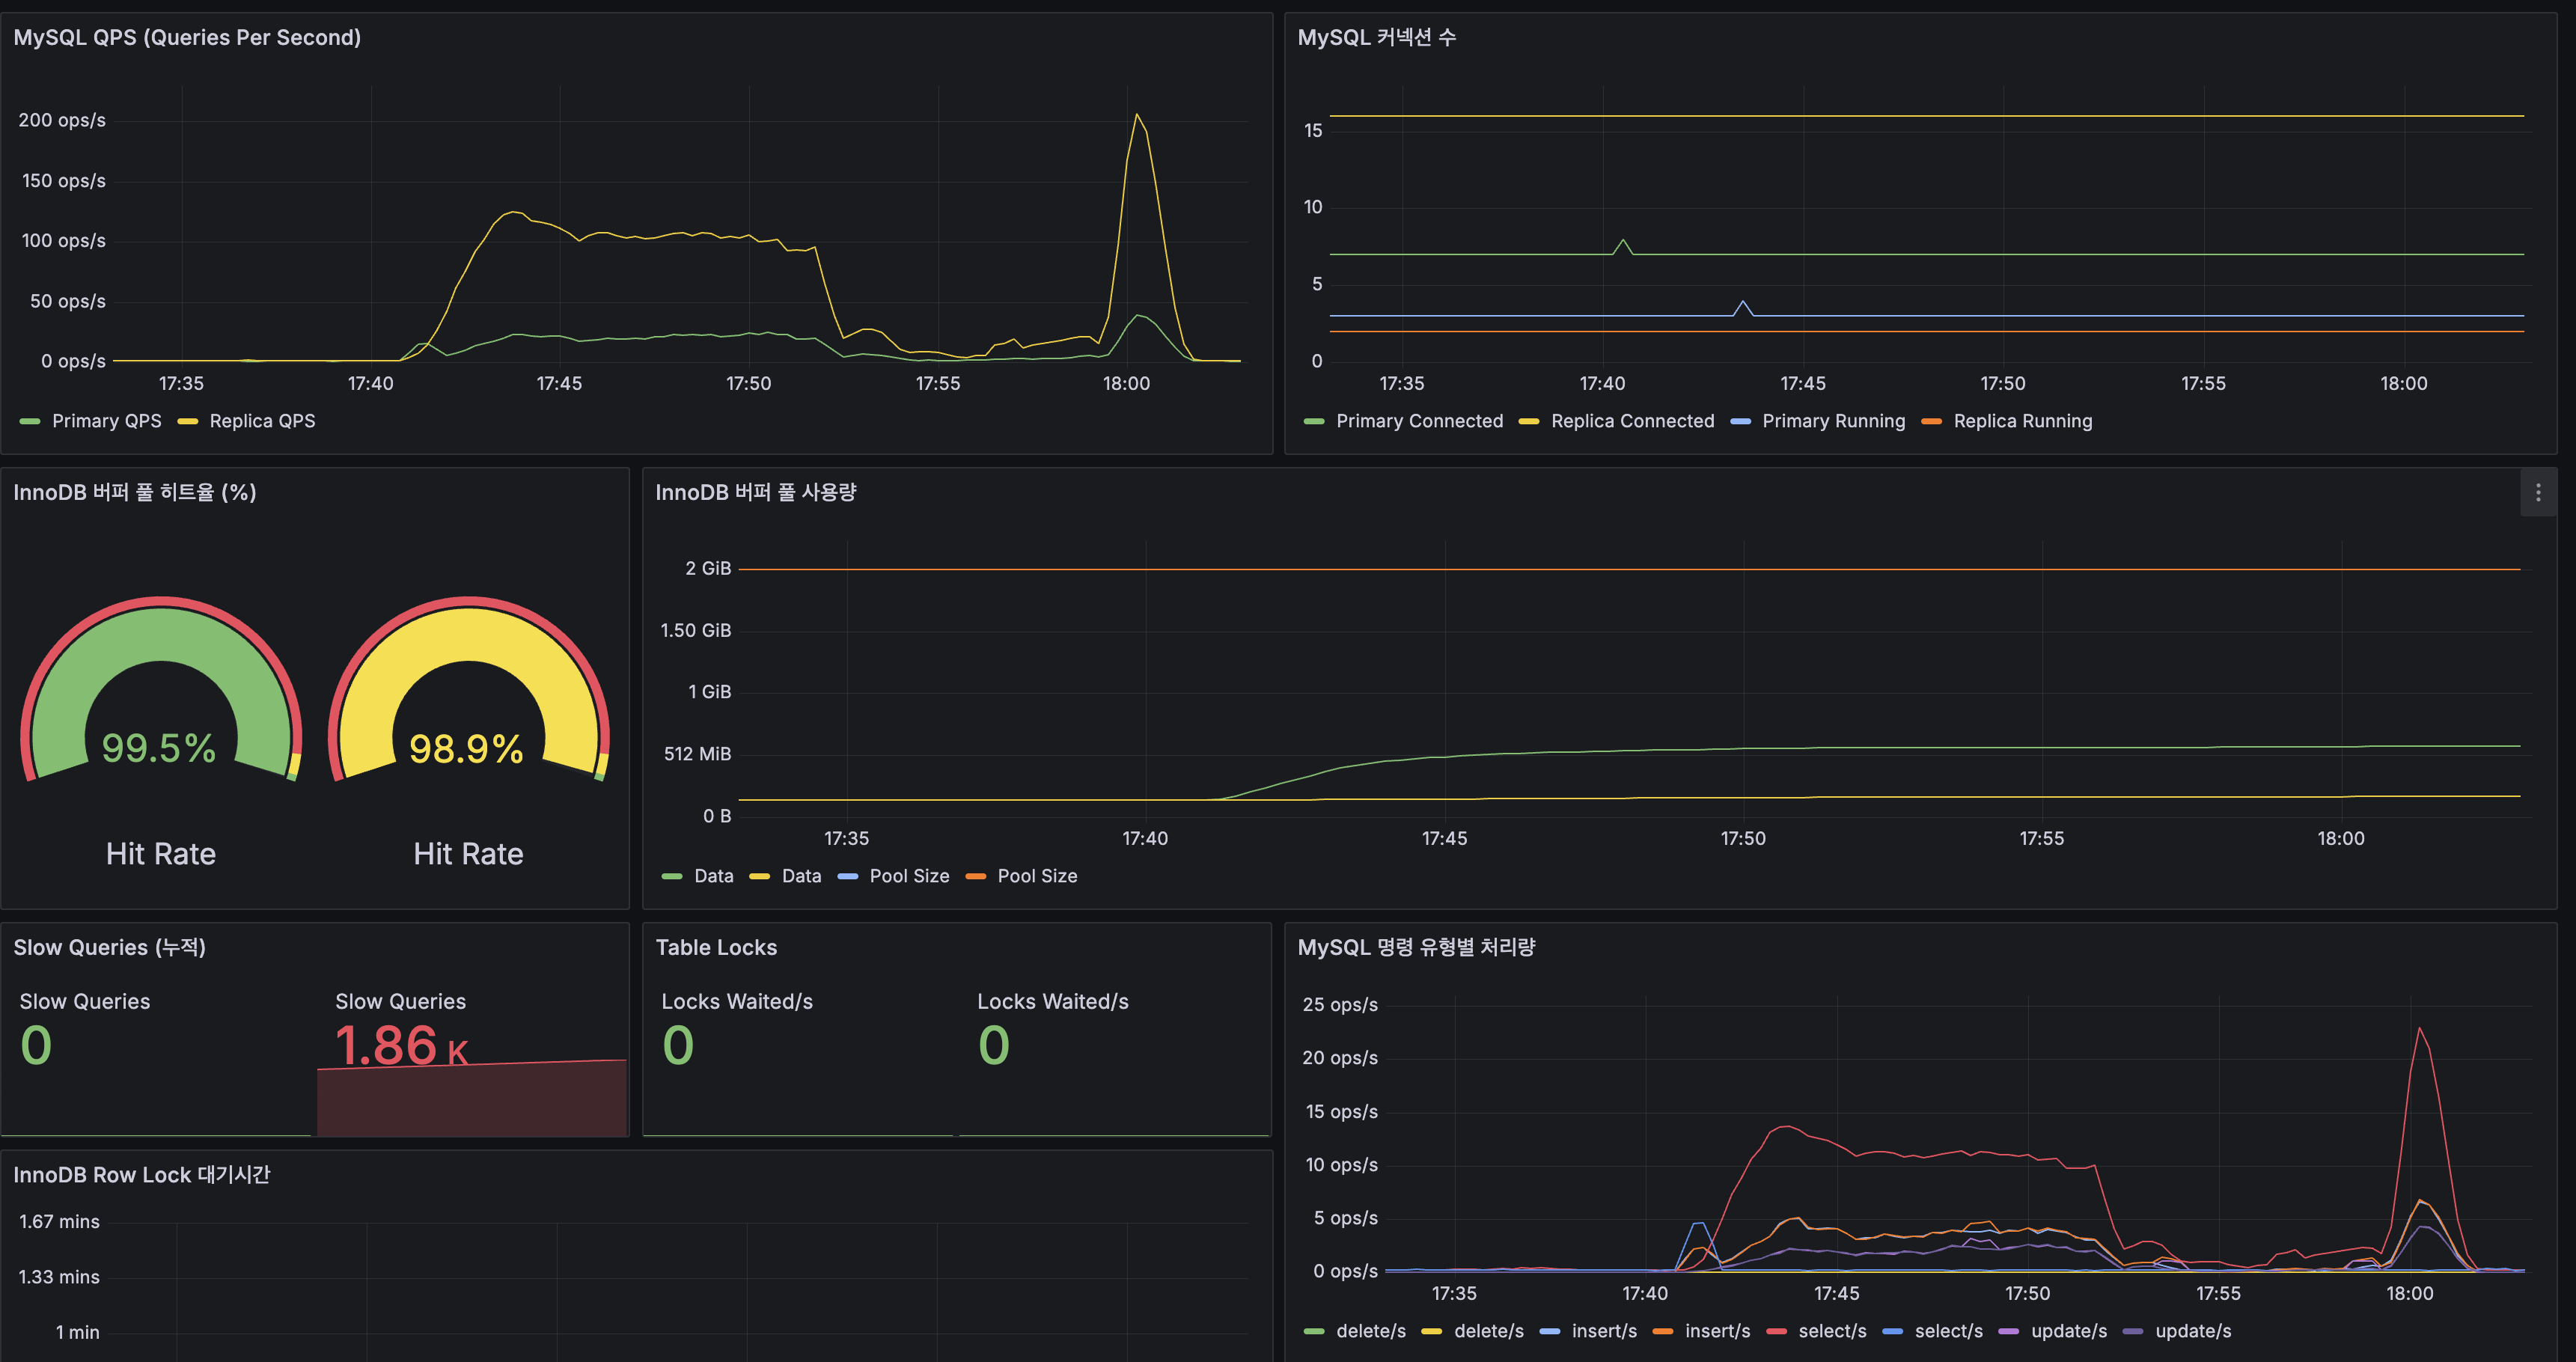
R/W 분리 실측 (Grafana)
| 지표 | Primary | Replica |
|---|---|---|
| QPS (정상 부하) | ~50 ops/s | ~100 ops/s |
| QPS (피크) | ~50 ops/s | ~200 ops/s |
| 커넥션 (Connected) | ~5 | ~15 |
| InnoDB 버퍼 풀 히트율 | 99.5% | 98.9% |
| Slow Queries | 0 | 1,860 |
| Table Locks | 0 | 0 |
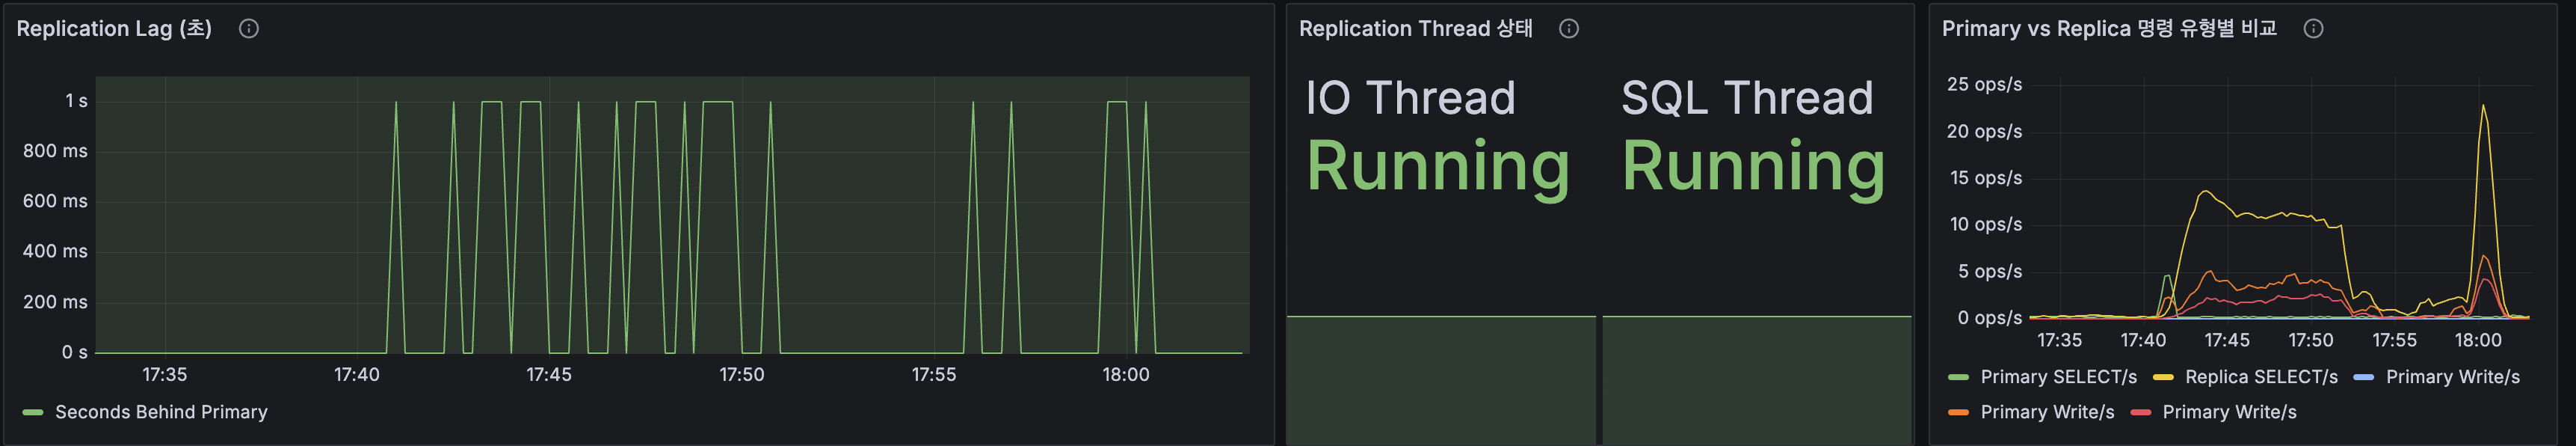
Replication 상태
| 지표 | 값 |
|---|---|
| Replication Lag | 0~1초 (간헐적 스파이크) |
| IO Thread | Running |
| SQL Thread | Running |
HikariCP 풀 분리
| 풀 | Max | Active (부하 시) | Acquire Time |
|---|---|---|---|
| primary-pool | 5 | 0~2 | < 1ms |
| replica-pool | 15 | 3~5 | < 1ms |
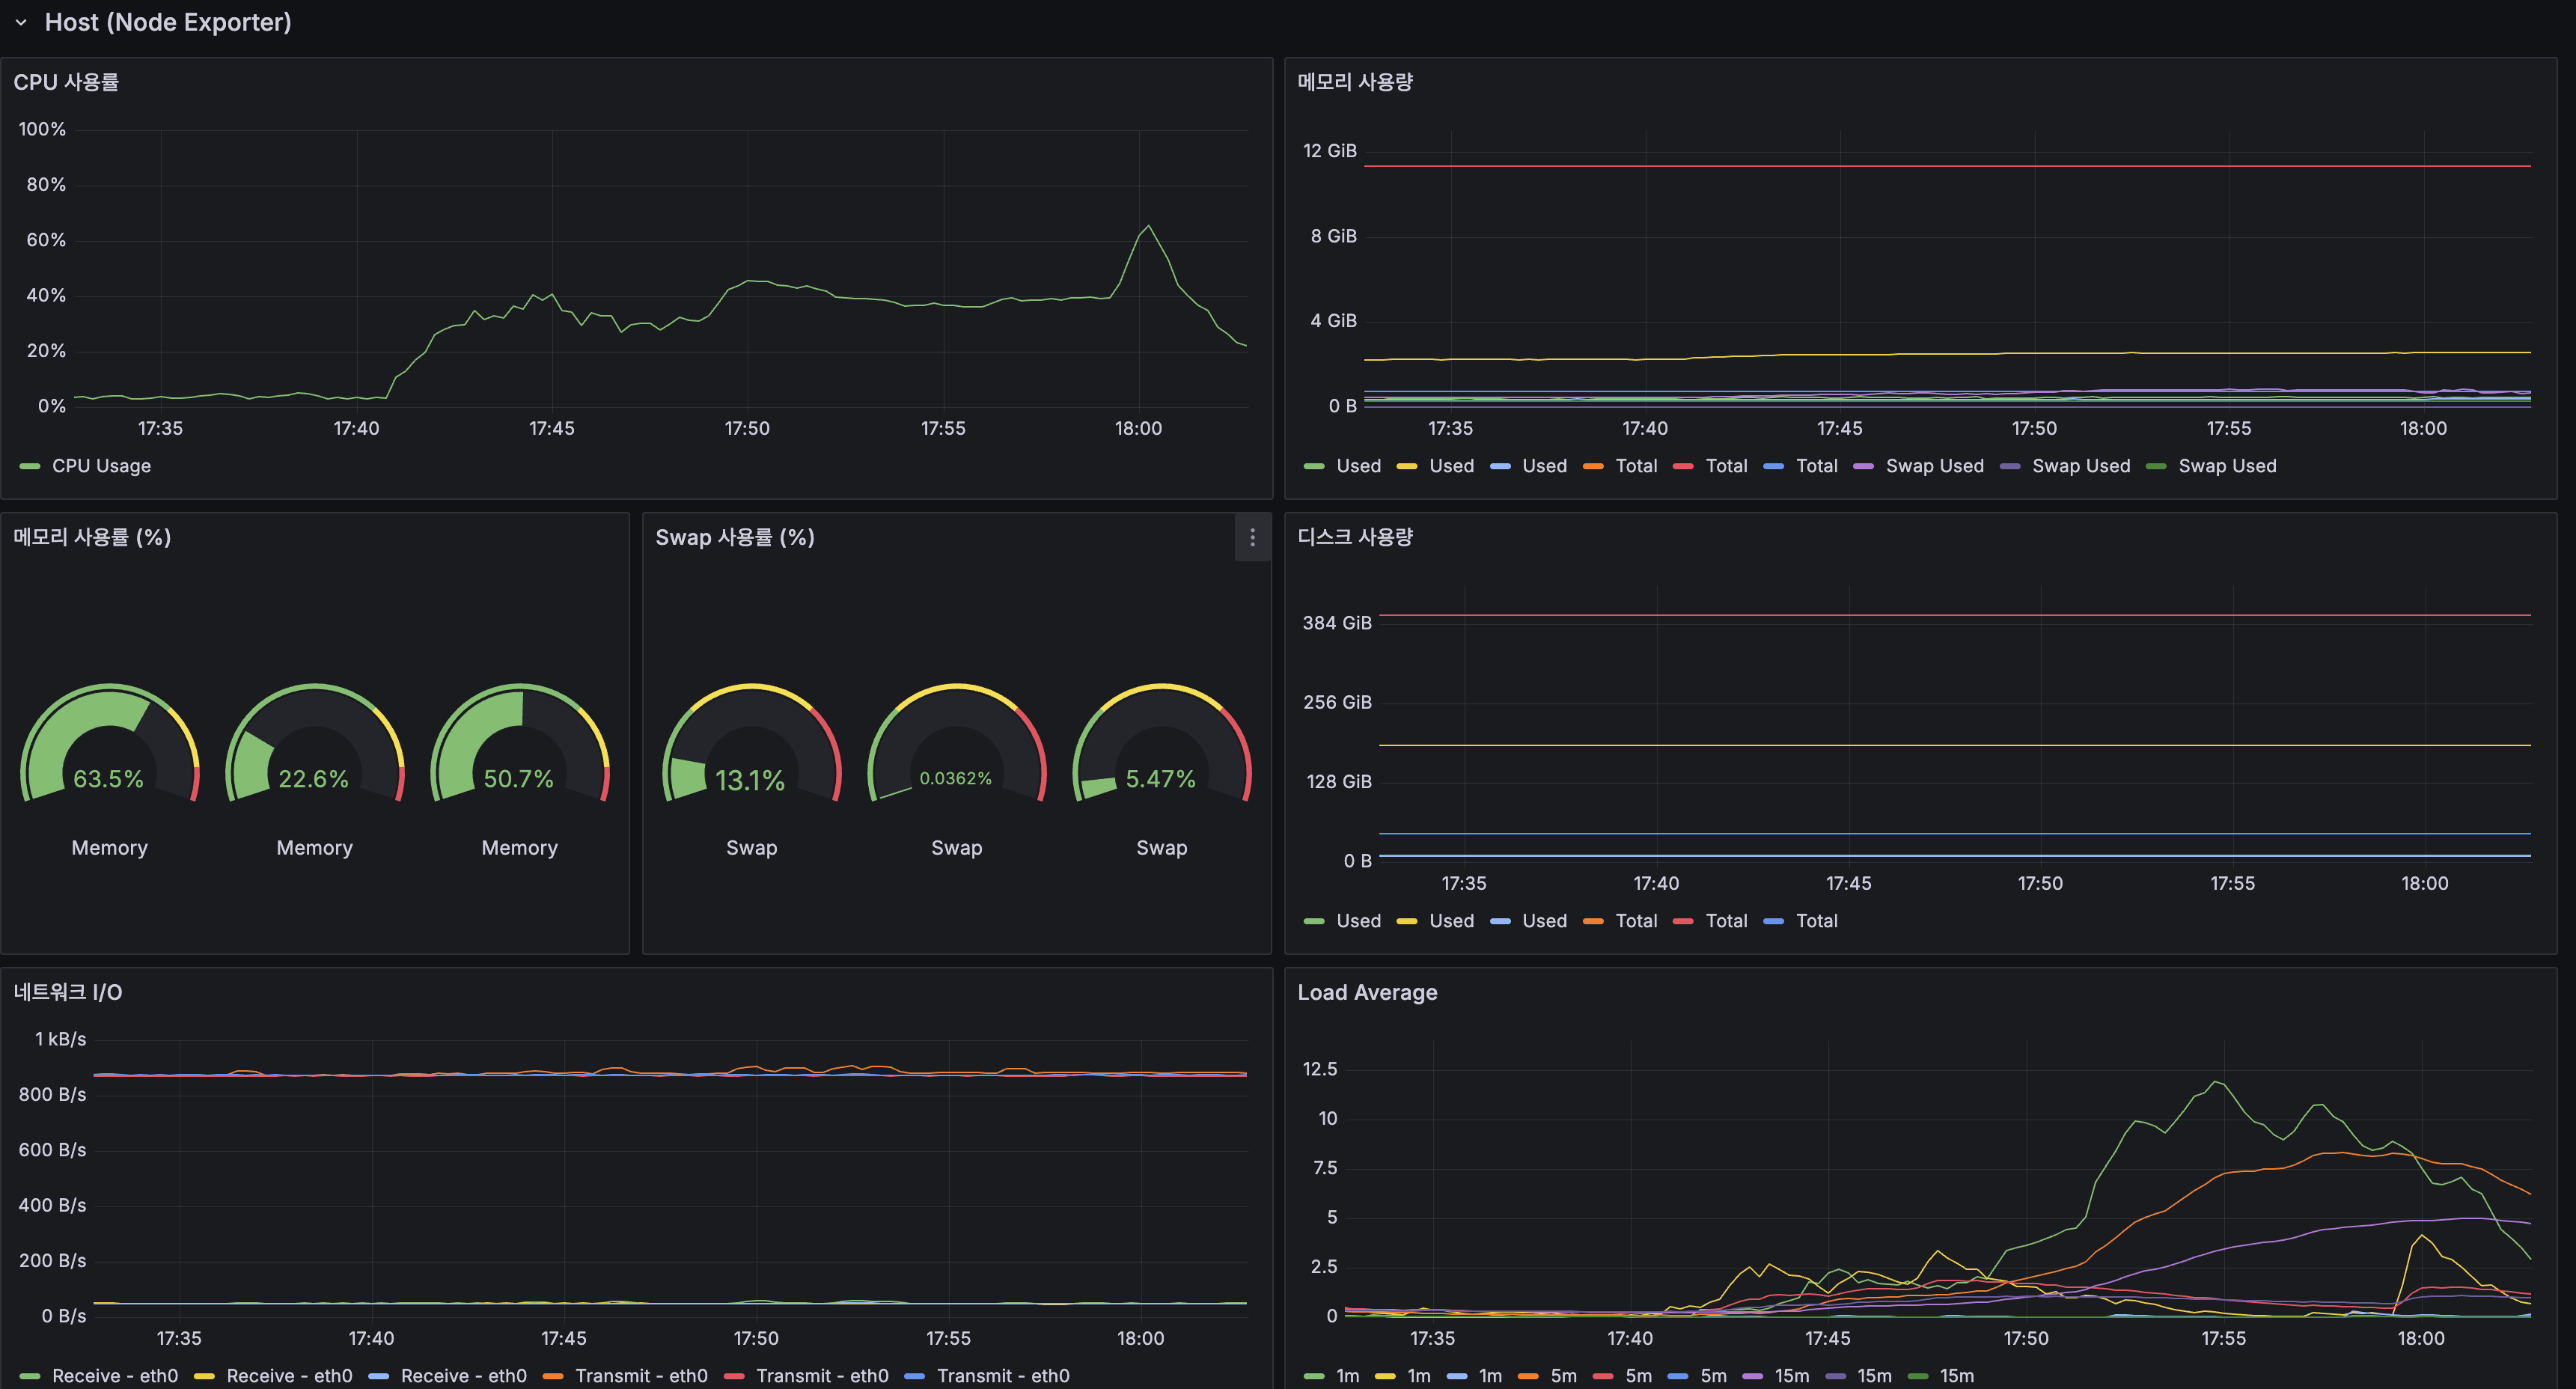
인프라
| 지표 | 값 |
|---|---|
| App CPU (피크) | ~100% (2코어 기준) |
| 호스트 CPU | ~60% |
Spring Boot / JVM
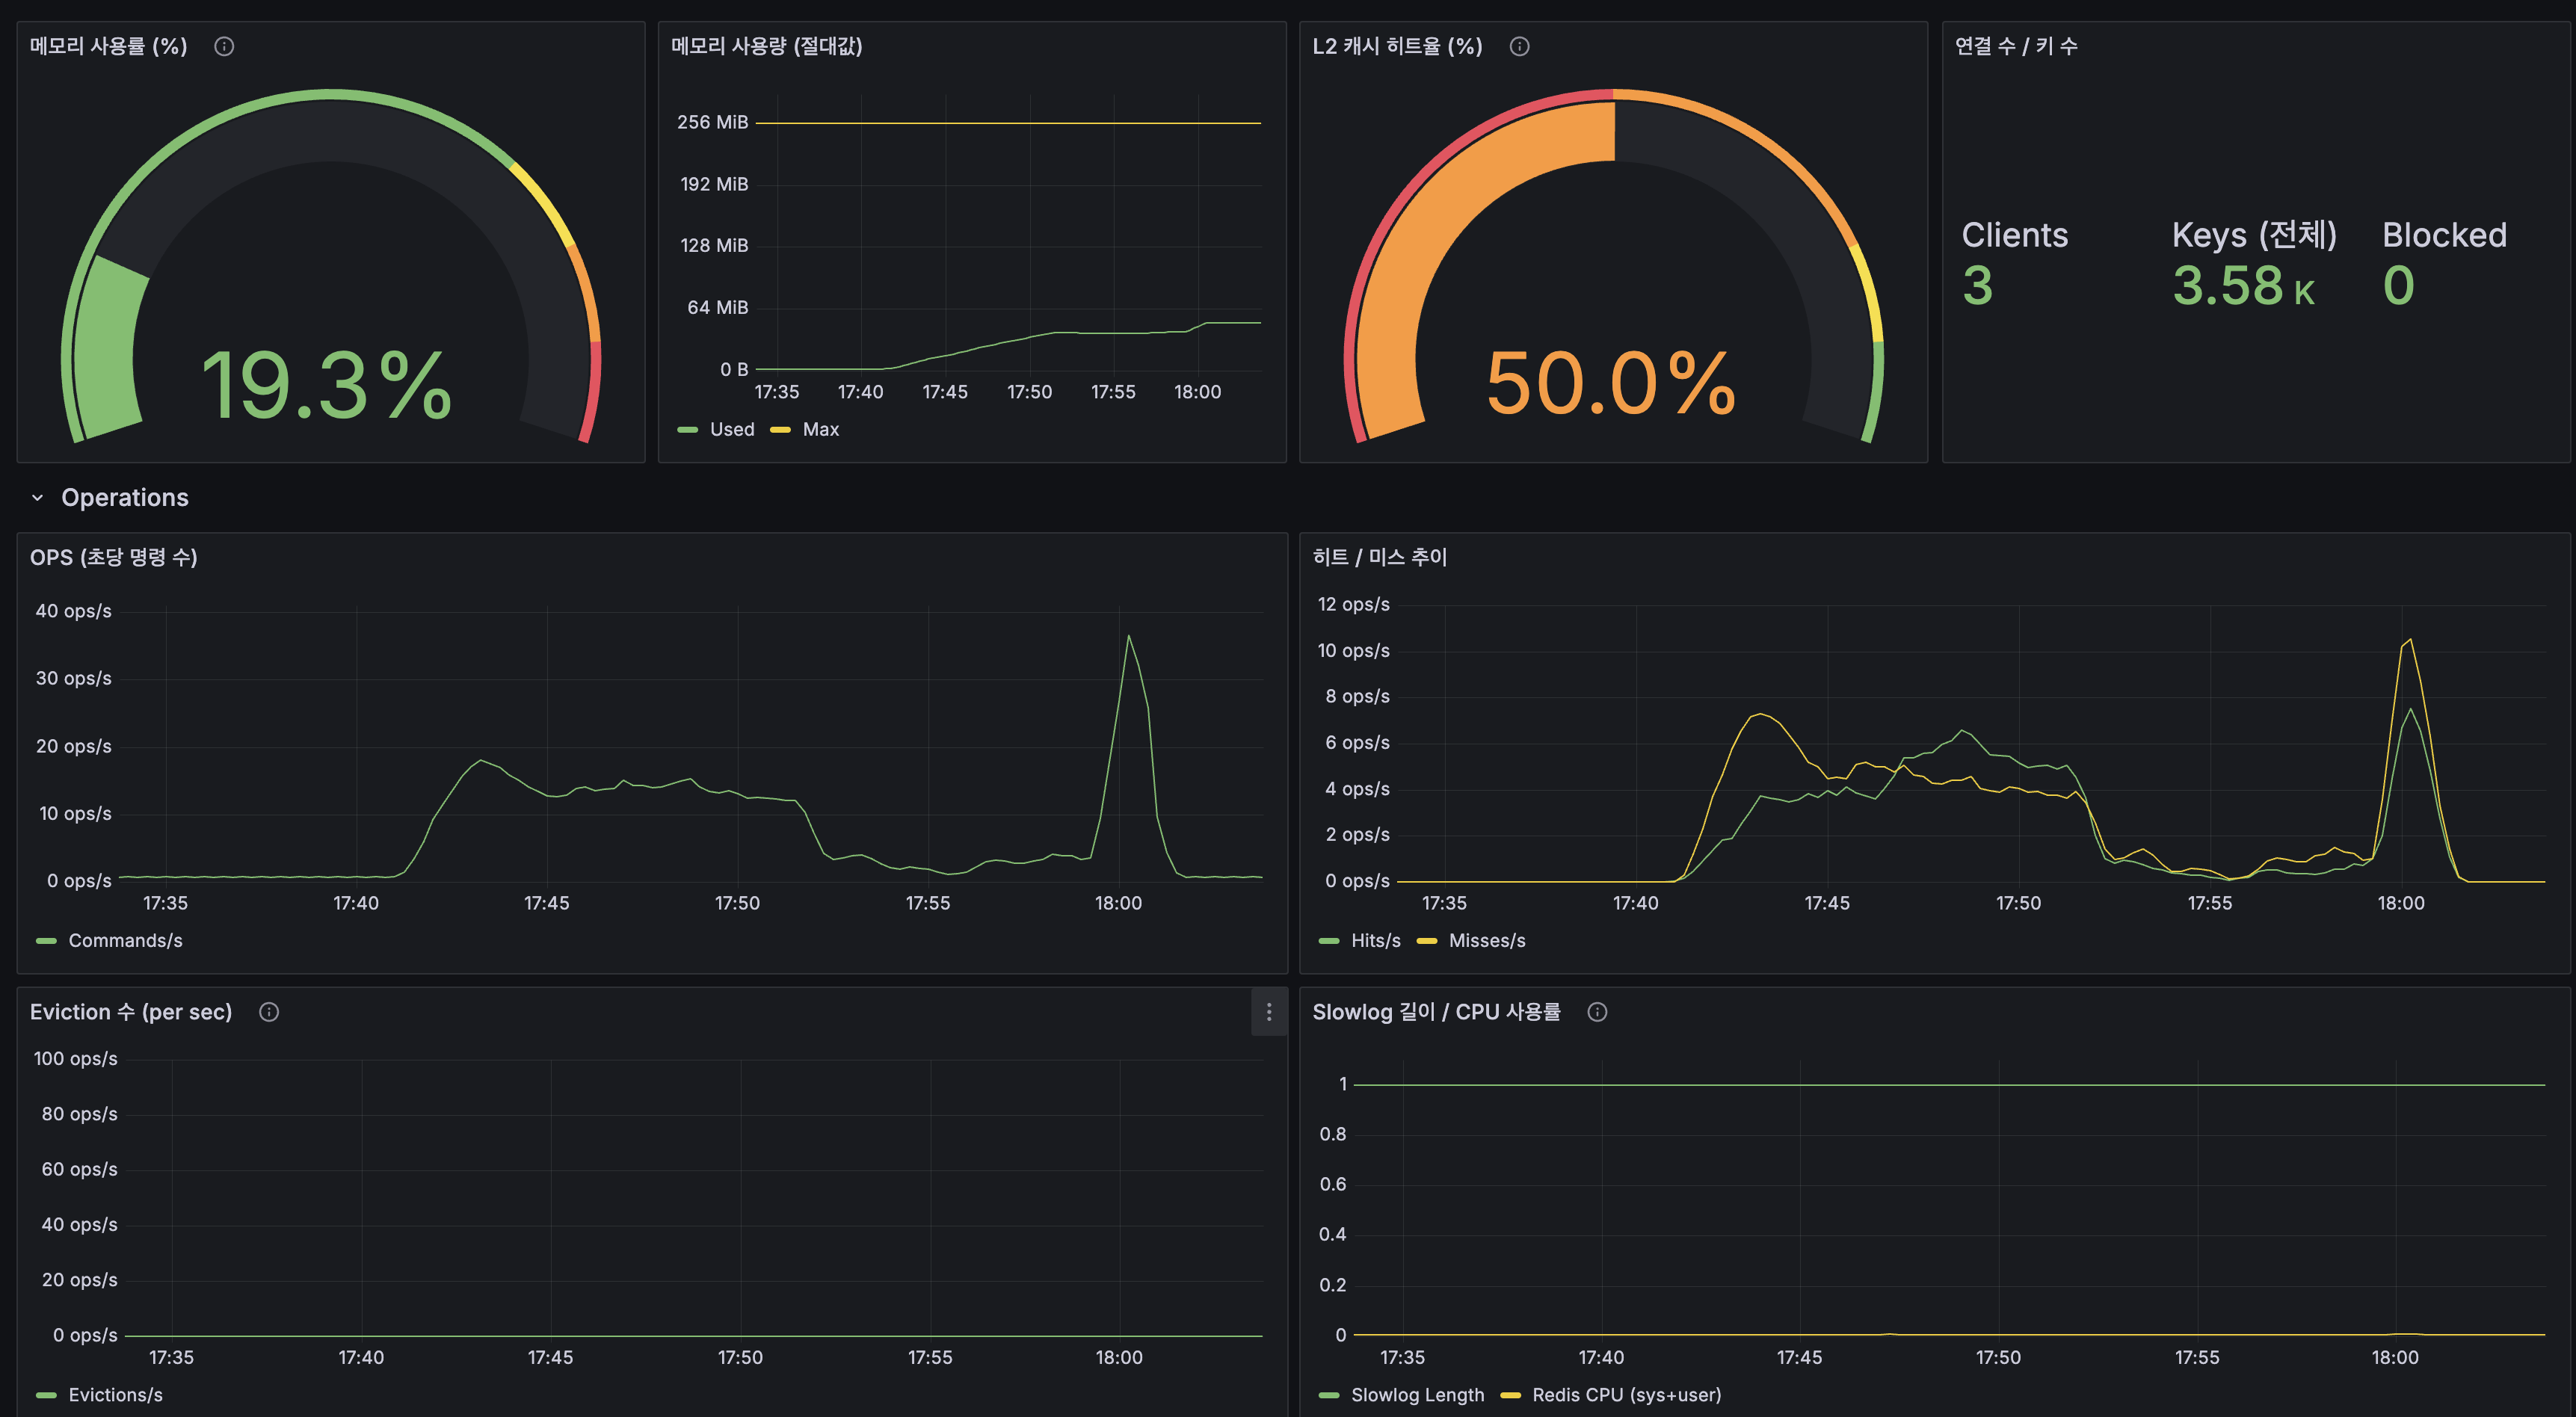
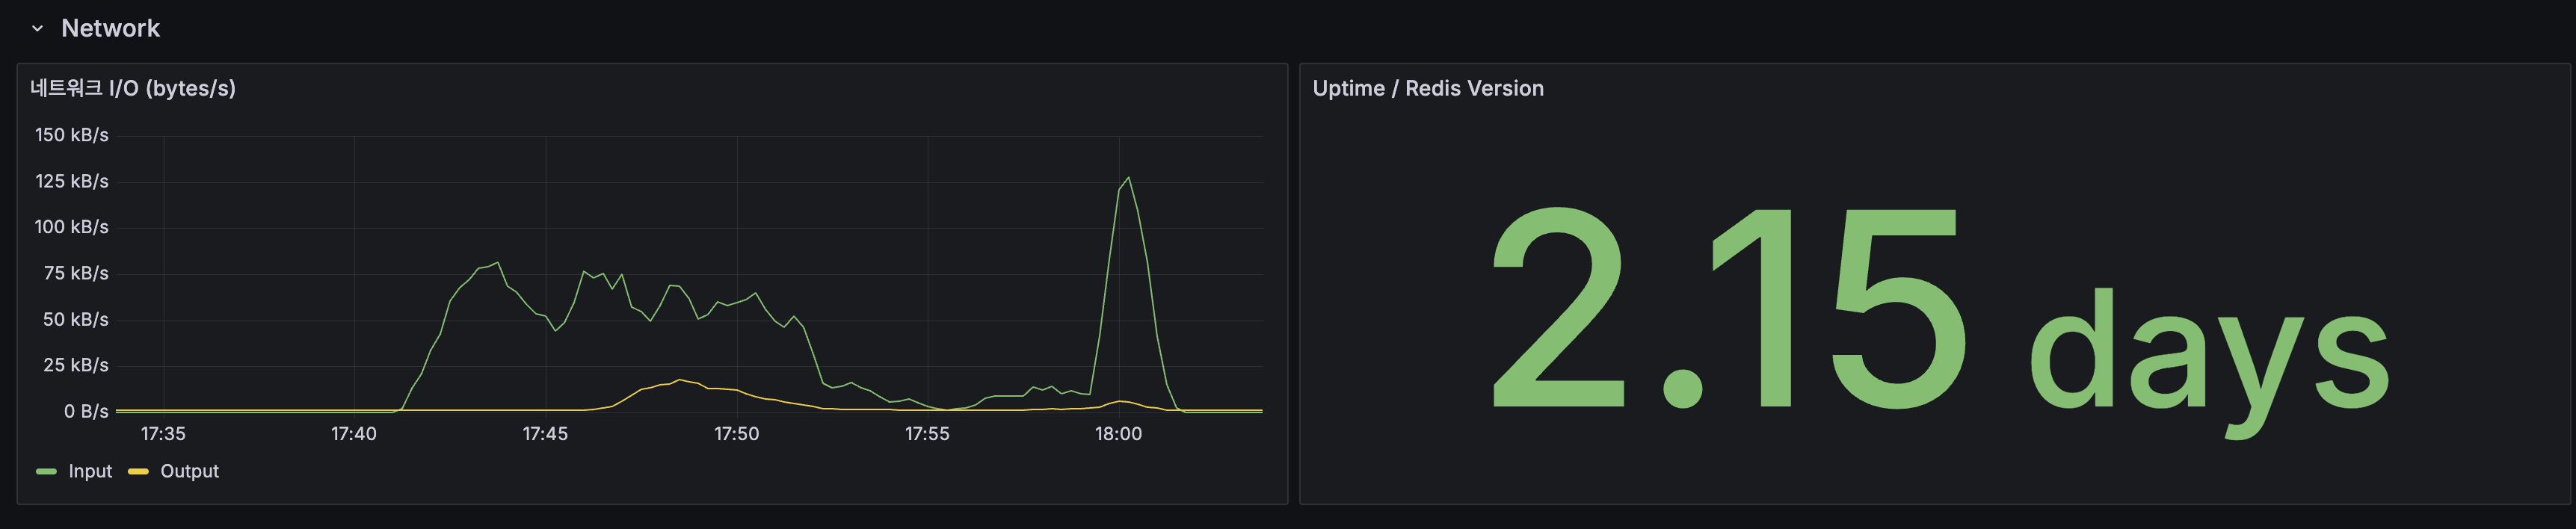
Redis / Cache
| 지표 | 값 |
|---|---|
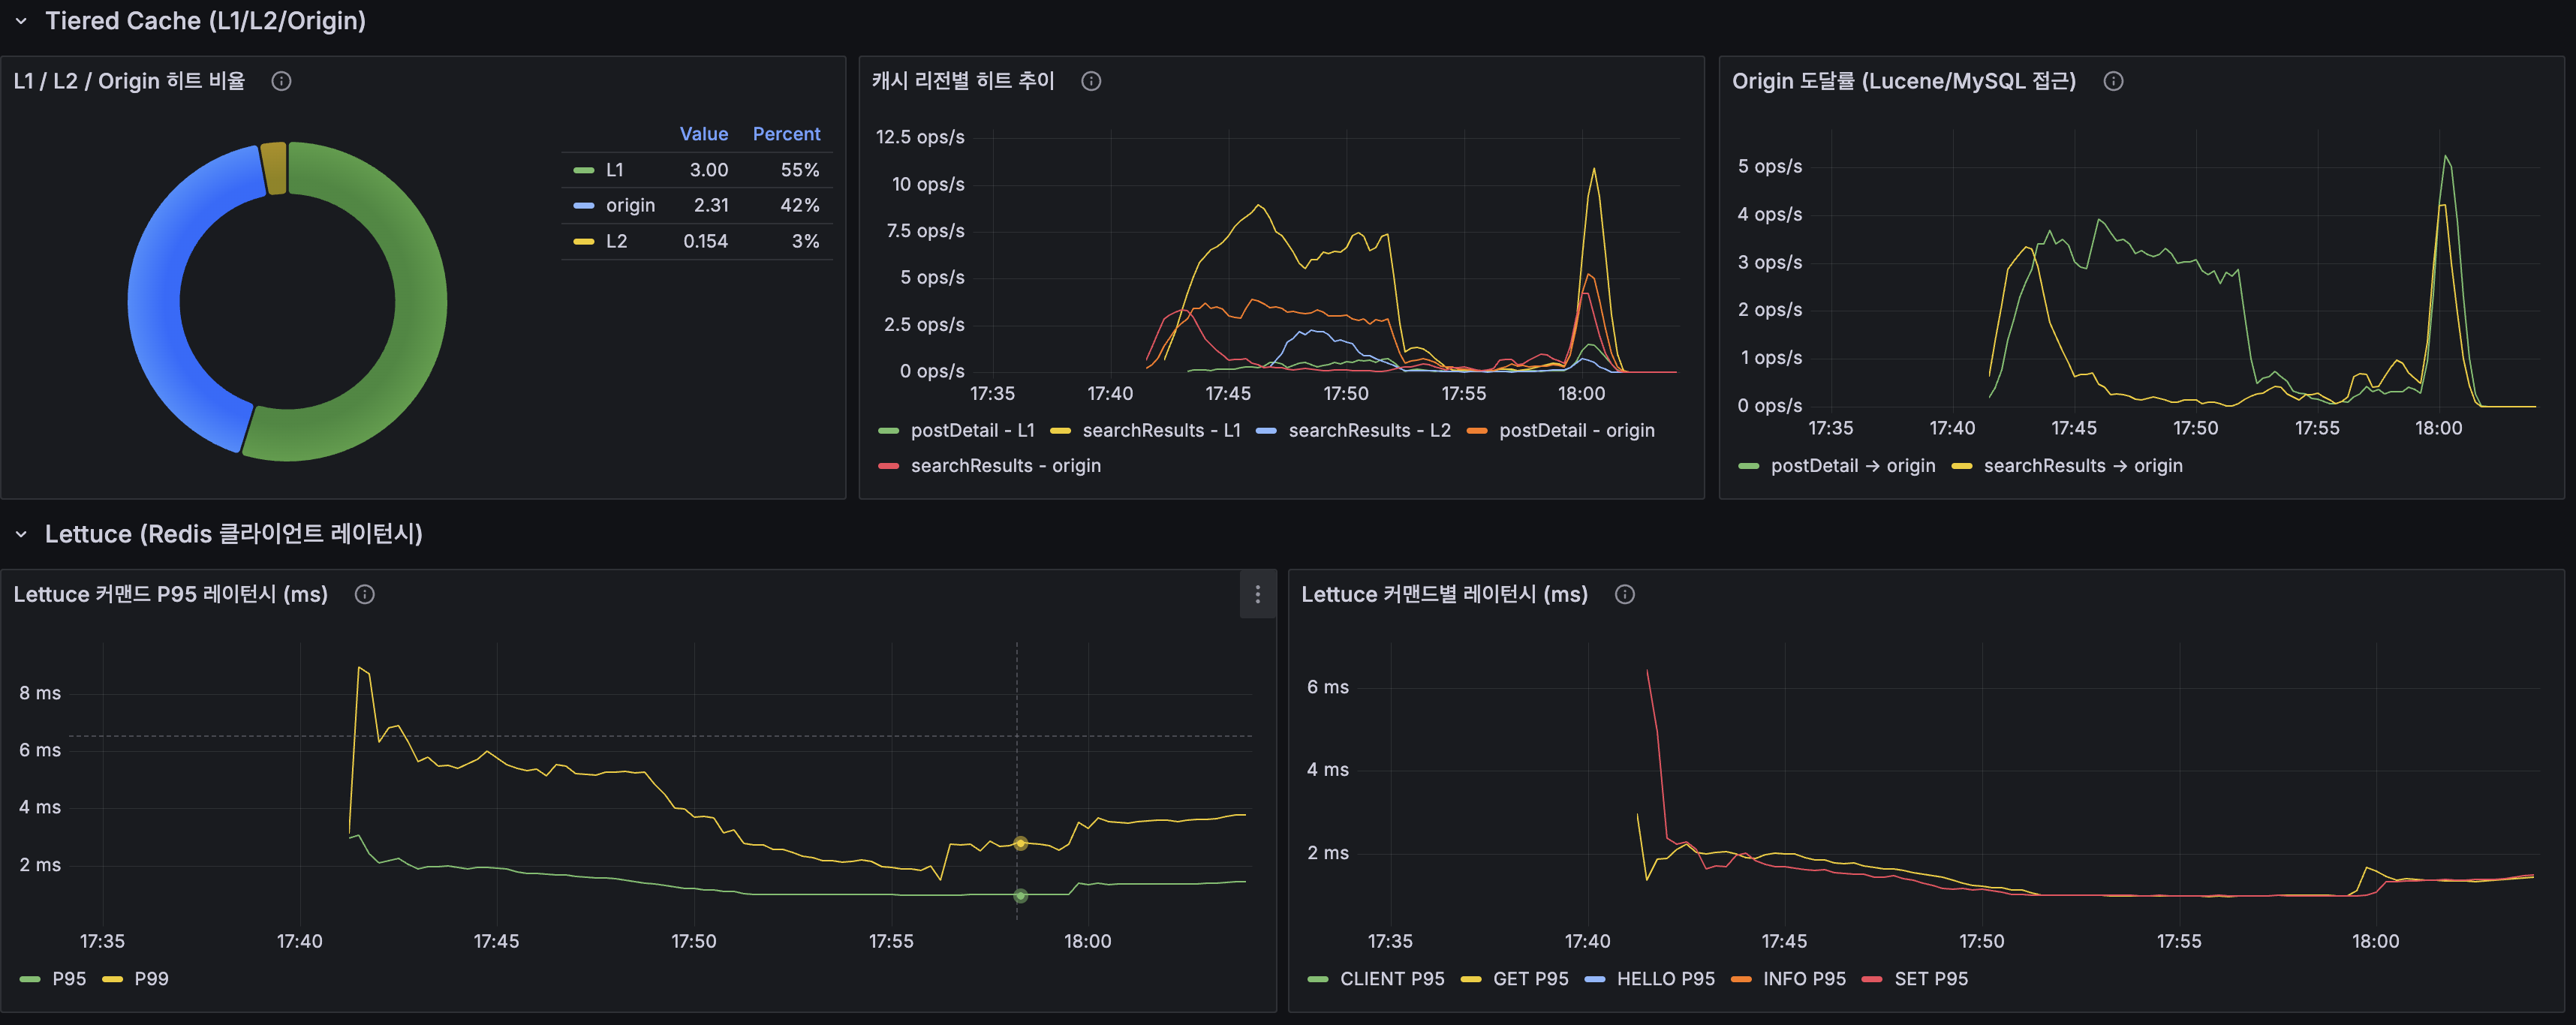
| Redis 메모리 | 19.3% (49MB / 256MB) |
| Redis L2 히트율 | 50% |
| Redis Eviction | 0 |
| Tiered Cache 분포 | L1 55%, L2 3%, Origin 42% |
| Lettuce P95 | ~3ms |
k6 Overview
8. 분석
100 VU 피크에서 에러율 13.25%와 P95 2.3초는 stress 테스트에서 확인한 App CPU 포화 패턴과 일치합니다. 병목은 MySQL이 아니라 단일 App 인스턴스의 CPU(Lucene BM25 스코어링)이며, 이는 다음 단계인 App 스케일아웃에서 해결할 대상입니다.
R/W 분리는 정상 동작합니다:
- Replica가 읽기의 대부분(~200 ops/s)을 처리하고, Primary는 쓰기(~50 ops/s)에 집중
- HikariCP primary-pool은 Active 0~2로 여유롭고, replica-pool은 Active 3~5로 안정
- Replication Lag은 부하 시에도 0~1초로 커뮤니티 서비스에 영향 없음
- Primary의 Slow Query 0건 (쓰기 전용이므로)
9. 현재 위치
성과 요약
| 목표 | 결과 |
|---|---|
| MySQL R/W 분리 | 완료: @Transactional(readOnly=true) → Replica, 기본 → Primary |
| Replication 구성 | 완료: GTID 비동기, CLONE PLUGIN 133.5GB 복사 |
| HikariCP 풀 분리 | 완료: Primary 5 + Replica 15 (합계 20 유지) |
| 모니터링 | 완료: Replication Lag/Thread 패널 + 알림 3개 |
| App 스케일아웃 전제조건 | 달성: App 2대 확장 시 DB 읽기 부하 분산 준비 완료 |
서버 현황
| 서버 | 스펙 | 역할 |
|---|---|---|
| App Server (서버 1) | ARM 2코어 / 12GB RAM | Nginx + Spring Boot + MySQL Primary + Redis + Lucene |
| DB Replica (서버 2) | ARM 2코어 / 12GB RAM | MySQL Replica + mysql-exporter |
| Monitoring #1 | AMD 1GB + Swap 1GB | Loki + Grafana + Nginx (HTTPS) |
| Monitoring #2 | AMD 1GB + Swap 1GB | Prometheus |
다음 단계: App 스케일아웃. 서버 2에 App 인스턴스를 추가하여 CPU 병목을 분산합니다.
Previous Post
In Redis L2 Cache + Autocomplete Flat KV — Retiring Trie and Stateless Transition, we implemented Caffeine(L1) + Redis(L2) tiered cache and replaced Trie autocomplete with Redis flat KV O(1) GET to make the app Stateless.
Previous Post Summary
| Post | Key Metrics | Conclusion |
|---|---|---|
| Caching Strategy | Overall response 776ms→54ms (14x) | Caffeine L1 cache introduced |
| Trie Autocomplete | Lexicographic→popularity, “삼ㅅ”→“삼성전자” | Search-log-based autocomplete |
| Stress Test | 200 VU → CPU 100%, P95 1,413ms | Single server limit ~100-150 VU |
| Redis L2 Cache | L1 73% + L2 9% = 82% hit, Origin 19% | Stateless transition complete |
The app is now Stateless, but the DB is still a single MySQL. Scaling out to 2 app instances would double HikariCP connections (20×2=40) and concentrate all read traffic on a single MySQL. MySQL Replication is needed to distribute read load.
1. Normal State — MySQL Is Not the Bottleneck
Stress test and Redis L2 cache data show MySQL is not currently the bottleneck:
| Metric | Stress Test (200 VU) | Redis L2 After (100 VU) | Assessment |
|---|---|---|---|
| InnoDB Buffer Pool Hit Rate | 100% | 100% | No DB I/O bottleneck |
| Table Lock | 0 | 0 | No lock contention |
| Row Lock | Max 300µs | Max 23µs | Negligible |
| MySQL CPU (cAdvisor) | ~0% | ~0% | MySQL barely uses CPU |
| HikariCP Acquire | 1,250ms (200 VU) | 0.1-0.5ms (100 VU) | Wait at 200 VU is a symptom of CPU saturation |
As analyzed in the stress test post: “HikariCP Active 60+ is not because the pool is insufficient, but because CPU saturation slows request processing, extending connection hold time.” The bottleneck is App CPU (Lucene BM25), not MySQL.
2. Problem Recognition — Then Why Replication?
It’s a prerequisite for the next step (App scale-out) — Bottom-Up infrastructure preparation.
Distributed transition order and rationale: Redis L2 Cache → App Stateless transition (shared cache/tokens) ← Complete Replication → DB read separation (DB load distribution at scale) ← Now App Scale-Out → App instance expansion (CPU distribution) ← Next
Why Replication before Scale-Out: 2 Apps → HikariCP connections double (20x2=40) → all reads+writes on single MySQL Currently MySQL has headroom, but with 2 apps, Origin 19% queries double → all traffic funnels into a single MySQL
Pre-separating reads to Replica: - Primary handles writes only (10-20%) → Primary load stable at scale - Replica absorbs reads (80-90%) → absorbs read load proportional to app countNot “MySQL is slow now” but “ensuring MySQL can handle the load when we add more apps” — a proactive measure.
MySQL’s official documentation (19.4.5 Using Replication for Scale-Out) defines Replication’s primary use as “distributing reads to Replicas in high-read, low-write environments.” This project’s community forum fits exactly this pattern (80-90% reads, 10-20% writes).
However, application-level optimization must be completed first before adding Replicas — adding Replicas without query tuning, indexing, and caching can actually worsen performance (Medium - Your Read Replicas Aren’t Helping). This project completed Lucene search, index optimization, and Caffeine/Redis caching before introducing Replication, so the correct order is followed.
3. Alternative Review — Why Replication Cannot Be Skipped
| Alternative | Analysis | Decision |
|---|---|---|
| Skip Replication, go straight to 2 apps | Currently MySQL has headroom, but 2 apps × HikariCP 20 = 40 connections on single MySQL. Future 3+ apps would make DB the bottleneck. Without pre-separation, emergency Replication during production is much riskier | Rejected |
| Increase HikariCP pool only (20→40) | Stress test confirmed: HikariCP bottleneck is a symptom of CPU saturation, not pool shortage | Rejected |
| Increase Redis L2 cache hit rate | L1+L2 combined 82% hit, Origin 19%. Remaining 19% is cold queries + writes, hard to reduce further with caching | Rejected |
| ProxySQL (connection proxy) | R/W split without code changes. But requires additional proxy server (Free Tier resource constraint), query parsing overhead, added failure point | Rejected (app-level routing is simpler) |
| MySQL Replication | Pre-separate reads to Replica for DB load distribution at scale. Primary = write-only, Replica = read-only | Selected |
Resource Cost Analysis (Oracle Cloud Free Tier)
This project uses Oracle Cloud Free Tier (2 servers, total 4 cores / 24GB), so infrastructure cost is a fixed resource allocation trade-off, not a monthly bill.
Replica resource cost: Server 2 MySQL Replica: 4G (InnoDB BP 2G + overhead) → Remaining on Server 2: 12G - 4.1G = ~7.9G → Sufficient for App Scale-Out App2 (2G) + Lucene page cache (~5G)
Replica benefit: Primary QPS ~300 → ~60 (writes 20% only) → CPU headroom gained App scale-out DB bottleneck eliminated Replica failure → Primary fallback → availability maintained
Verdict: 4G investment → 80% Primary CPU reduction + scale-out prerequisite → worth itAWS cost comparison reference: RDS Primary (db.r6g.large, ~$230/mo) + Read Replica (same spec, ~$230/mo). But Primary can downscale (db.r6g.medium, ~$115/mo), so total cost goes from $230 → $345 (+50%), but read TPS doubles, making cost-per-TPS actually decrease.
4. Replication Mode Selection
| Mode | Pros | Cons | Decision |
|---|---|---|---|
| Async Replication | Simple setup, no Primary performance impact | Possible Replica lag | Selected |
| Semi-sync | At least 1 ACK guaranteed | Primary write latency, plugin required | Over-engineering |
| Group Replication (InnoDB Cluster) | Auto failover, multi-Primary | Minimum 3 nodes, complex | Not feasible on Free Tier |
”Write then Read” Consistency
Post edit (PUT /posts/1 → @Transactional) and subsequent read (GET /posts/1 → @Transactional(readOnly=true)) are separate HTTP requests and separate transactions. After write commits on Primary, the read goes to Replica which may return stale data due to Replication Lag.
Decision: Allow stale reads. In a community forum, 1-2 second delay after editing is practically unnoticeable. The typical user flow (click edit → see success notification → page reload) takes ~1-2 seconds, during which Replication catches up. Async Replication lag is typically tens to hundreds of ms, so data is synced before the user notices.
5. Architecture
Server Topology
6. Implementation
6-1. MySQL Primary Configuration (Server 1)
Added Binlog + server-id + GTID to existing MySQL.
GTID rationale: Position-based (MASTER_LOG_FILE + MASTER_LOG_POS) makes failover position tracking complex. GTID (Global Transaction ID) assigns unique IDs per transaction, allowing Replica to auto-determine sync position with SOURCE_AUTO_POSITION=1.
6-2. MySQL Replica Setup (Server 2)
Initial data sync — switched from mysqldump to CLONE PLUGIN:
First attempted mysqldump (102GB) but hit 3 issues:
- Dump file missing
CREATE TABLE(schema/data separation needed) --binary-moderequired (LONGTEXT binary data)- Column length mismatch after schema load (
Data too long for column)
MySQL 8.0 CLONE PLUGIN:
CLONE INSTANCE FROM 'repl'@'10.0.0.47':3306 IDENTIFIED BY '...';- Copied 133.5GB at ~83MB/s in ~28 minutes
- GTID position auto-set (no manual GTID purge like dump)
- Replica auto-restarts, ready for
CHANGE REPLICATION SOURCE TO
6-3. Spring DataSource Routing
Critical: Must wrap with LazyConnectionDataSourceProxy.
Spring calls DataSource.getConnection() before @Transactional synchronization is initialized. At that point, TransactionSynchronizationManager.isCurrentTransactionReadOnly() always returns false, routing all queries to Primary. LazyConnectionDataSourceProxy defers connection acquisition until actual Statement creation, when transaction attributes are already set.
public class ReadWriteRoutingDataSource extends AbstractRoutingDataSource { @Override protected Object determineCurrentLookupKey() { return TransactionSynchronizationManager.isCurrentTransactionReadOnly() ? "replica" : "primary"; }}HikariCP pools split: Primary 5 (writes 10-20%) + Replica 15 (reads 80-90%) = 20 total (unchanged).
Flyway migration — Primary only via @FlywayDataSource annotation to prevent migration from running through the Routing DataSource.
6-4. Monitoring
Grafana alerts:
- Replication Lag > 10s (5min sustained) → Warning
- IO/SQL Thread stopped (1min sustained) → Critical
7. Before vs After
k6 100 VU Load Test Results
Test environment: Server 1 ARM 2-core/12GB — Spring Boot 2GB (JVM heap 1GB) + MySQL Primary 4GB (InnoDB BP 2GB) + Redis 256MB. Server 2 ARM 2-core/12GB — MySQL Replica 4GB (InnoDB BP 2GB). Data: 14.25M rows.
| Metric | Value |
|---|---|
| Total Requests | 21,120 |
| Avg Response Time | 482ms |
| P95 | 2,300ms |
| Error Rate | 13.25% |
R/W Split Observed (Grafana)
| Metric | Primary | Replica |
|---|---|---|
| QPS (normal) | ~50 ops/s | ~100 ops/s |
| QPS (peak) | ~50 ops/s | ~200 ops/s |
| Connections | ~5 | ~15 |
| InnoDB Buffer Pool Hit Rate | 99.5% | 98.9% |
| Slow Queries | 0 | 1,860 |
Replication Status
| Metric | Value |
|---|---|
| Replication Lag | 0~1s (intermittent spikes) |
| IO Thread | Running |
| SQL Thread | Running |
HikariCP Pool Split
| Pool | Max | Active (under load) | Acquire Time |
|---|---|---|---|
| primary-pool | 5 | 0~2 | < 1ms |
| replica-pool | 15 | 3~5 | < 1ms |
Infrastructure
8. Analysis
Error rate 13.25% and P95 2.3s at 100 VU peak matches the App CPU saturation pattern confirmed in the stress test. The bottleneck is not MySQL but the single App instance’s CPU (Lucene BM25 scoring), which is the target for the next step: App scale-out.
R/W split is working correctly:
- Replica handles most reads (~200 ops/s), Primary focuses on writes (~50 ops/s)
- HikariCP primary-pool Active 0~2 (comfortable headroom), replica-pool Active 3~5 (stable)
- Replication Lag stays 0~1s under load — no impact on community service UX
- Primary Slow Queries: 0 (write-only)
9. Current Status
Summary
| Goal | Result |
|---|---|
| MySQL R/W Split | Complete — @Transactional(readOnly=true) → Replica, default → Primary |
| Replication Setup | Complete — GTID async, CLONE PLUGIN 133.5GB |
| HikariCP Pool Split | Complete — Primary 5 + Replica 15 (total 20 maintained) |
| Monitoring | Complete — Replication Lag/Thread panels + 3 alerts |
| App 스케일아웃 전제조건 | Achieved — DB read distribution ready for app scale-out |
Next step: App Scale-Out — Add app instance on Server 2 to distribute CPU bottleneck.

댓글
댓글 수정/삭제는 GitHub Discussions에서 가능합니다.