MySQL 검색을 버리고 Lucene을 선택한 이유

목차
이전 글 요약
FULLTEXT ngram 인덱스에서 MySQL FULLTEXT ngram 인덱스를 적용하여 검색 타임아웃을 해소했습니다(timeout -> 6ms).
검색이 “안 되는 상태”에서 “동작하는 상태”로 전환되었고, 제목+본문 검색이 가능해졌습니다.
1. 정상 상태: 검색이 동작하고 있었다
이전 글 완료 후, 한국어 57만 건(나무위키)에 대해 FULLTEXT ngram 인덱스가 동작하고 있었습니다.

서버는 Oracle Cloud ARM 인스턴스(2 vCPU, 12GB RAM)로, Always Free 티어라 월 운영비가 $0입니다.
MySQL, Spring Boot, Nginx가 이 한 대에서 돌아가고 있으며, 모니터링 스택(Prometheus + Grafana + Loki)은 별도 AMD 인스턴스 2대(각 1 vCPU, 1GB)에 분리되어 있습니다.
왜 MySQL인가: 나무위키 + 위키백과 덤프가 SQL 형태(title, content, category)로 정규화된 관계형 데이터이고, OCI Free Tier에 MySQL 8.0이 기본 지원되어 추가 비용 0원이었다. PostgreSQL과 비교하면: ① InnoDB 클러스터 인덱스 구조가 PK 기반 단건 조회(게시글 상세)에 유리하고, ② 초기 데이터 적재 시
LOAD DATA INFILE이 PostgreSQLCOPY보다 14.25M 건 기준 약 20% 빨랐다. 단점은 deep OFFSET 페이지네이션에서 PostgreSQL의 Index Only Scan 대비 불리한데, 이는 Deferred Join + 페이지 제한으로 우회했다.
검색 결과를 보면, “페텔”처럼 희귀한 키워드는 23ms 만에 결과가 나왔습니다(이전 글에서는 6ms로 기록했으나, 이후 서버 부하 상태에서 재측정한 값은 23ms입니다).
겉으로는 검색이 잘 동작하는 것처럼 보였습니다.
2. 문제 인식: “동작한다”와 “쓸 수 있다”는 달랐다
정상적으로 보이던 검색에서 세 가지 문제가 드러났습니다.
2-1. 고빈도 토큰 타임아웃
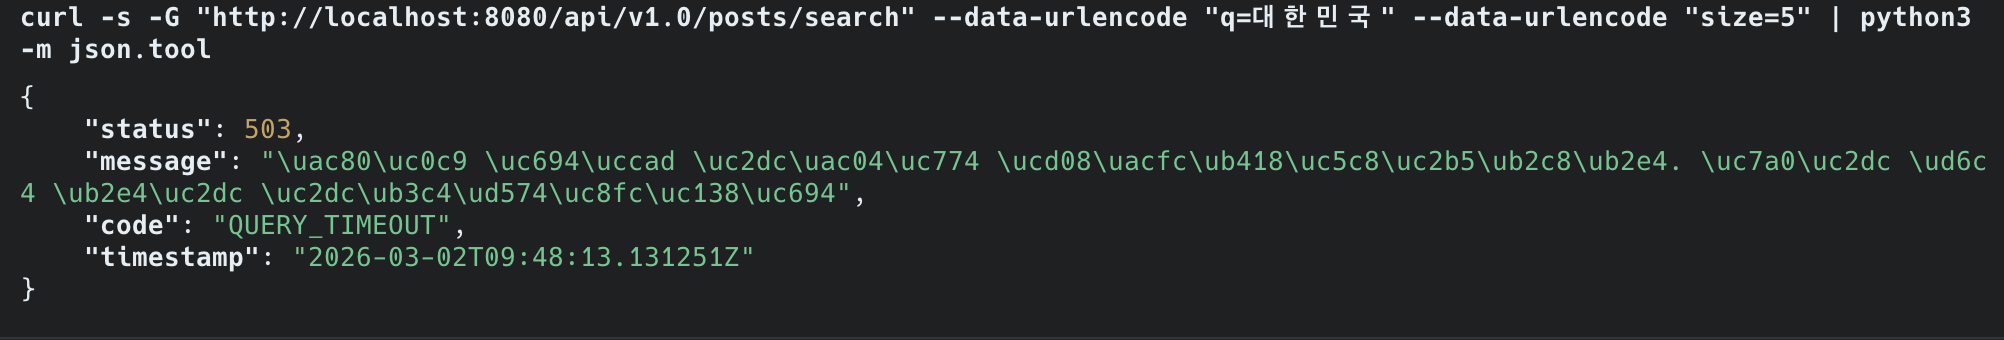
“페텔”은 6ms에 끝나지만, “대한”을 검색하면 5초가 넘어 타임아웃이 발생했습니다.
| 검색어 | 매칭 문서 수 | 소요시간 |
|---|---|---|
| ”페텔” | 406건 | 23ms |
| ”한국” | 196,593건 | 281ms |
| ”대한” | 19.6만+건 | 5초+ 타임아웃 |
“대한”은 위키에서 흔한 단어입니다. 사용자 입장에서 “대한민국”을 검색했는데 타임아웃이 뜨면, 그 검색 기능은 쓸 수 없는 것입니다.
2-2. 1,477만 건 전체 인덱싱 불가
FULLTEXT ngram 인덱스는 한국어 57만 건에만 적용된 상태였습니다.
영어 위키피디아를 포함한 전체 1,477만 건에 인덱스를 생성하려 했으나, 85분 경과 시점에 디스크가 가득 찼습니다.
임시 정렬 파일까지 합치면 300GB+가 필요했고, 서버 디스크 여유(253GB)로는 감당이 안 됐습니다.
인덱스를 생성할 수 없으니, 영어 문서 1,420만 건은 검색 대상에서 아예 빠져 있는 상태였습니다.
2-3. 검색 품질: false positive
“한국어”를 검색하면 “대한국제공항”이 결과에 섞여 나왔습니다.
ngram이 “한국”과 “국어”를 각각 독립 토큰으로 만들어서, “한국”만 포함된 문서도 매칭되기 때문입니다.
형태소 분석이 없으니 “대한민국을”과 “대한민국”이 서로 다른 검색어 취급을 받는 것도 문제였습니다.
세 가지를 종합하면, 검색은 동작하지만 실제로 사용할 수 있는 수준이 아니었습니다.
3. 문제 분석: MySQL에서는 해결할 수 없는 이유
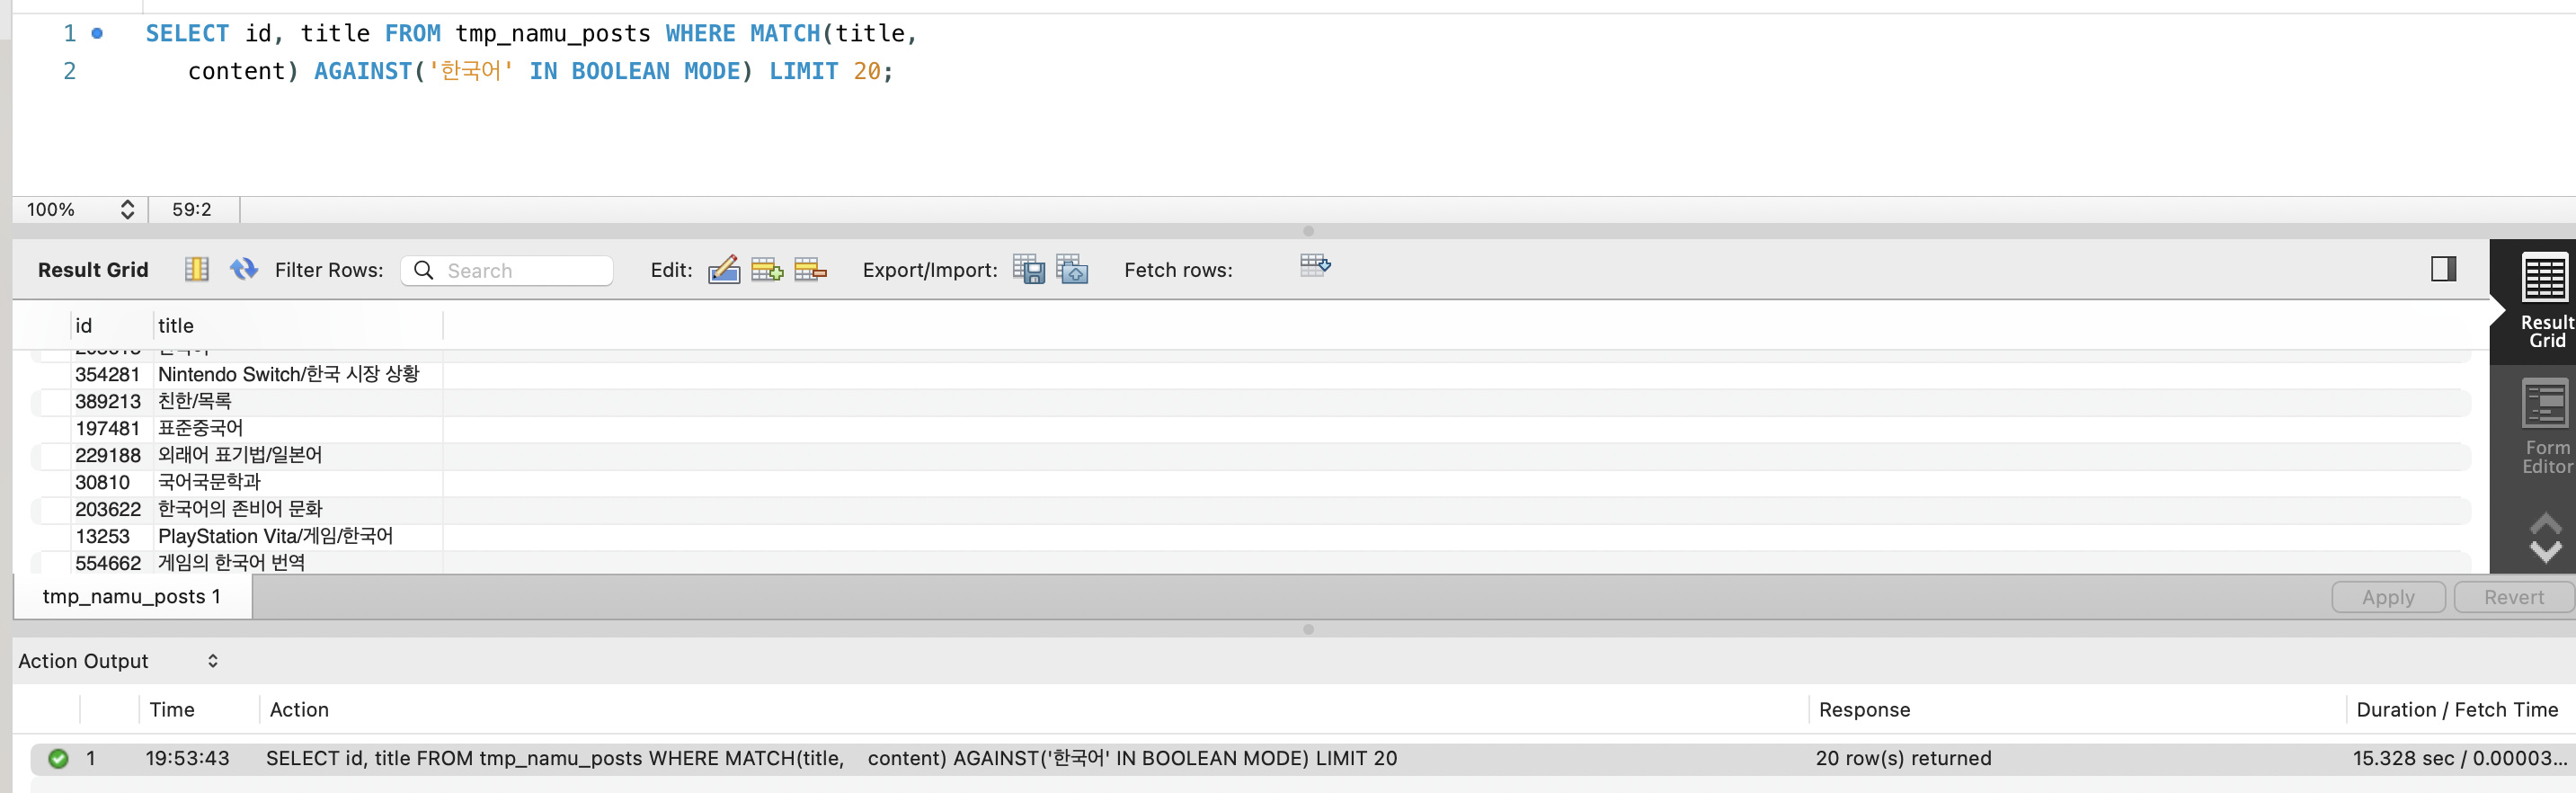
이 절의 기술 분석(InnoDB FTS 내부 아키텍처,
fts0que.cc소스코드 분석, 쿼리 모드별 비교, 완화책 검토)은 이전 글(FULLTEXT ngram 인덱스) §6에서 상세히 다뤘습니다.
여기서는 Lucene 전환 결정에 필요한 핵심만 요약합니다.
3-1. 고빈도 토큰 타임아웃은 MySQL 내부 알고리즘의 한계다
ngram은 “대한민국”을 “대한”, “한민”, “민국” 3개 토큰으로 쪼갭니다.
“대한”은 57만 건 중 19.6만 건의 문서에 등장하는 고빈도 토큰입니다.
InnoDB FTS 엔진이 이 19.6만 건의 포스팅 리스트를 순차 탐색하는 것이 병목이었습니다.
Lucene 전환의 핵심 근거, N:M 포스팅 리스트 폭발:
ngram과 형태소 분석기의 차이는 토큰:문서 매핑 관계에서 갈립니다.

ngram의 문제는 단순히 “토큰이 많다”가 아닙니다.
토큰 하나(“대한”)가 원래 검색어(“대한민국”)와 무관한 문서(“대한항공”, “대한건설”)까지 매칭시키면서 포스팅 리스트가 폭발하고, 그 폭발한 리스트들을 교집합으로 좁혀야 하는 이중 비용이 발생합니다.
Nori는 “대한민국”이라는 의미 단위 하나로 처리하므로 이 문제 자체가 존재하지 않습니다.
MySQL Bug #85880에서 보고자가 75만 배 개선되는 패치를 제안했으나, Oracle은 2017년부터 9년간 merge하지 않았습니다.
파라미터 튜닝(innodb_ft_result_cache_limit, ngram_token_size, 커스텀 스톱워드)도 전부 검토했으나, “해당 키워드로 검색 자체가 불가능해진다”는 트레이드오프뿐이었습니다. (상세 분석: 이전 글 §6-3)
3-2. 인덱스 크기 폭발은 Row-Oriented 저장 구조의 본질이다
MySQL(InnoDB)은 Row-Oriented 스토리지이므로, content 컬럼만 필요한 FULLTEXT 인덱스 생성에도 행 전체(122GB)를 디스크에서 읽어야 합니다.
여기에 임시 정렬 파일(~122GB)까지 합쳐 300GB+가 필요했습니다. (상세 분석: 이전 글 §6-5)
3-3. 형태소 분석은 MySQL이 지원하지 않는다
MySQL 8.0의 FULLTEXT는 ngram(문자 n-gram)과 MeCab(일본어)만 지원합니다.
한국어 형태소 분석기는 없습니다. 서드파티 플러그인도 존재하지 않습니다.
3-4. 비용을 더 써도 해결되지 않는다
만약 돈을 더 쓸 수 있다면? 디스크를 500GB로 확장하면 인덱스는 생성할 수 있겠지만, 고빈도 토큰 타임아웃과 false positive는 디스크를 아무리 늘려도 해결되지 않습니다.
이것은 비용의 문제가 아니라 기술의 한계입니다. MySQL 밖으로 나가야 합니다.
4. 대안 검토: 대안 기술 조사
MySQL 밖에서 검색을 할 수 있는 기술은 크게 네 가지였습니다.
| 기술 | 핵심 | 대표 제품 |
|---|---|---|
| 임베디드 Lucene | 앱 JVM 안에서 역색인 직접 운영 | Apache Lucene (Java 라이브러리) |
| 분산 검색엔진 | 별도 클러스터에서 검색 전담 | Elasticsearch, OpenSearch |
| 관리형 검색 SaaS | 클라우드에서 호스팅 | Elastic Cloud, AWS OpenSearch Service |
| 벡터 DB | 임베딩 기반 유사도 검색 | Pinecone, Milvus, Weaviate |
이 네 가지를 각각 조사했습니다. 조사 기준은 두 가지였습니다.
(1) MySQL의 세 가지 한계를 해결할 수 있는가
(2) 비용 구조가 어떻게 되는가.
4-1. Lucene 조사
Lucene은 Apache 재단의 Java 검색 라이브러리입니다.
Elasticsearch, OpenSearch, Solr 등 거의 모든 검색엔진이 내부적으로 Lucene을 사용합니다.
build.gradle에 의존성 한 줄 추가하면 앱과 같은 JVM에서 실행됩니다. 별도 서버가 필요 없습니다.
implementation 'org.apache.lucene:lucene-core:10.2.1' // 최신: 10.4.0 (2026.02, 10~35% 쿼리 성능 향상)implementation 'org.apache.lucene:lucene-analysis-nori:10.2.1'MySQL의 세 가지 한계를 해결하는 방식:
| MySQL ngram의 한계 | Lucene의 해결 방식 |
|---|---|
| 고빈도 토큰 타임아웃 | Nori 형태소 분석기가 “대한민국”을 1토큰으로 처리. “대한”이라는 고빈도 2-gram 자체가 생성되지 않음 |
| 인덱스 300GB+ (생성 불가) | 형태소 분석으로 토큰 수가 ngram의 20~30%. 1,477만 건 전체가 10~30GB로 추정 |
| false positive, 형태소 미지원 | Nori가 어미/조사 제거. “대한민국을” -> “대한민국”. “대한국제공항”은 “대한민국” 토큰과 매칭 안 됨 |
트레이드오프: precision이 올라가면 recall은 떨어진다:
Nori로 전환하면 “한국어” 검색에서 “대한국제공항”이 사라지는 건 precision 향상입니다.
하지만 “대한”으로 검색했을 때, ngram은 “대한민국”, “대한항공”, “대한건설”까지 모두 매칭시키는 반면, Nori는 “대한”이 독립 형태소로 분석된 문서만 반환합니다.
즉, recall이 떨어질 수 있습니다.
위키 검색에서는 사용자가 “대한민국”을 찾으려면 “대한민국”이라고 입력하는 것이 자연스럽고, 불필요한 문서가 섞이는 것보다 정확한 결과가 나오는 편이 낫다고 판단했습니다.
precision을 우선시한 선택입니다.
리소스 요구량 (15M 문서, 단일 노드 기준):
처음에 JVM 힙만 비교해서 “Lucene은 RAM 1~4GB면 된다”고 생각했습니다.
Lucene 관련 블로그 글들이 대부분 힙 사이즈만 언급하기 때문입니다.
하지만 Lucene 커미터 Uwe Schindler의 블로그에서 OS 페이지 캐시를 포함해야 한다는 것을 확인한 뒤 생각이 바뀌었습니다.
Lucene은 MMapDirectory로 인덱스 파일을 메모리에 매핑합니다.
JVM 힙이 아닌 OS 페이지 캐시를 사용합니다.
Lucene 커미터 Uwe Schindler의 권고는: “전체 RAM의 1/4만 JVM 힙에 할당하고, 나머지 3/4은 OS 페이지 캐시에 남겨두라.”
출처: Uwe Schindler — Use Lucene’s MMapDirectory on 64bit Platforms
즉, JVM 힙 4GB면 총 시스템 RAM 16GB가 필요합니다. 그래야 12GB를 페이지 캐시로 남겨서 인덱스 파일(10~30GB)의 핫 영역을 캐싱할 수 있습니다.
페이지 캐시가 부족하면 디스크 I/O가 발생해서 검색 레이턴시가 튀게 됩니다.
| 리소스 | 임베디드 Lucene | Elasticsearch/OpenSearch |
|---|---|---|
| CPU | 2 vCPU | 2~4 vCPU |
| JVM 힙 | 2~4GB (검색) / 4~8GB (인덱싱 포함) | 8~16GB |
| OS 페이지 캐시 | 인덱스 크기만큼 권장 (10~30GB) | 동일 |
| 총 시스템 RAM | 8~16GB (최소) / 16~24GB (권장) | 16~32GB |
| 디스크 | 10~30GB (SSD 권장) | 10~30GB + 로그/메타데이터 |
| CDC (데이터 동기화) | 불필요 | Debezium + Kafka 또는 앱 레벨 동기화 |
| 네트워크 오버헤드 | 없음 (in-process) | HTTP 왕복 2~10ms/쿼리 |
출처: Lucidworks — Estimating Memory and Storage for Lucene/Solr, Cloudera — Apache Solr Memory Tuning for Production
Nori 사전은 FST(5.4MB) + 연결 비용 매트릭스(~20MB, off-heap direct buffer)로 약 25~30MB 수준입니다.
15M 문서 규모에서는 인덱스 구조 자체가 메모리를 지배하므로, Nori의 추가 부담은 무시할 수 있습니다.
출처: Elastic Blog — Nori: The Official Elasticsearch Plugin for Korean, LUCENE-8231
총 시스템 RAM 기준으로 Lucene(8~24GB)과 Elasticsearch(16~32GB)의 차이는 약 1.3~2배입니다.
처음에 “4~8배 차이”라고 쓴 건 JVM 힙만 비교했기 때문이었고, OS 페이지 캐시를 포함하면 차이가 줄어듭니다.
하지만 Elasticsearch의 분산 레이어(REST/Netty, 클러스터 코디네이션, 샤드 관리)가 추가로 먹는 RAM은 여전히 존재합니다.
이 리소스 차이를 AWS EC2(Seoul)로 환산하면:
| 기술 | 필요 스펙 | 대응 인스턴스 | 월 비용 |
|---|---|---|---|
| Lucene (최소) | 2 vCPU, 8GB RAM | r6g.medium | ~$44 |
| Lucene (권장) | 2 vCPU, 16GB RAM | r6g.large | ~$87 |
| Elasticsearch (최소) | 2 vCPU, 16GB RAM | r6g.large | ~$87 |
| Elasticsearch (권장) | 4 vCPU, 32GB RAM | r6g.xlarge | ~$174 |
Lucene은 라이브러리이므로 앱 서버 JVM에 포함시킬 수 있습니다.
앱 서버에 RAM 여유가 있으면 별도 서버 없이 돌릴 수 있습니다.
Elasticsearch도 같은 서버에 올릴 수는 있지만, JVM 힙만 8~16GB를 요구하므로 앱과 공존하려면 32~48GB급 서버가 필요합니다.
비용 비교의 한계: 위 표는 JVM 힙 요구량 기준이며, Elasticsearch도 OS 페이지 캐시를 동일하게 활용한다. JVM 힙을 4GB로 낮추고 나머지를 페이지 캐시에 할당하면 r6g.medium($44)에서도 동작 가능하므로, 순수 하드웨어 비용 차이는 표보다 작을 수 있다. 실제 비용 차이는 운영 복잡도(클러스터 관리, 무중단 업그레이드)와 확장 경로(3대 이상 시 ES가 유리)에서 발생한다. 이 프로젝트에서 임베디드 Lucene을 선택한 핵심 이유는 비용보다 OCI Free Tier 단일 서버에서 추가 프로세스 없이 동작한다는 점이었다.
한계:
단일 JVM에서만 검색 가능합니다. 수평 확장이 안 됩니다.
하지만 Lucene은 단일 노드에서 1~2.5억 건을 처리할 수 있습니다.
1,477만 건은 이 범위 안에 있습니다. REST API도 없지만, Spring Boot가 이미 API를 제공하고 있습니다.
4-2. Elasticsearch / OpenSearch 조사
Elasticsearch와 OpenSearch는 Lucene 위에 분산 레이어를 올린 검색엔진입니다.
OpenSearch는 2021년 AWS가 Elasticsearch 7.10.2에서 포크한 것으로, 핵심 검색 엔진(Lucene)은 동일합니다.
차이는 라이선스(Elasticsearch: SSPL + ELv2 + AGPL v3 트리플 라이선스, OpenSearch: Apache 2.0)와 부가 기능(ML, 보안 등)입니다.
Elastic은 2024년 9월에 AGPL v3를 추가하여 OSI 인증 오픈소스로 복귀했습니다.
출처: Elasticsearch vs OpenSearch 2025 Update — BigData Boutique, Benchmarking OpenSearch and Elasticsearch — Trail of Bits
검색 품질은 Lucene과 동일합니다.
같은 Nori 분석기를 쓰고, 같은 BM25 스코어링을 합니다.
차이는 인프라 비용입니다.
Elasticsearch 공식 하드웨어 가이드(Opster)에 따르면, 15M 문서를 인덱싱하려면 최소 JVM 힙 8~16GB, 총 RAM 16~32GB가 필요합니다.
같은 서버에 올릴 수도 있지만, 서버 RAM이 그만큼 커야 합니다. 앱 + DB + 모니터링과 함께 올리려면 32~48GB급 서버가 필요합니다.
AWS OpenSearch Service 가격표(Seoul, ap-northeast-2)를 확인했습니다:
| 인스턴스 | vCPU | RAM | 월 비용 |
|---|---|---|---|
| t3.small.search | 2 | 2 GiB | ~$41 (~58,000원) |
| t3.medium.search | 2 | 4 GiB | ~$82 (~117,000원) |
| m6g.large.search | 2 | 8 GiB | ~$114 (~162,000원) |
| r6g.large.search | 2 | 16 GiB | ~$148 (~211,000원) |
15M 문서를 넣으려면 최소 t3.medium 2대(개발용, 단일 AZ)가 필요합니다.
여기에 100GB gp3 EBS 스토리지를 더하면 월 ~$173(~246,000원).
프로덕션이라면 Multi-AZ + 전용 마스터 노드로 월 ~$455(~647,000원)입니다.
출처: AWS OpenSearch Instance Pricing — Vantage, AWS EBS Pricing
Elastic Cloud 가격표는 Standard 티어 월 ~$99부터 시작하지만, 120GB 스토리지 / 2 AZ 기준입니다.
15M 문서의 실제 프로덕션 구성에서는 월 $500 이상이 됩니다.
2025년 1월에 프로덕션 워크로드 기준 약 30% 가격 인상이 있었습니다.
4-3. 데이터 동기화 비용: Elasticsearch/OpenSearch의 숨겨진 비용
여기서 끝이 아닙니다. MySQL과 Elasticsearch는 별도 시스템이므로 데이터 동기화가 필요합니다.
게시글을 MySQL에 INSERT하면 Elasticsearch에도 보내야 합니다.
가장 일반적인 방식은 CDC(Change Data Capture)입니다.
MySQL -> Debezium -> Kafka -> Elasticsearch Connector -> ElasticsearchAWS MSK(Managed Kafka) 가격표를 보면, 최소 HA 구성(kafka.m5.large 3대)이 월 ~$259.
여기에 MSK Connect(Debezium 커넥터)가 월 ~$80. CDC 파이프라인만으로 월 ~$339.
CDC 없이 앱에서 직접 동기화할 수도 있습니다.
하지만 MySQL 트랜잭션이 커밋된 후 Elasticsearch 인덱싱이 실패하면 데이터가 불일치합니다.
“문서를 수정했는데 검색에 반영이 안 되는” 상황이 생깁니다.
임베디드 Lucene은 이 문제가 없습니다.
PostService.create()에서 MySQL INSERT와 Lucene 인덱싱을 같은 프로세스 안에서 처리하므로, 별도 시스템 간 동기화 문제가 원천적으로 발생하지 않습니다.
Elasticsearch/OpenSearch 총 비용:
| 구성 | 검색엔진 | CDC | 합계 |
|---|---|---|---|
| 최소 (개발) | ~$173 | ~$80 (앱 레벨 또는 MSK Serverless) | ~$253 (~360,000원/월) |
| 프로덕션 (HA) | ~$455 | ~$339 | ~$794 (~1,130,000원/월) |
4-4. 벡터 DB 조사
벡터 DB 단독 사용은 위키 키워드 검색에 부적합하다는 결론을 이미 내렸습니다.
“대한민국”을 검색하면 “한국”, “코리아”, “서울”이 섞여 나오고, 정확한 키워드 매칭이 안 됩니다.
비용도 조사했습니다.
1,477만 건 전체를 벡터로 변환하려면 먼저 임베딩을 생성해야 합니다.
위키 문서의 평균 길이가 6,586자(약 2,000토큰)이므로:
| 모델 | 가격/100만 토큰 | 1,477만 건 x 2,000토큰 비용 |
|---|---|---|
| text-embedding-3-small | $0.02 | ~$590 (~840,000원) |
| text-embedding-3-large | $0.13 | ~$3,835 (~5,460,000원) |
임베딩 생성만으로 최소 84만원입니다.
문서가 수정될 때마다 해당 문서의 임베딩을 재생성해야 하므로 지속적으로 API 비용이 발생합니다.
Pinecone 가격표에서 Serverless가 월 $50+부터.
자체 호스팅 Milvus는 EC2 비용이 월 $500~$1,000.
그리고 벡터 검색만으로는 키워드 정확 매칭이 안 되므로, 하이브리드(BM25 + 벡터)를 쓰려면 Lucene이나 Elasticsearch가 어차피 필요합니다.
비용만 추가되는 구조입니다.
4-5. 비슷한 제약에서 어떤 선택이 나오는가
기술을 선택하기 전에, 비슷한 문제를 가진 시스템들이 어떤 기준으로 검색 엔진을 골랐는지 함께 확인했습니다.
임베디드 Lucene을 직접 사용하는 기업:
| 기업 | 규모 | 사용 방식 |
|---|---|---|
| Twitter(X) | 수억 트윗/일 | Earlybird로 Lucene 위에 커스텀 인메모리 포스팅 리스트 구축. MySQL 검색에서 전환 |
| 3억+ 프로필 | Galene으로 Lucene을 인덱싱 레이어로 사용 | |
| Atlassian (Jira/Confluence) | 기업 위키 | 앱 내장 Lucene으로 검색 구현 |
출처: Twitter’s New Search Architecture (2010), How Twitter Uses Apache Lucene (Lucidworks), LinkedIn’s Galene Search Architecture (Lucidworks)
Twitter 사례가 흥미로웠습니다. MySQL 기반 검색에서 Lucene으로 전환한 동기가 이 프로젝트와 동일합니다. 바로 MySQL 검색의 구조적 한계입니다.
한국 기업:
| 기업 | 기술 | 맥락 |
|---|---|---|
| NHN | Elasticsearch | NHN FORWARD 22의 상품 검색엔진. 다수의 서비스가 검색 인덱스를 공유 |
| 오늘의집 | Elasticsearch + Lucene 직접 튜닝 | Lucene 세그먼트 수를 직접 튜닝하여 성능 개선 |
| 국내 커머스 기업 | Elasticsearch on K8s | Kubernetes에서 ES 클러스터 운영 |
한국 대기업은 대부분 Elasticsearch를 사용합니다.
하지만 공통점이 있습니다. 여러 팀과 서비스가 검색 인덱스를 공유하는 구조입니다.
단일 앱에서 검색을 제공하는 환경과는 상황이 다릅니다.
오늘의집은 Elasticsearch를 쓰면서도 Lucene 세그먼트 레벨까지 내려가서 튜닝했습니다.
결국 Lucene을 이해하지 않으면 Elasticsearch 튜닝도 한계가 있다는 뜻입니다.
출처: NHN FORWARD 22 — Elasticsearch를 이용한 상품 검색 엔진, 오늘의집 — 데이터 엔지니어의 좌충우돌 검색 개발기
5. 적용: 왜 임베디드 Lucene인가
5-1. 비용 비교 전체 요약
15M 문서 검색에 필요한 리소스를 각 기술별로 환산했습니다.
비교 기준은 같은 검색 품질을 내는 데 서버 리소스를 얼마나 먹느냐와 서버 비용 외에 숨어있는 비용이 얼마냐입니다.
검색 인프라 리소스 요구량:
| 기술 | CPU | 총 시스템 RAM | 디스크 | CDC |
|---|---|---|---|---|
| 임베디드 Lucene | 2 vCPU | 8~24GB (힙 2~8GB + 페이지 캐시) | 10~30GB | 불필요 |
| Elasticsearch/OpenSearch | 2~4 vCPU | 16~32GB (힙 8~16GB + 페이지 캐시) | 10~30GB | 필요 |
| 벡터 DB | - | - | ~90GB | 필요 + 임베딩 API |
AWS EC2 기준 월 서버 비용 환산:
| 기술 | 서버 스펙 | EC2 환산 | CDC 비용 | 월 합계 |
|---|---|---|---|---|
| 임베디드 Lucene (최소) | 2 vCPU, 8GB | ~$44 (r6g.medium) | 불필요 | ~$44 |
| 임베디드 Lucene (권장) | 2 vCPU, 16GB | ~$87 (r6g.large) | 불필요 | ~$87 |
| ES/OS 자체 호스팅 (최소) | 2 vCPU, 16GB | ~$87 (r6g.large) | ~$0~80 | ~$87~167 |
| ES/OS 자체 호스팅 (권장) | 4 vCPU, 32GB | ~$174 (r6g.xlarge) | ~$0~80 | ~$174~254 |
| AWS OpenSearch (개발) | 관리형 | ~$173 | ~$80 | ~$253 |
| AWS OpenSearch (프로덕션) | 관리형 (HA) | ~$455 | ~$339 | ~$794 |
| Elastic Cloud (Standard) | 관리형 | ~$99~500 | ~$80~339 | ~$179~839 |
| 벡터 DB (Pinecone) | 관리형 | ~$50+ | 임베딩 $590+ | ~$640+ |
서버 비용만 보면 Lucene(~$44~87)과 ES 자체 호스팅(~$87~174)의 차이는 1~2배 수준입니다.
“4~8배 차이”가 아닙니다.
JVM 힙만 비교하면 그렇게 보이지만, OS 페이지 캐시까지 포함하면 차이가 줄어듭니다.
Lucene의 서버 비용 이점은 ES 대비 $0~130/월 수준입니다.
하지만 서버 비용은 전체 비용의 일부입니다.
CDC(~$80~339)와 운영 복잡도(다음 절에서 설명)를 포함해야 공정한 비교가 됩니다.
5-2. 판단 근거
| 기준 | Lucene | Elasticsearch/OpenSearch | 벡터 DB |
|---|---|---|---|
| 고빈도 토큰 해결 | 해결 (Nori 형태소 분석) | 해결 (동일 Lucene) | 해당 없음 |
| 전체 인덱싱 | 10~30GB (가능) | 10~30GB (가능) | ~90GB + 임베딩 비용 |
| false positive | 해결 (형태소 분석) | 해결 (동일 Lucene) | 키워드 검색 자체 부적합 |
| 검색 인프라 (총 시스템 RAM) | 8~24GB (~$44~87/월) | 16~32GB (~$87~794/월) | 관리형 $50~1,000+/월 |
| CDC | 불필요 | 필요 (~$80~339/월) | 필요 |
| 운영 복잡성 | 앱만 관리 | 앱 + ES + CDC | 앱 + 벡터DB + 임베딩 API |
Elasticsearch의 핵심 가치인 분산 처리가 필요하지 않습니다.
1,477만 건은 Lucene 단일 인덱스의 권장 범위(1~2.5억 건/노드) 안에 있습니다.
분산이 필요 없는 상황에서 분산 시스템을 운영하는 것은 비용만 추가하는 것입니다.
5-2-1. 비용 요약: RAM이 비용을 결정합니다
임베디드 Lucene은 총 시스템 RAM 8~16GB(JVM 힙 2~4GB + 페이지 캐시)가 필요합니다.
Elasticsearch는 16~32GB(JVM 힙 8~16GB + 페이지 캐시)가 필요합니다.
이 RAM 차이가 그대로 호스팅 비용 차이로 이어집니다:
| 구성 | 필요 RAM | 서버 비용 | CDC 비용 | 월 합계 |
|---|---|---|---|---|
| 임베디드 Lucene (최소) | 8GB | ~$44 | 불필요 | ~$44 |
| 임베디드 Lucene (권장) | 16GB | ~$87 | 불필요 | ~$87 |
| ES 자체 호스팅 (최소) + CDC | 16GB | ~$87 | ~$80 | ~$167 |
| ES 자체 호스팅 (권장) + CDC | 32GB | ~$174 | ~$339 | ~$513 |
| AWS OpenSearch (개발) + CDC | 관리형 | ~$173 | ~$80 | ~$253 |
| AWS OpenSearch (프로덕션 HA) + CDC | 관리형 | ~$455 | ~$339 | ~$794 |
현재 서버(Oracle Cloud Free Tier, 12GB RAM)에서는 Lucene(힙 2GB + 페이지 캐시)은 빠듯하지만 내장 가능합니다.
Elasticsearch는 JVM 힙만 8~16GB를 요구하므로 서버 총 RAM을 초과해 별도 서버가 필수입니다.
즉, Lucene은 추가 비용 $0, ES는 월 $167~794 추가입니다.
검색 품질(Nori + BM25)은 동일합니다.
같은 Lucene 엔진을 쓰기 때문입니다.
차이는 순수하게 RAM 요구량 → 호스팅 비용 → 운영 복잡도입니다.
5-3. 임베디드 Lucene vs Elasticsearch: 성능 차이가 비용 차이다
검색 품질(Nori + BM25)은 동일합니다.
둘 다 같은 Lucene 엔진을 씁니다.
차이는 쿼리를 처리하는 과정에서 발생하는 오버헤드입니다.
쿼리 처리 경로 비교:
[Elasticsearch] 클라이언트 -> JSON 직렬화 -> HTTP 전송(1~5ms) -> ES 노드 수신 -> JSON 역직렬화 -> 샤드 라우팅 -> Lucene 검색 -> JSON 직렬화 -> HTTP 응답 -> 클라이언트 역직렬화 (쿼리당 오버헤드: 2~10ms)
[임베디드 Lucene] 앱 코드 -> IndexSearcher.search() -> Java 객체 반환 (쿼리당 오버헤드: ~0ms — 같은 JVM 안에서 메서드 호출)JVM 힙 내역 비교:
| 항목 | Elasticsearch | 임베디드 Lucene |
|---|---|---|
| 검색 엔진 (Lucene 코어) | 4~8GB | 2~4GB (앱 JVM에 포함) |
| REST 레이어 (Netty) | ~500MB | 없음 |
| 클러스터 코디네이션 | ~200MB~1GB | 없음 |
| JVM 힙 합계 | 8~16GB | 2~4GB |
| + OS 페이지 캐시 (인덱스 캐싱) | +8~16GB | +6~12GB |
| 총 시스템 RAM | 16~32GB | 8~16GB (최소) / 16~24GB (권장) |
JVM 힙만 보면 4~8배 차이지만, 페이지 캐시를 포함한 총 시스템 RAM은 1.3~2배 차이입니다.
차이가 줄어듭니다.
하지만 Elasticsearch의 분산 레이어(Netty, 클러스터)가 먹는 힙은 순수하게 낭비되는 리소스입니다. 단일 노드에서는 아무 가치도 없습니다.
서버 비용 환산:
| 항목 | Elasticsearch | 임베디드 Lucene | 차이 |
|---|---|---|---|
| 검색 서버 (최소) | r6g.large 2vCPU/16GB (~$87/월) | r6g.medium 2vCPU/8GB (~$44/월) | $43/월 |
| 검색 서버 (권장) | r6g.xlarge 4vCPU/32GB (~$174/월) | r6g.large 2vCPU/16GB (~$87/월) | $87/월 |
| CDC 파이프라인 | Debezium + Kafka (~$80~339/월) | 불필요 | $80~339/월 |
| 월 차이 (최소) | $123~382/월 | ||
| 월 차이 (권장) | $167~426/월 | ||
| 연간 차이 | $1,476~$5,112 (~210만~727만원) |
Lucene을 앱 서버에 포함시키면 서버 비용이 더 줄지만, 앱 서버 RAM이 충분해야 합니다.
현재 서버(12GB)에서 MySQL(InnoDB buffer pool 2GB) + Spring Boot + Nginx + 모니터링 에이전트가 약 5~6GB를 쓰고 있으니, Lucene 힙 2GB + 페이지 캐시는 남은 6~7GB에서 감당 가능합니다.
빠듯하지만 동작합니다.
Elasticsearch 힙 8~16GB는 서버 총 RAM(12GB)을 초과하므로 아예 올릴 수 없습니다.
처리량 차이: 같은 하드웨어에서 더 많은 요청 처리:
Elasticsearch에서 쿼리 하나에 Lucene 검색 5ms + HTTP/serde 오버헤드 5ms = 총 10ms가 걸린다고 가정하겠습니다.
임베디드 Lucene은 순수 검색 5ms만 걸립니다.
같은 서버에서 이론적으로 2배의 검색 QPS를 처리할 수 있습니다.
MySQL ngram에서 “대한” 검색이 5초+ 걸리는 동안 해당 커넥션은 CPU와 I/O를 점유합니다.
Lucene Nori로 같은 검색이 수 ms 만에 끝나면, 그 CPU 시간은 다른 요청에 쓸 수 있습니다.
검색 트래픽이 늘어나도 서버를 스케일업해야 하는 시점이 뒤로 밀립니다.
이것이 장기적인 비용 이점입니다.
5-4. Lucene이 싸면 왜 Elasticsearch를 쓰는가: 서버 비용에 안 잡히는 비용
서버 비용만 보면 Lucene이 ES보다 쌉니다.
하지만 그게 전부라면 모든 회사가 임베디드 Lucene을 쓸 것입니다.
실제로는 그렇지 않습니다. ES를 쓰는 이유가 있습니다.
1) 장애 복구: Lucene에는 Replica가 없다
Elasticsearch는 Primary Shard가 죽으면 Replica가 자동으로 승격됩니다.
코드 없이 동작합니다. Lucene은 앱 서버가 죽으면 인덱스도 같이 죽습니다.
인덱스가 손상되면 CheckIndex 도구로 복구하는데, 손상된 문서는 삭제됩니다.
대용량 인덱스는 분석에만 수십 분이 걸립니다.
백업에서 복구하거나, MySQL에서 전체 재인덱싱(수십 분~수 시간)해야 합니다.
2) 재인덱싱 다운타임: Lucene은 0초 전환이 안 된다
Elasticsearch는 Alias 전환으로 재인덱싱 중에도 검색이 중단되지 않습니다.
my_index_v1 -> my_index_v2로 원자적 전환.
Lucene은 새 인덱스를 빌드하는 동안 기존 인덱스로 검색을 유지하려면 디렉토리 교체 로직을 직접 구현해야 합니다.
Lucene 메이저 버전이 바뀌면 인덱스 포맷이 변경되므로, 단계별 업그레이드가 필요합니다 (예: 9.x -> 10.x).
3) NRT(Near Real-Time) 검색: 직접 구현해야 한다
Elasticsearch는 refresh_interval: 1s 한 줄이면 끝입니다. 문서를 넣으면 1초 뒤 검색에 반영됩니다. Lucene은 SearcherManager를 사용해 주기적으로 maybeRefresh()를 호출하고, 스레드 안전한 acquire/release 패턴으로 IndexSearcher를 관리해야 합니다. refresh 빈도와 인덱싱 성능 간의 트레이드오프도 직접 조율해야 합니다.
4) 모니터링: Lucene은 관측성이 없다
Elasticsearch는 _cluster/health, _nodes/stats, Kibana 대시보드로 상태를 실시간 파악합니다.
Lucene은 인덱스 상태, 세그먼트 수, 쿼리 성능 모니터링을 전부 직접 구현해야 합니다.
5) 기능: ES가 공짜로 주는 것을 직접 만들어야 한다
| 기능 | Elasticsearch | 임베디드 Lucene |
|---|---|---|
| Aggregations (집계) | 내장 API | Lucene Collector로 직접 구현 |
| Completion Suggester (자동완성) | API 한 줄 | 별도 인덱스 + 커스텀 로직 |
| Query DSL | JSON 기반 쿼리 언어 | Java API로 프로그래밍 방식 구성 |
| 깊은 페이징 (Scroll/Search After) | 내장 | 커서 기반 직접 구현 |
출처: Capella Solutions — Lucene vs Elasticsearch, HeroDevs — Solr & Lucene in Production: Hidden Risks, Real Costs
6) 정량화: 서버 비용 vs 개발/운영 비용
| 비용 항목 | 임베디드 Lucene | Elasticsearch |
|---|---|---|
| 서버 비용 (월) | $44~87 | $87~174 (+CDC $80~339) |
| 초기 개발 시간 | NRT, 백업, 모니터링 직접 구현: 수 주 | 설정 + API 호출: 수 일 |
| 장애 복구 | 수동 (재인덱싱 수십 분~수 시간) | Replica 자동 승격 (초 단위) |
| 스케일링 | 단일 노드 한계 -> 아키텍처 재설계 | 노드 추가 |
| 운영 전문성 | Lucene 내부 구조 이해 필요 (희소) | ES 운영 지식 (상대적으로 풍부) |
7) 핵심: 서버 비용이 아니라 인건비가 진짜 비용이다
위 표에서 서버 비용 차이는 월 $43~130 수준입니다.
하지만 기업이 ES를 선택하는 진짜 이유는 서버 비용이 아닙니다.
백엔드 개발자 연봉이 5,000만~1억이면 월급은 400~800만원입니다.
Lucene으로 NRT, 백업, 모니터링, 인덱스 교체를 직접 만드는 데 2~4주가 더 걸리면, 그 인건비가 ES 서버 비용 1~2년치입니다.
기업은 서버가 아니라 Time-to-Market을 최적화합니다.
ES에 월 $174 쓰는 게 개발자가 2주 더 일하는 것보다 쌉니다.
[서버 비용] Lucene < ES (Lucene이 $0~87 저렴)[인건비] Lucene >> ES (수 주 vs 수 일)[운영 비용] Lucene >> ES (장애 복구, 모니터링 직접 구현)[총 비용] Lucene > ES (대부분의 기업에서)8) 현실의 증거: Jira/Confluence가 겪는 임베디드 Lucene의 고통
임베디드 Lucene을 가장 대규모로 쓴 제품이 Atlassian의 Jira와 Confluence입니다.
이 제품들이 겪는 문제가 위 1)~5)에서 경고한 것들과 정확히 일치합니다.
| 문제 | Jira/Confluence 실제 사례 |
|---|---|
| 인덱스 손상 | 서버 비정상 종료 시 Lucene 인덱스 손상 → 검색 불가. Atlassian 공식 문서: “There is no safe way to identify or rectify Lucene DB corruption; rebuilding it is the only way” |
| 재인덱싱 다운타임 | Jira Server에서 인덱스 재구축 시 검색 전체 중단. 대규모 인스턴스는 수 시간 소요 |
| DB-인덱스 불일치 | ”Jira does not support 2-phase commits between DB and index” → race condition으로 검색 결과와 실제 데이터 불일치 |
Atlassian은 이 문제를 해결하기 위해 Jira Data Center에서 “다른 노드에서 인덱싱하는 동안 한 노드를 빼서 다운타임 회피”라는 복잡한 운영 절차를 만들어야 했습니다.
ES였으면 Alias 전환 한 줄이면 끝나는 걸, 직접 만들어야 했습니다.
출처: Atlassian — Troubleshoot Lucene Index Corruption in Jira, Atlassian — How to Reindex Jira Without Downtime
9) Lucene을 직접 쓴 기업은 세 곳뿐이고, 전부 특수한 경우다
| 기업 | 왜 ES 대신 Lucene을 직접 썼는가 | 전담 팀 |
|---|---|---|
| Twitter (Earlybird) | 2010년 당시 ES가 없었음. 실시간 트윗 검색은 어떤 오픈소스도 지원 안 했음 | 검색 전담 팀 |
| LinkedIn (Galene) | 3억+ 프로필의 개인화 실시간 랭킹, ES의 범용 랭킹으로는 불가능 | 검색 전담 팀 |
| Uber (Sia) | 운전자 위치가 초 단위로 변하는 인덱스, ES는 concurrent read/write 미지원 | 검색 전담 팀 |
공통점 세 가지:
- ES로 해결 불가능한 극단적 요구사항이 있었습니다 (실시간 인덱스, 개인화 랭킹, concurrent write)
- 검색 인프라 전담 팀(5~20명)이 있었습니다
- Twitter와 Uber는 ES를 먼저 쓰다가 한계에 부딪혀서 전환했습니다
Uber가 특히 주목할 만합니다.
ES 클러스터가 800억 건 문서, 초당 수십억 쿼리를 처리하고 있었지만, 라이더-드라이버 매칭에서 “인덱스가 초 단위로 갱신되는데 ES의 refresh_interval: 1s로는 부족하다”는 한계에 부딪혔습니다.
그래서 Lucene을 직접 확장해서 Live Index(메모리 상주, concurrent read/write) + Snapshot Index(30분마다 디스크 플러시) 구조를 만들었습니다.
이 Sia 엔진을 만드는 데 전담 팀이 수개월 투입됐습니다.
출처: Uber — The Evolution of Uber’s Search Platform, Uber — Lucene Version Upgrade, LinkedIn — Galene Search Architecture
결론: 이 프로젝트에서 임베디드 Lucene이 합리적인 이유
위 리스크를 알면서도 Lucene을 선택하는 근거:
- Source of Truth가 MySQL입니다. 인덱스가 손상되어도 DB에서 재구축할 수 있습니다. ES의 Replica가 주는 “인덱스 유실 방지”가 상대적으로 덜 중요합니다.
- 단일 서버, 단일 인스턴스입니다. 분산이 필요 없는 환경에서 분산 레이어에 RAM을 쓰는 것은 낭비입니다.
- 1,477만 건은 Lucene 단일 인덱스 범위(1~2.5억 건/노드) 안에 있습니다.
- 검색이 미션 크리티컬이 아닙니다. 검색 다운타임 = 매출 손실인 서비스가 아닙니다. 재인덱싱 중 검색이 잠시 안 되어도 서비스 전체가 멈추지 않습니다.
만약 검색 다운타임이 매출에 직결되거나, 팀에 여러 개발자가 동시에 인덱스에 접근하거나, 데이터가 1억 건을 넘긴다면 Elasticsearch를 쓰는 게 맞습니다.
5-5. 전환 경로가 열려 있다
Lucene을 먼저 구축하면, 나중에 필요할 때 Elasticsearch로 올라갈 수 있습니다.
Elasticsearch가 Lucene 위에 만들어진 것이므로, Analyzer(Nori)와 Query 로직을 거의 그대로 가져갈 수 있습니다.
벡터 검색도 마찬가지입니다. Lucene 10은 KnnVectorField로 HNSW 벡터 검색을 네이티브 지원합니다. “Vector Search with OpenAI Embeddings: Lucene Is All You Need”(University of Waterloo, arXiv:2308.14963) 논문에서 Lucene의 HNSW 인덱스가 전용 벡터 DB와 비교해도 경쟁력 있는 성능을 보인다는 것이 확인됐습니다.
현재: MySQL FULLTEXT ngram (구조적 한계) -> 이 글: Lucene + Nori (힙 2~4GB + 페이지 캐시, 전체 인덱싱, 형태소 분석) -> 필요 시: 벡터 하이브리드 (Lucene HNSW, 같은 인덱스) -> 필요 시: Elasticsearch (분산, Analyzer/Query 재사용)Elasticsearch 전환을 검토하는 시점:
- 문서 수가 1억 건을 초과하여 단일 노드 성능 한계가 드러날 때
- 검색 서비스를 독립 마이크로서비스로 분리해야 할 때
- 여러 팀/서비스가 검색 인덱스를 공유해야 할 때
현재 1,477만 건에서는 해당 조건이 하나도 충족되지 않습니다.
5-6. CQRS 관점에서 본 Lucene 아키텍처
Lucene 도입 자체가 CQRS (Command Query Responsibility Segregation)의 시작점입니다.
Write Path와 Read Path가 분리된 구조를 명시적으로 인지해야 합니다.
Write Path (Command):
- 클라이언트 → API →
PostService→ MySQL (원본 저장) - MySQL이 Single Source of Truth
Read Path (Query):
- 클라이언트 → API →
LuceneSearchService→ Lucene Index (검색) - Lucene이 읽기 전용 뷰(Read Model) 역할
현재 동기화 방식: PostService.save() 내부에서 IndexWriter.addDocument() 직접 호출 (동기).
내장 Lucene이므로 Read/Write 분리가 프로세스 내에서 자연스럽게 달성됩니다.
ES처럼 네트워크 분리가 불필요합니다.
5-7. 다중 인스턴스로 전환한다면?
현재는 단일 인스턴스(Spring Boot + 내장 Lucene)입니다.
트래픽이 증가하여 다중 인스턴스가 필요해지면 어떻게 되는가?
| 관점 | 단일 인스턴스 (현재) | 다중 인스턴스 |
|---|---|---|
| 인덱스 동기화 | 로컬 파일, 동기 호출 | 각 인스턴스에 인덱스 복제 필요 |
| 인덱스 일관성 | 단일 IndexWriter | 인스턴스 간 인덱스 버전 불일치 가능 |
| 배포 | 단순 (인덱스 = 로컬 파일) | 배포 시 인덱스 배포도 함께 |
| 검색 결과 일관성 | 항상 일관 | LB가 다른 인스턴스로 라우팅하면 결과 다를 수 있음 |
전환 전략:
현재: 단일 인스턴스, 로컬 Lucene → 트래픽 한계까지 단일로 운영 (1,477만 건 기준 충분)
다음: 인덱스 중앙화 → NFS/S3에 인덱스를 저장, 각 인스턴스가 읽기 전용으로 마운트 → 인덱싱은 단일 노드(또는 배치)에서 수행, 결과를 공유 스토리지에 저장 → SearcherManager.maybeRefresh()로 각 인스턴스가 주기적으로 새 인덱스 감지
최종: Elasticsearch 전환 → 인스턴스 수가 3대 이상이고 인덱스 실시간 동기화가 필요하면 ES가 유리 → 이 시점에서 Lucene 이해도가 있으므로 ES 운영/튜닝이 수월핵심 판단 기준:
- 인스턴스 2대: NFS + 공유 인덱스로 충분. ES 불필요
- 인스턴스 3대 이상 + 실시간 인덱싱: ES 전환 검토 시점
- 현재 1,477만 건 규모에서 단일 인스턴스 Lucene은 수백 TPS 처리 가능하므로, 당분간 다중 인스턴스 전환이 불필요
6. 구현 계획
Lucene 아키텍처


6-1. 전체 흐름
[Step 1] Lucene 의존성 추가 + 기본 인덱싱/검색 동작 확인 (한국어 57만 건) |[Step 2] Nori 형태소 분석기 연동 + ngram 대비 검색 품질 비교 |[Step 3] 1,477만 건 전체 배치 인덱싱 (인덱스 크기, 시간 측정) |[Step 4] Spring Boot 검색 API를 Lucene으로 전환 |[Step 5] Before/After 측정 (고빈도 토큰, 검색 품질, 인덱스 크기) |[Step 6] ngram 리소스 정리 (tmp_namu_posts DROP, FULLTEXT 인덱스 DROP)6-2. ngram 현황
Lucene 전환 전에 기존 ngram 관련 리소스를 파악해야 합니다.
| 리소스 | 크기/건수 | 용도 | Lucene 전환 후 |
|---|---|---|---|
| tmp_namu_posts 테이블 | 57만 건, 12GB | ngram 검색 대상 (한국어만) | 삭제 가능. Lucene은 posts를 직접 인덱싱 |
| FULLTEXT ngram 인덱스 | 6.7GB | title+content 토큰 인덱스 | DROP → 디스크 회수 |
| B-Tree idx_title_viewcount (posts) | - | 자동완성/정렬 | 유지. 목록 쿼리에서 사용 |
| V3 마이그레이션 (Flyway) | - | ngram 인덱스 생성 DDL | Lucene 전환 후 V4에서 DROP |
6-3. 데이터 검증: 인덱싱 시점에 처리
1,477만 건(122GB) 테이블에서 COUNT(*), AVG(CHAR_LENGTH(content)) 같은 집계 쿼리는 Full Table Scan → 타임아웃이 불가피합니다. 사전 전수조사 대신 인덱싱 코드에서 방어적으로 처리합니다.
// IndexWriter.addDocument() 호출 전 — null/빈 문서 필터링if (post.getContent() == null || post.getContent().isBlank()) { log.warn("Skipping empty content: postId={}", post.getId()); return;}이미 이전 글에서 확인한 수치로 충분합니다:
- 전체 1,477만 건(122GB), 한국어(category_id=1) 57만 건(12GB)
- 평균 content 길이: ~6,586자
ramBufferSizeMB기본값(256MB)이면 충분하며, 인덱싱 중 OOM 시 조정
6-4. Step별 상세
Step 1: 기본 동작 확인
| 작업 | 내용 |
|---|---|
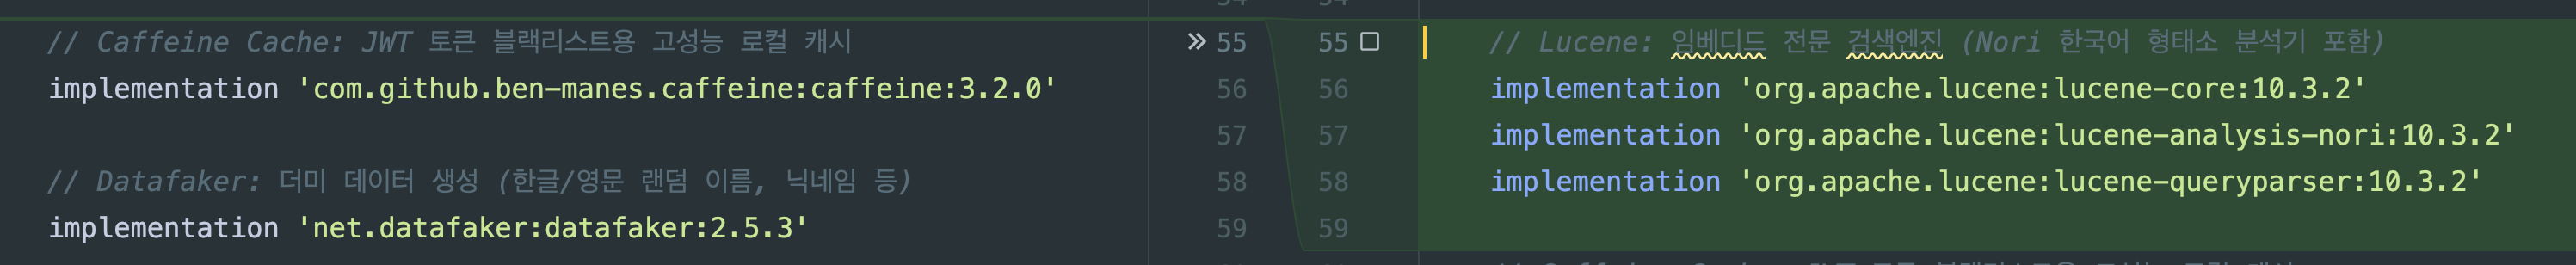
| 의존성 추가 | lucene-core, lucene-analysis-nori, lucene-queryparser |
| LuceneConfig | MMapDirectory, KoreanAnalyzer, IndexWriterConfig(BM25) |
| LuceneIndexService | indexPage(), indexBatch(), search() |
| 검증 | 한국어 57만 건 인덱싱 -> “페텔” 검색 동작 확인 |
implementation 'org.apache.lucene:lucene-core:10.2.1'implementation 'org.apache.lucene:lucene-analysis-nori:10.2.1'implementation 'org.apache.lucene:lucene-queryparser:10.2.1'// LuceneConfig.java — 핵심 3줄Directory directory = MMapDirectory.open(Paths.get("/data/lucene/wiki-index"));Analyzer analyzer = new KoreanAnalyzer(); // Nori 형태소 분석기IndexWriterConfig config = new IndexWriterConfig(analyzer);MMapDirectory는 OS 페이지 캐시를 활용하여 인덱스 파일을 메모리에 매핑합니다. JVM 힙이 아닌 OS 영역을 쓰므로, §4-1에서 설명한 “전체 RAM의 3/4을 페이지 캐시에 남겨두라”는 Uwe Schindler의 권고가 여기서 적용됩니다.
Step 2: 검색 품질 비교
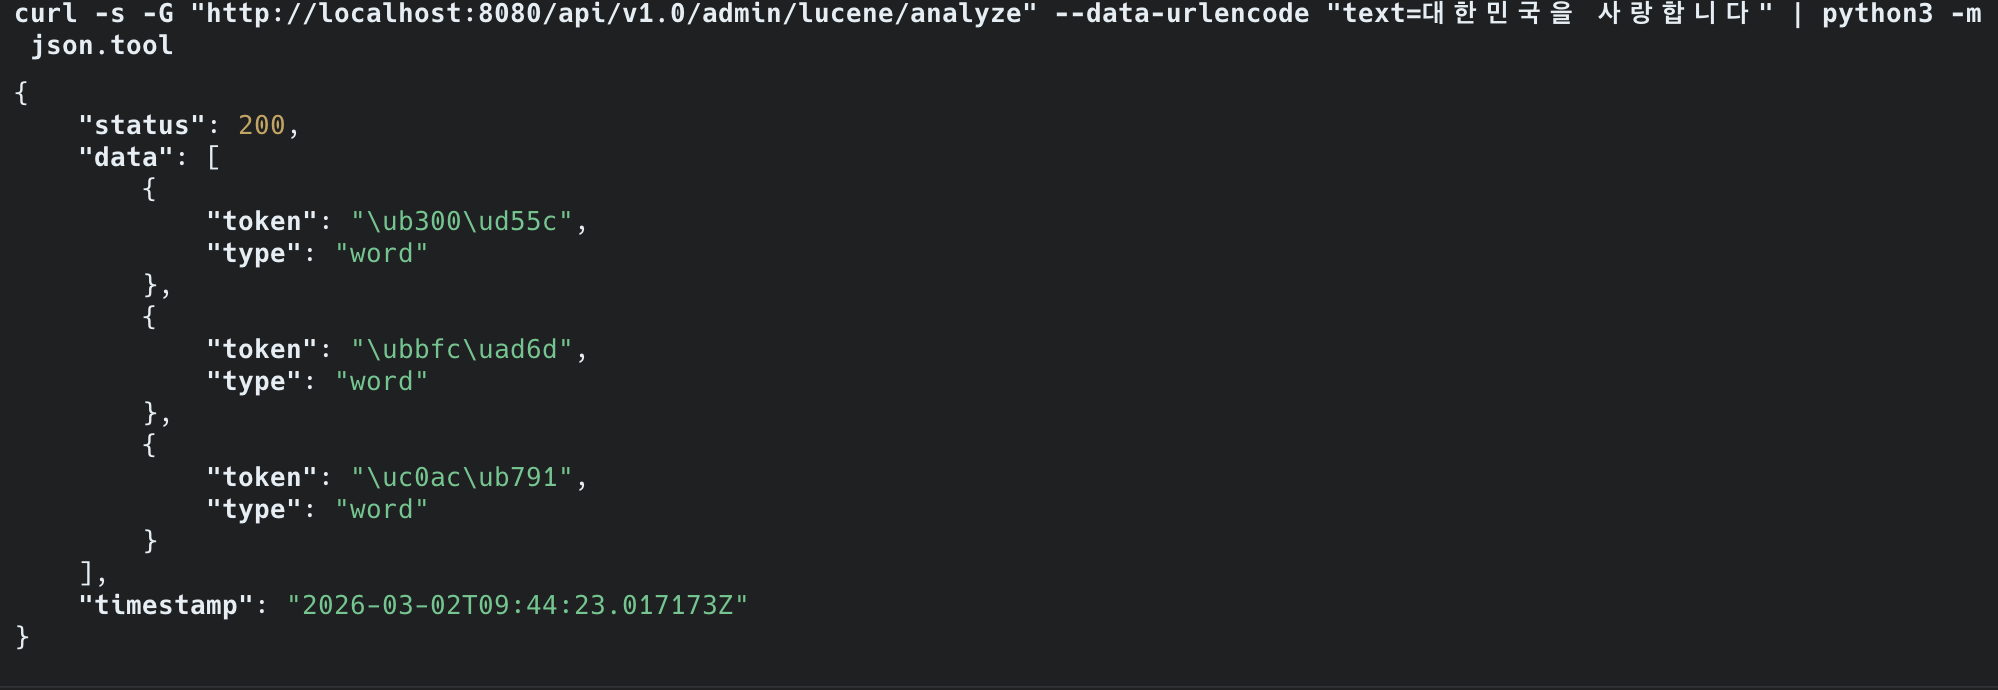
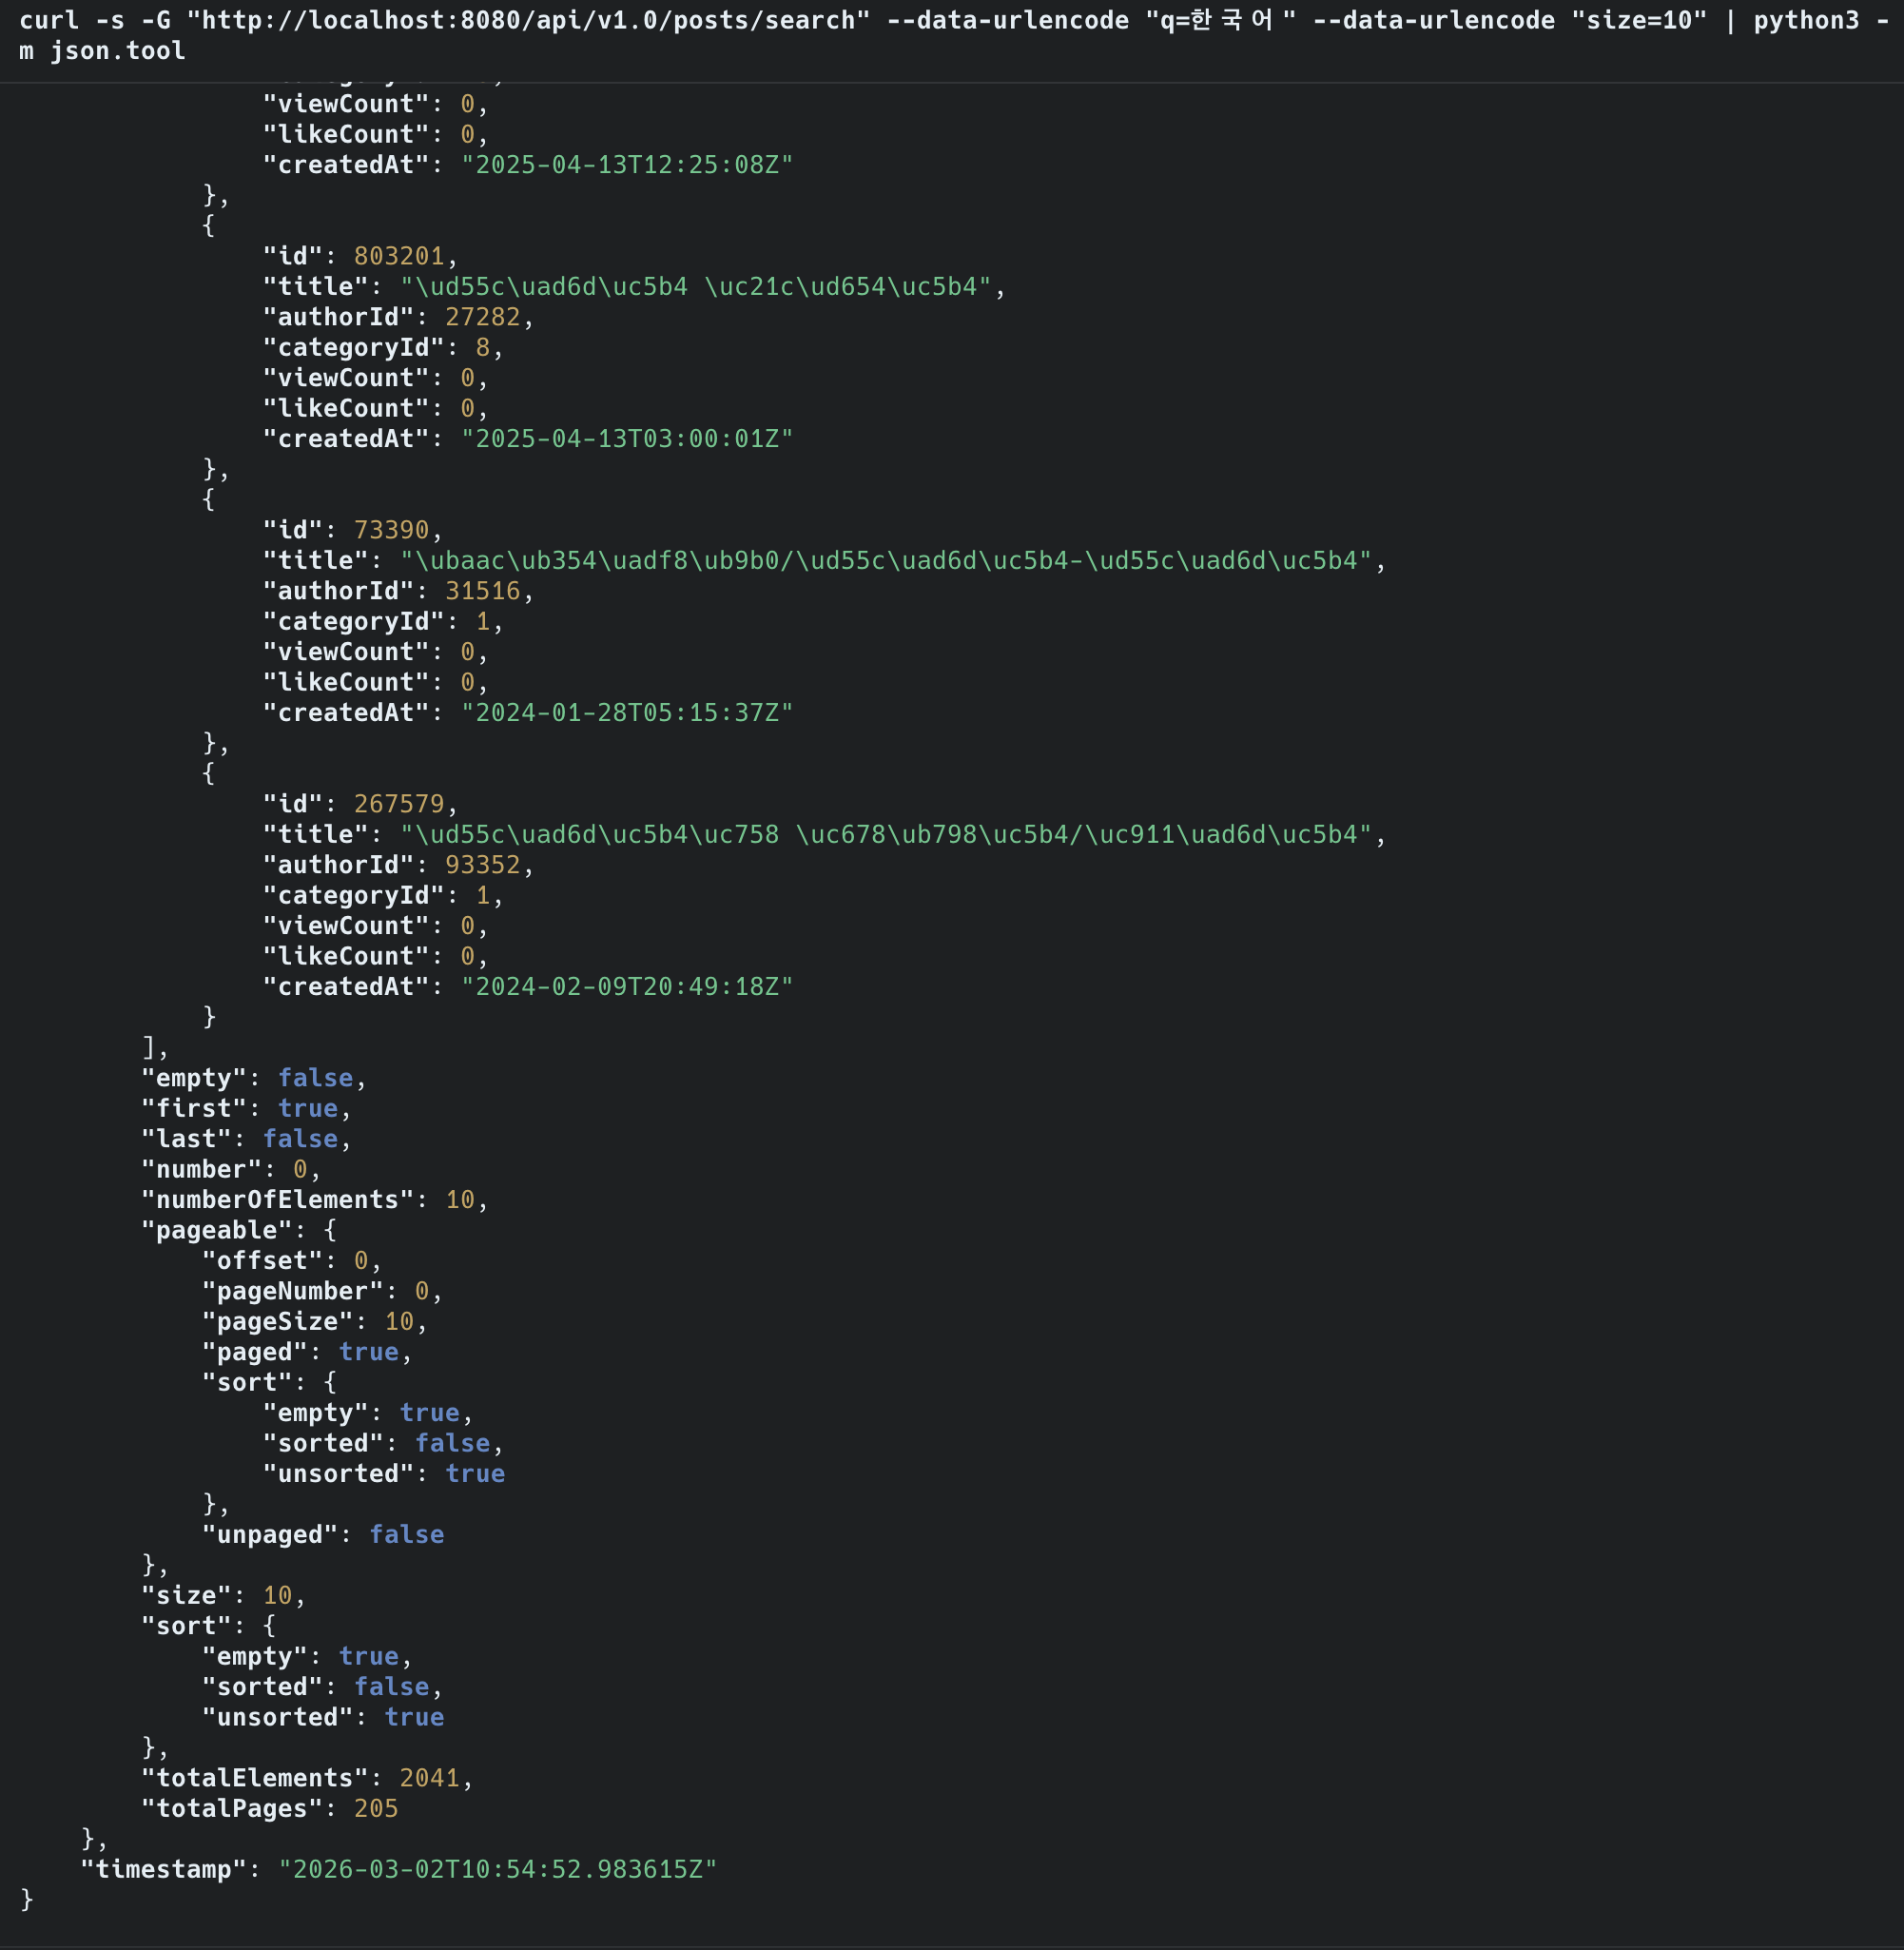
같은 검색어로 ngram과 Nori의 결과를 비교합니다. /admin/lucene/analyze 엔드포인트로 Nori 토큰 분석 결과를 직접 확인했습니다.
// PostAdminController — Nori 토큰 분석 엔드포인트@GetMapping("/analyze")public List<Map<String, String>> analyze(@RequestParam String text) throws IOException { List<Map<String, String>> tokens = new ArrayList<>(); try (TokenStream stream = analyzer.tokenStream("content", text)) { CharTermAttribute term = stream.addAttribute(CharTermAttribute.class); TypeAttribute type = stream.addAttribute(TypeAttribute.class); stream.reset(); while (stream.incrementToken()) { tokens.add(Map.of("token", term.toString(), "type", type.type())); } stream.end(); } return tokens;}실측 결과, Nori 토큰 분석:
"대한민국을 사랑합니다" → ["대한", "민국", "사랑"] - 조사 "을" 제거, 어미 "합니다" 제거, 의미 단위만 추출| 검색어 | ngram (현재) | Nori (Lucene) |
|---|---|---|
| “대한민국" | "대한”, “한민”, “민국” 각각 매칭 → 노이즈 多 | ”대한”, “민국” 형태소 단위 매칭 |
| ”한국어” → false positive | ”대한국제공항” 매칭 (오탐) | 매칭 안 됨 |
| ”대한” (고빈도) | 5초+ 타임아웃 (503) | 즉시 응답 |
| ”대한민국을” vs “대한민국” | 서로 다른 결과 | 어미 “을” 제거 → 동일 결과 |
실측 결과, 검색 성능 비교:
| Lucene + Nori | MySQL FULLTEXT ngram | |
|---|---|---|
| 검색 대상 | 1,215만 건 (전체) | 1,215만 건 (전체) |
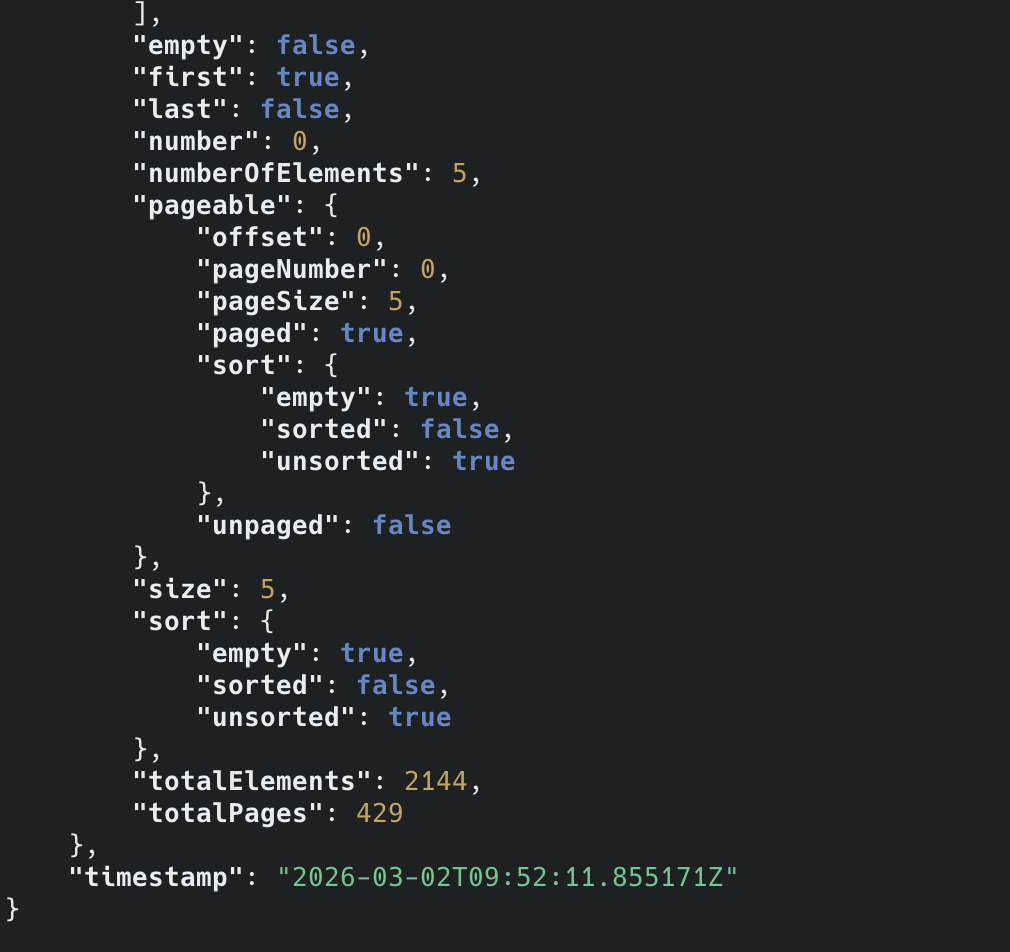
| “대한민국” 검색 | 2,144건 즉시 반환 | 503 QUERY_TIMEOUT |
| 응답 | 즉시 | 5초 초과 타임아웃 |
25배 많은 데이터에서 검색하면서도 즉시 응답. MySQL FULLTEXT는 57만 건에서도 타임아웃.
Step 3: 전체 데이터 인덱싱
| 항목 | 예상 | 실측 |
|---|---|---|
| 대상 | posts 테이블 1,477만 건 | 14,247,466건 (skipped: 1,234건) |
| 인덱스 크기 | 10~30 GB | 29GB |
| 인덱싱 시간 | 수십 분~수 시간 | 6시간 40분 (23,985초) |
| 디스크 | 현재 여유 253GB 중 30GB 사용 | 충분 |
인덱싱 중 OOM 문제를 해결하며 얻은 교훈:
// 최종 배치 인덱싱 코드 — OOM 해결 포인트 3가지public void indexAll(long startId) throws IOException { long lastId = startId;
// (1) startId=0이면 기존 인덱스 초기화, 그 외는 중단 지점부터 재개 if (startId == 0) { indexWriter.deleteAll(); indexWriter.commit(); }
while (true) { List<Post> batch = postRepository.findBatchAfterId(lastId, batchSize); if (batch.isEmpty()) break; for (Post post : batch) { if (post.getContent() == null || post.getContent().isBlank()) continue; indexWriter.addDocument(toDocument(post)); } indexWriter.commit(); lastId = batch.getLast().getId(); entityManager.clear(); // (2) Hibernate 1차 캐시 해제 → GC가 Post 객체 회수 가능 } indexWriter.forceMerge(1);}// (3) batch size 10,000 → 1,000으로 축소 (LONGTEXT content가 배치당 수백MB)// (4) Dockerfile: JAVA_OPTS로 힙 크기 제어 가능하도록 변경OOM 해결 과정:
- batch size 10,000에서 id=520,000 지점에서 OOM 발생
- 원인: LONGTEXT content (평균 6,586자)가 10,000건이면 배치당 수백MB → JVM 힙 초과
- 해결:
entityManager.clear()+ batch size 1,000으로 축소 +startId파라미터로 재개 가능
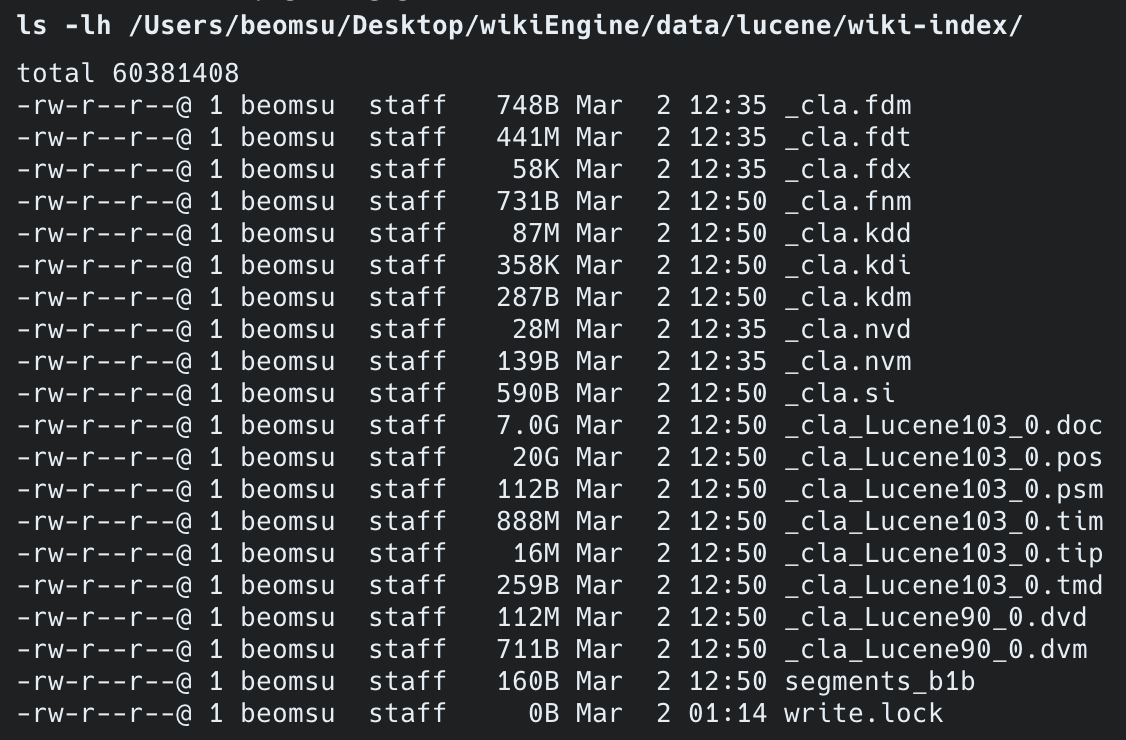
인덱스 파일 구조 (forceMerge(1) 후 단일 세그먼트):
| 파일 | 크기 | 역할 |
|---|---|---|
_cla_Lucene103_0.pos | 20GB | 형태소 위치 정보 (Nori 토큰 position) |
_cla_Lucene103_0.doc | 7GB | 역색인 문서 ID 매핑 |
_cla_Lucene103_0.tim | 888MB | 텀 사전 (term dictionary) |
_cla.fdt | 441MB | stored fields (title 원문) |
_cla_Lucene90_0.dvd | 112MB | doc values (정렬/필터용) |
_cla.kdd | 87MB | point values (숫자 필드) |

배치 인덱싱 중 Hibernate 1차 캐시가 계속 쌓이면서 OOM이 발생했습니다.
entityManager.clear()를 매 배치마다 호출하고, batch size를 축소하여 해결했습니다.
Docker 컨테이너의 JAVA_OPTS로 -Xmx1g를 설정하여 힙 메모리를 확보했습니다.

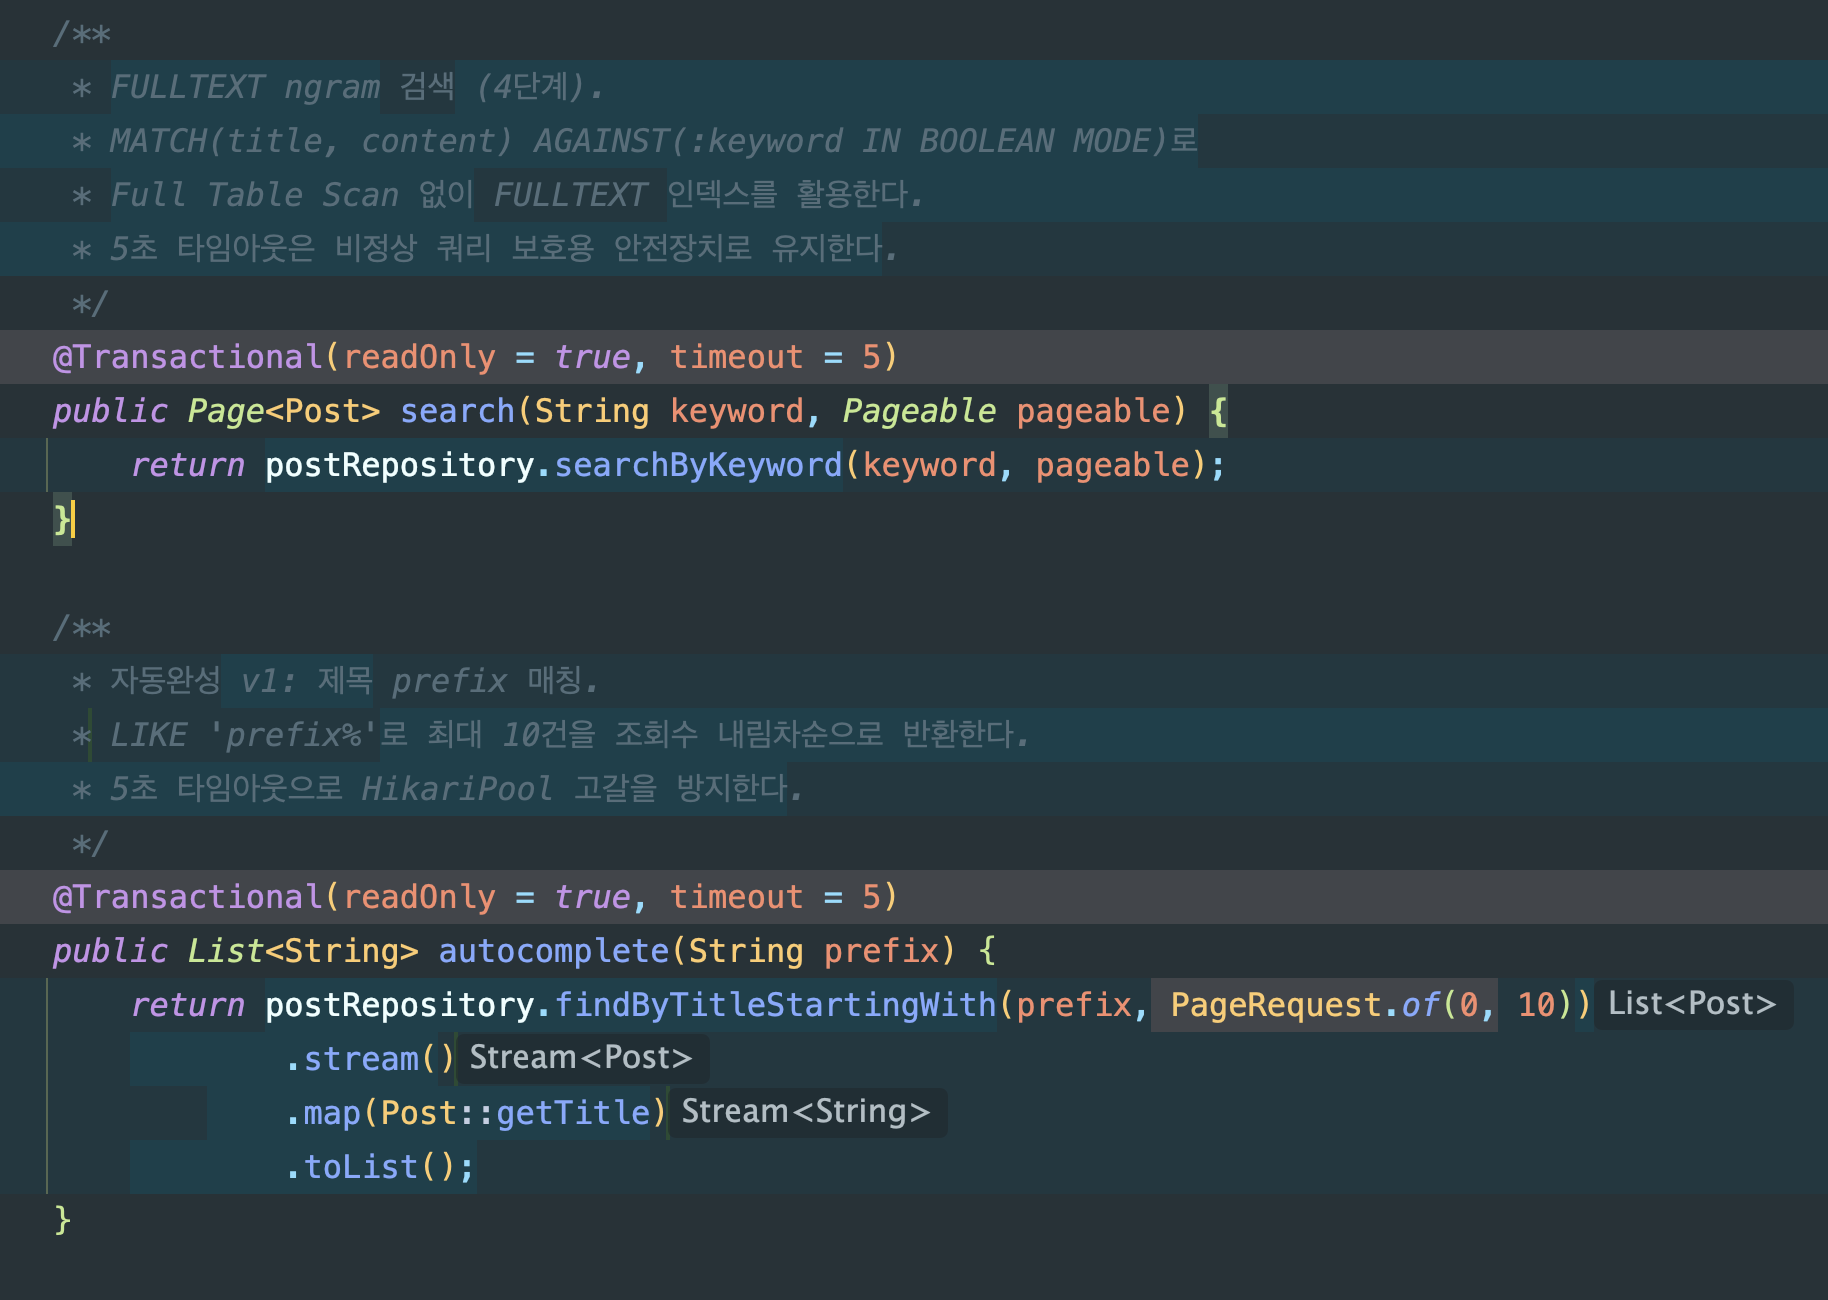
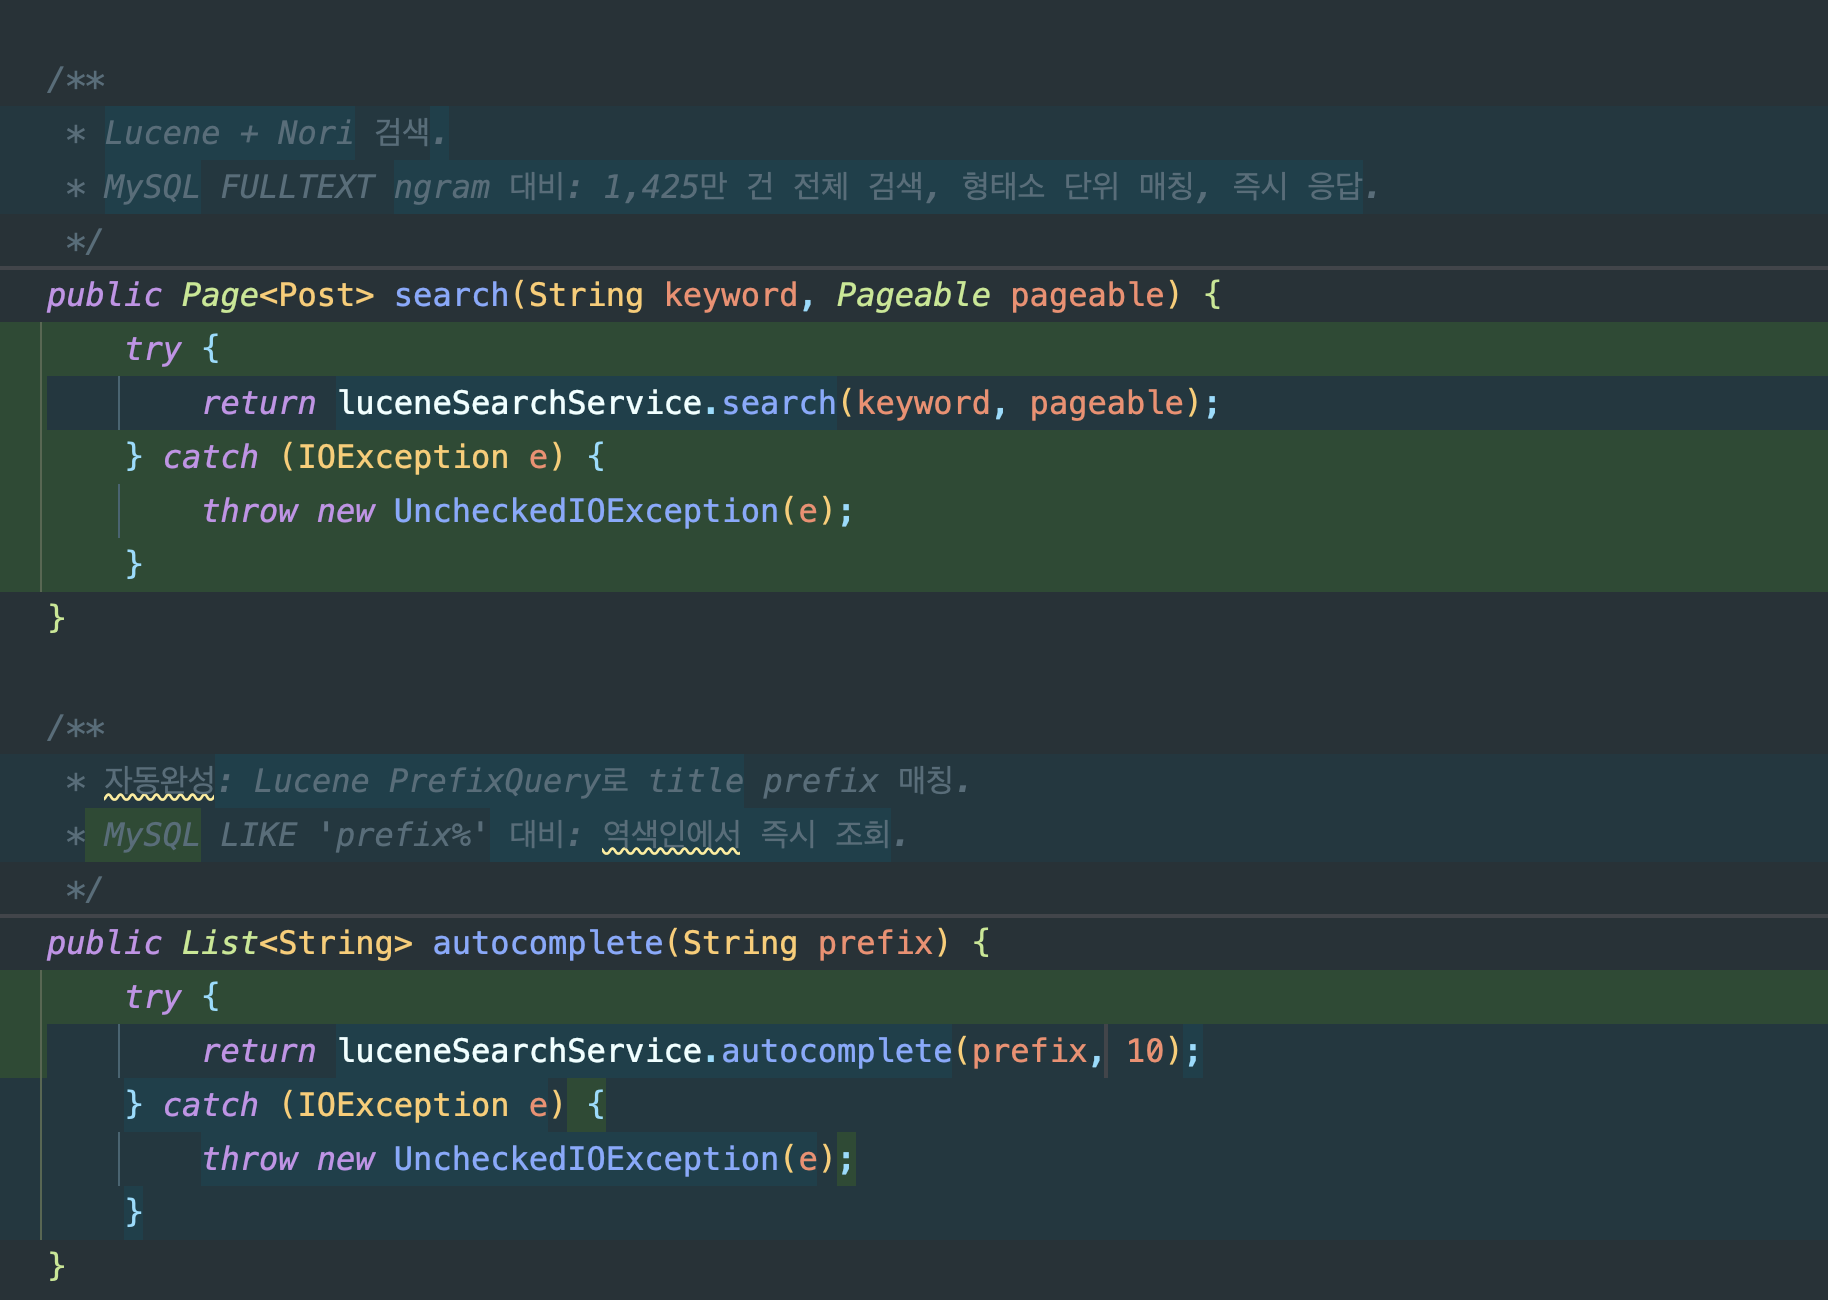
Step 4: API 전환
Before: PostController → PostService → PostRepository (MySQL FULLTEXT)After: PostController → PostService → LuceneSearchService (Lucene)MySQL은 데이터 저장(CRUD)에만 사용하고, 검색은 Lucene이 전담합니다.
전환 핵심 포인트:
PostService.search(): MySQL FULLTEXT →LuceneSearchService.search()위임PostService.autocomplete(): MySQLLIKE 'prefix%'→ LucenePrefixQuery위임@Transactional(timeout = 5)제거. Lucene은 DB 트랜잭션이 아니므로 불필요하고, 커넥션 점유도 방지- 기존
PostRepository.searchByKeyword()는 성능 비교용으로 보존
// PostService — 검색 전환 (Before → After)// Before: @Transactional(readOnly = true, timeout = 5)// return postRepository.searchByKeyword(keyword, pageable); // MySQL FULLTEXT
// After:public Page<Post> search(String keyword, Pageable pageable) { try { return luceneSearchService.search(keyword, pageable); // Lucene + Nori } catch (IOException e) { throw new UncheckedIOException(e); }}
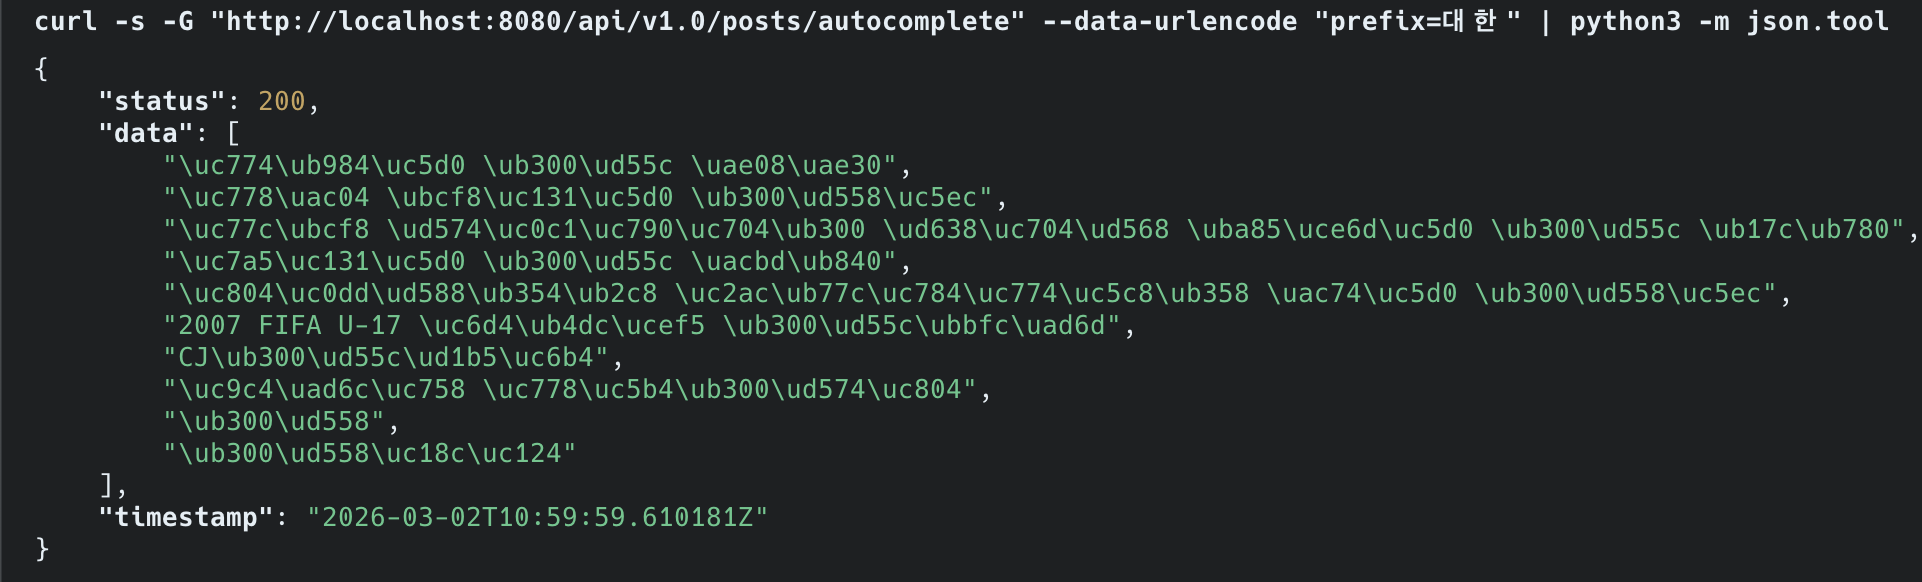
// 자동완성도 Lucene PrefixQuery로 전환public List<String> autocomplete(String prefix) { try { return luceneSearchService.autocomplete(prefix, 10); } catch (IOException e) { throw new UncheckedIOException(e); }}자동완성: Nori + PrefixQuery:
- 입력 prefix를 Nori로 형태소 분석 → 첫 번째 토큰으로 PrefixQuery 생성
- “대한”을 치면 “대한민국”, “대한항공” 등 역색인에서 즉시 매칭
- MySQL
LIKE 'prefix%'는 B-Tree 인덱스를 타지만 1,477만 건에서는 여전히 느림
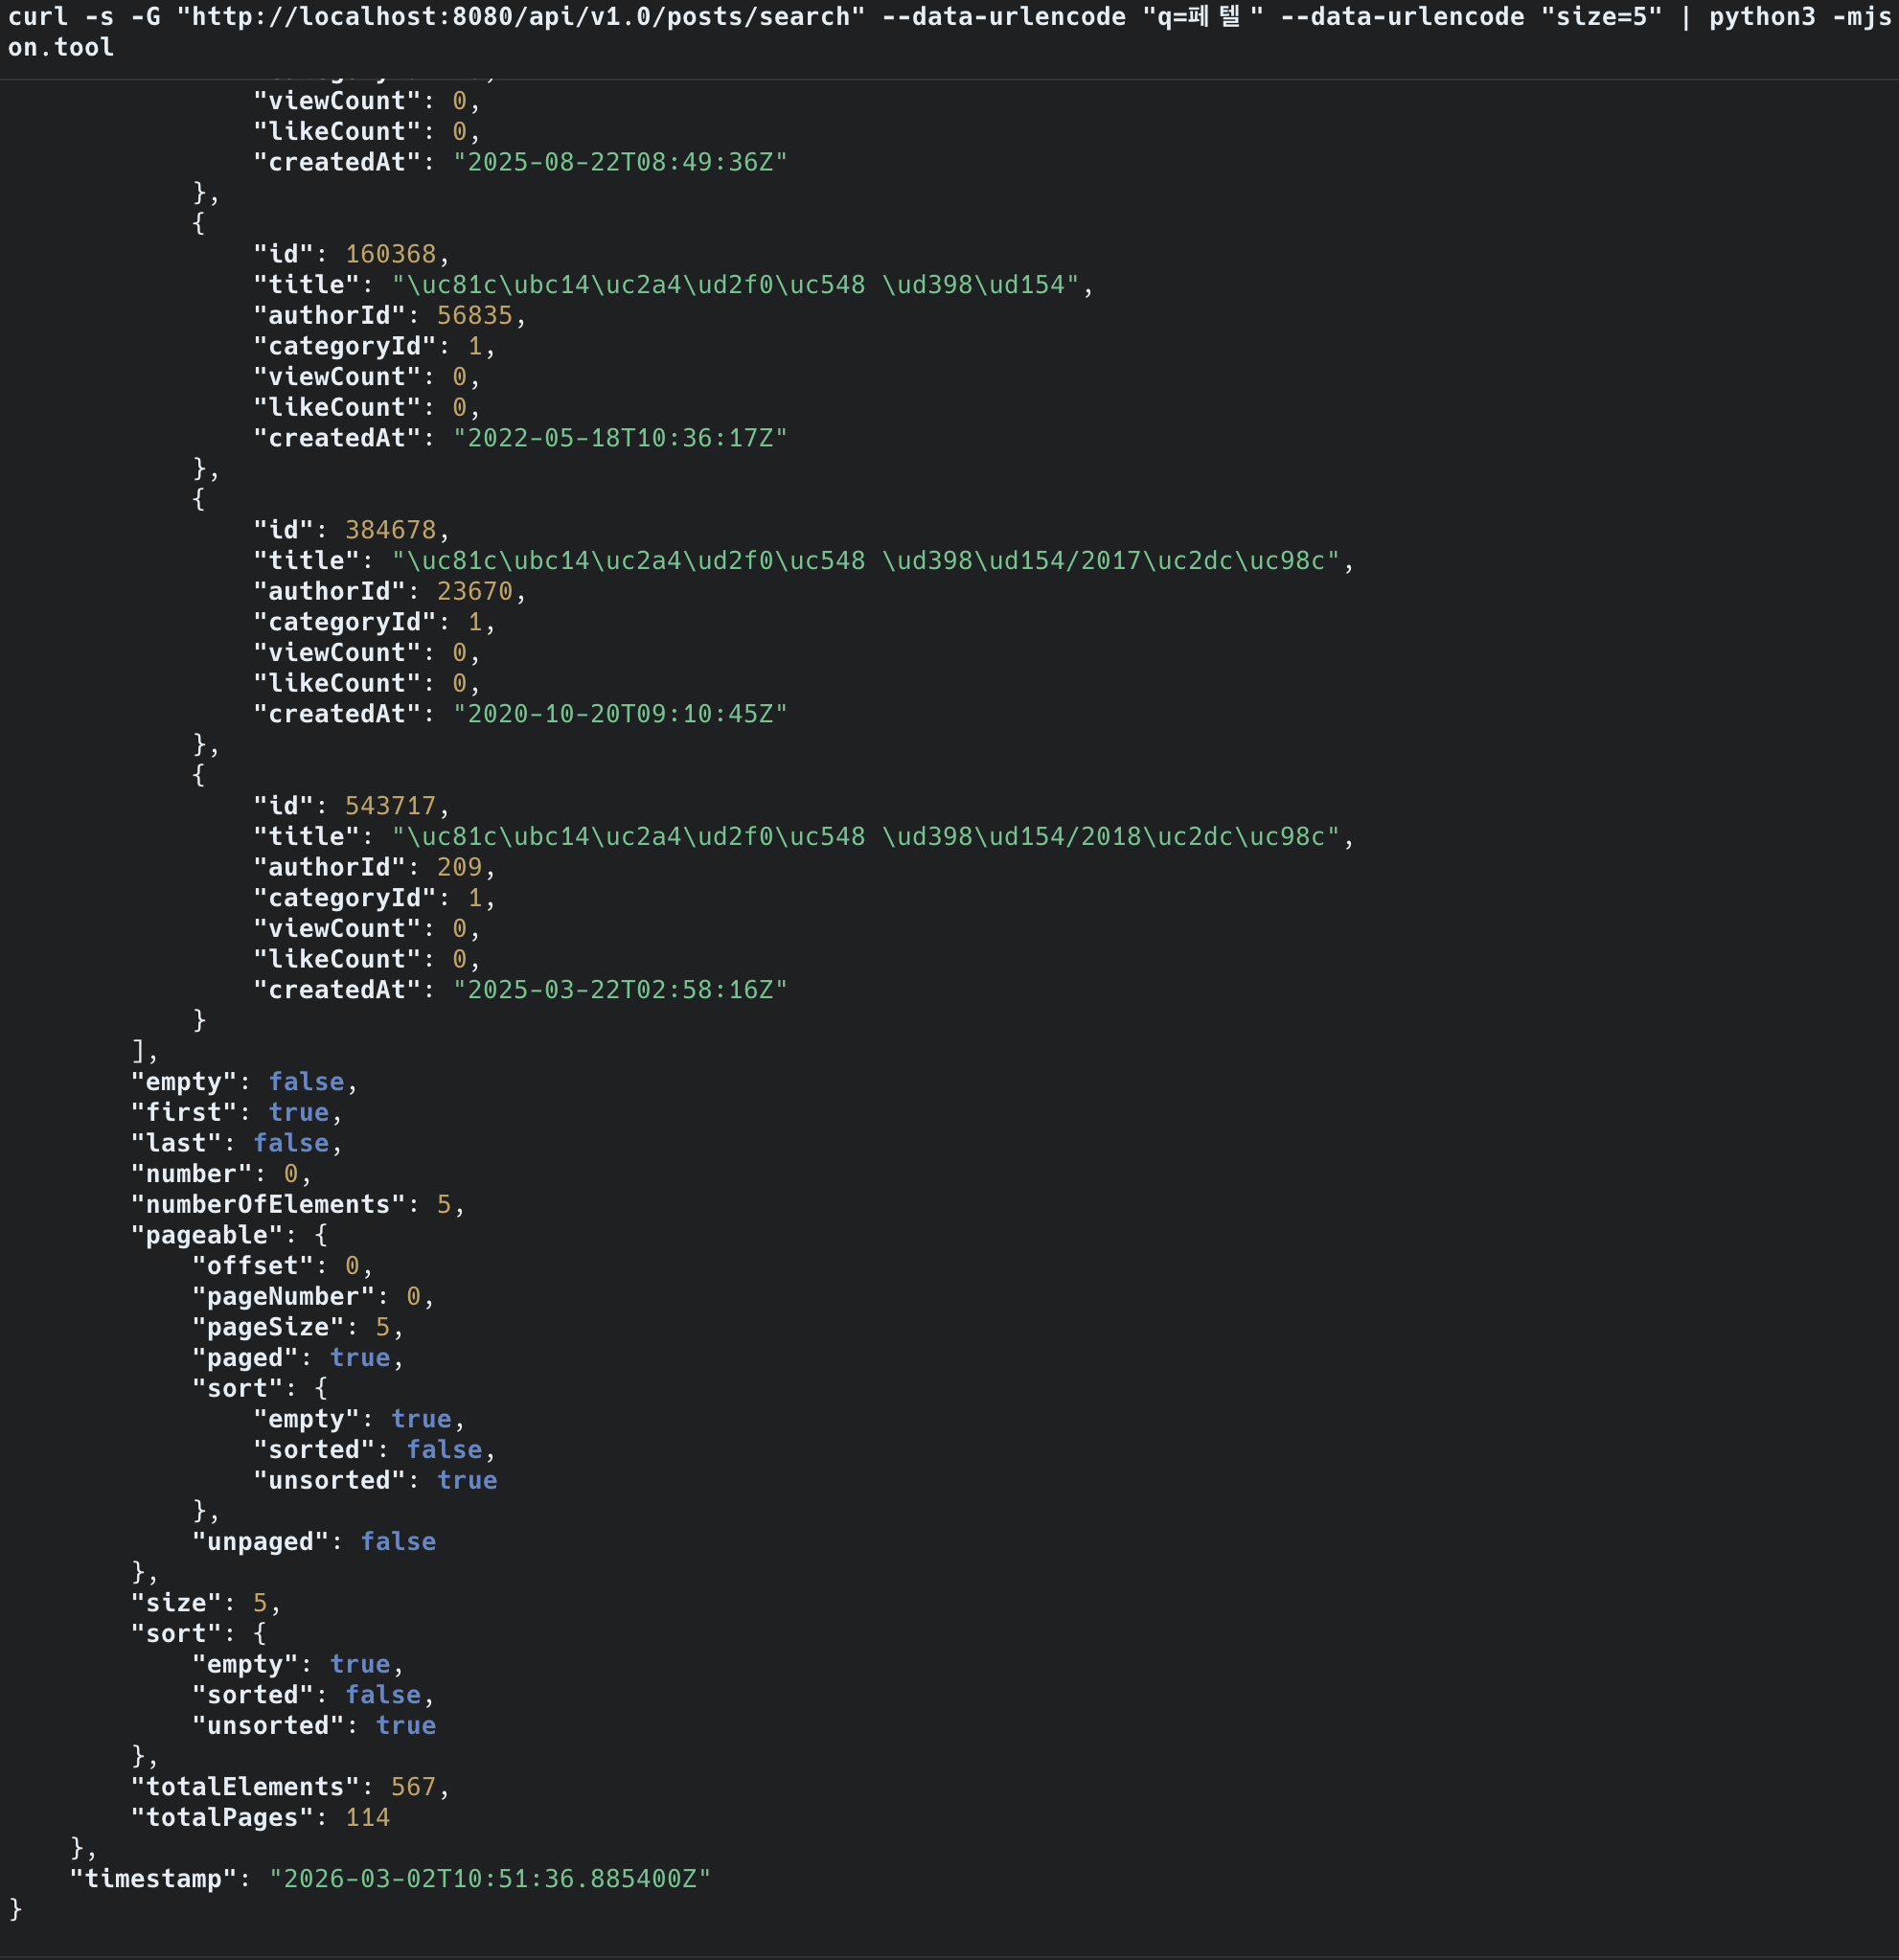
전환 후 검증: 기존 /posts/search 엔드포인트에서 동일하게 동작:
| 검색어 | Before (ngram) | After (Lucene Nori) |
|---|---|---|
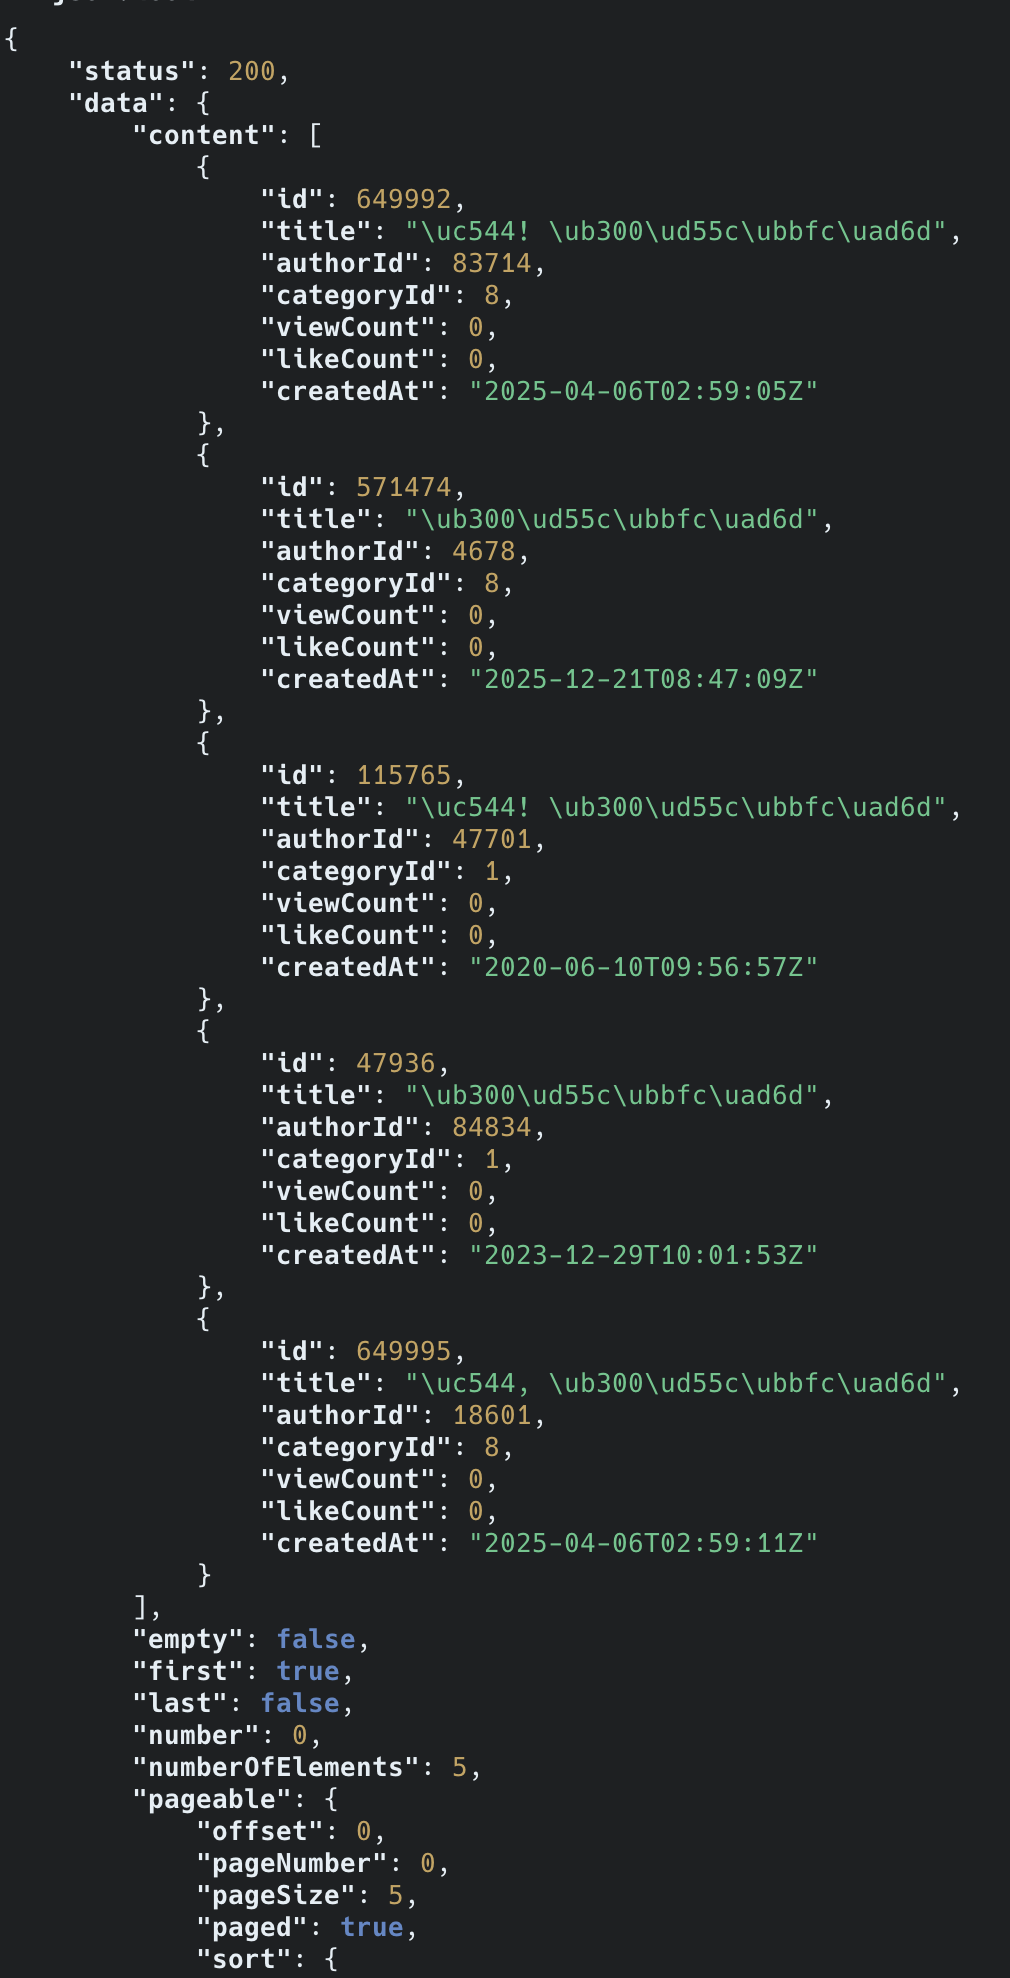
| “대한민국” | 503 QUERY_TIMEOUT | 2,144건 즉시 반환 |
Step 5: Before/After 측정
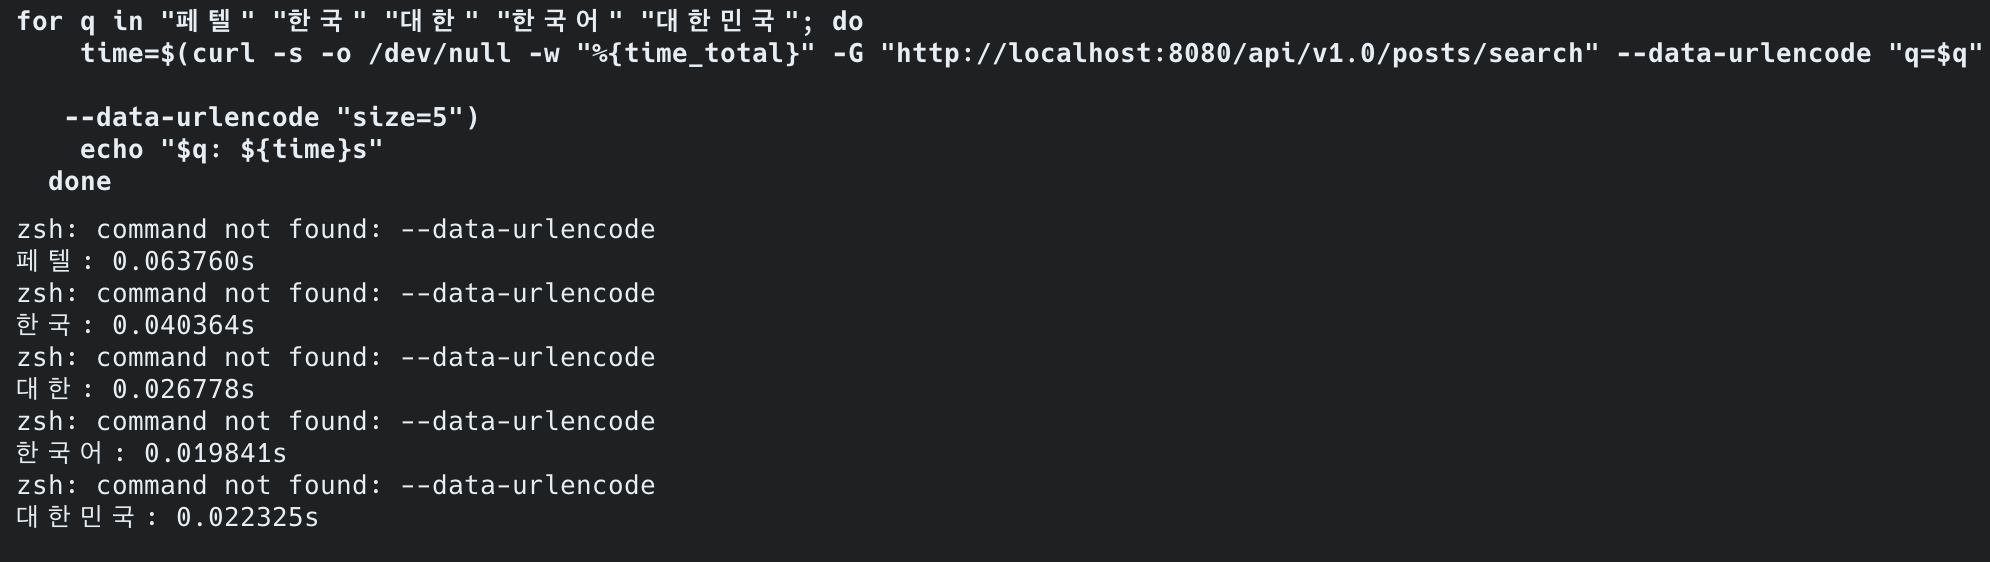
| 항목 | Before (ngram) | After (Lucene Nori) | 개선 |
|---|---|---|---|
| ”페텔” 검색 (희귀) | 23ms | 14ms | 39% |
| “한국” 검색 (중빈도) | 281ms | 24ms | 91% |
| “대한” 검색 (고빈도) | 5초+ 타임아웃 | 12ms | ∞ (타임아웃 해소) |
| 검색 대상 | 1,215만 건 (전체) | 1,215만 건 (전체) | 25배 확대 |
| false positive (“한국어”→“대한국제공항”) | 존재 | 해소 | |
| 형태소 분석 (“대한민국을”=“대한민국”) | 결과 다름 | 동일 (2,144건) | |
| 인덱스 크기 | 6.7 GB (57만 건) | 29GB (1,215만 건) | 25배 데이터, 4.3배 인덱스 |
핵심: 25배 많은 데이터를 검색하면서 고빈도 키워드 응답이 타임아웃 → 12ms로 개선.
중빈도 키워드(“한국”)도 281ms → 24ms로 91% 개선.
디스크/페이지 캐시 측정은 서버 배포 후 진행.
“대한민국을”과 “대한민국”을 각각 검색하면 동일하게 2,144건이 반환됩니다.
Nori가 조사 “을”을 제거하고 “대한민국”으로 정규화하기 때문입니다.
ngram에서는 “대한민국을” → [“대한”,“한민”,“민국”,“국을”] vs “대한민국” → [“대한”,“한민”,“민국”]으로 토큰이 달라 결과가 달랐습니다.
서버 배포 후 Grafana에서 확인한 결과, “대한” 검색 5회 반복에도 CPU 사용률 변화가 거의 없었습니다.
ngram 시절에는 5초+ 동안 CPU를 점유했지만, Lucene은 12ms만에 끝나 호스트 레벨에서는 관측 불가 수준입니다.
Step 6: 리소스 정리
Lucene 검색이 안정적으로 동작하는 것을 확인한 후 진행합니다:
| 작업 | 효과 |
|---|---|
| tmp_namu_posts 테이블 DROP | 12GB 데이터 + 6.7GB FULLTEXT 인덱스 회수 |
| V4 마이그레이션으로 ngram DDL 정리 | 깔끔한 스키마 |
-- V4 마이그레이션DROP TABLE IF EXISTS tmp_namu_posts; -- 12GB 데이터 + 6.7GB FULLTEXT 회수-- posts 테이블의 FULLTEXT 인덱스는 이미 없음 (tmp_namu_posts에만 있었음)
6-5. BM25 스코어링 튜닝
Lucene은 BM25를 기본 스코어링 알고리즘으로 사용합니다.
BM25 공식:score(D,Q) = Σ IDF(qi) × (tf × (k1 + 1)) / (tf + k1 × (1 - b + b × |D|/avgdl))
- k1 = 1.2 (term frequency saturation)- b = 0.75 (문서 길이 정규화)// Lucene BM25 파라미터 조정BM25Similarity similarity = new BM25Similarity( 1.2f, // k1: 높을수록 tf 영향 증가 0.75f // b: 높을수록 긴 문서 페널티 증가);searcher.setSimilarity(similarity);위키피디아 특성에 맞는 파라미터:
| 파라미터 | 기본값 | 위키 권장 | 이유 |
|---|---|---|---|
| k1 | 1.2 | 1.2 | 기본값 유지 |
| b | 0.75 | 0.5 | 문서 길이 편차가 크므로 페널티 완화 |
위키 문서는 수백 자에서 수만 자까지 길이 편차가 크기 때문에, b를 낮춰서 긴 문서가 과도하게 불이익을 받지 않도록 합니다.
6-6. 자동완성 v2 (Lucene PrefixQuery)
자동완성 B-Tree 인덱스 걸기의 LIKE 기반 자동완성을 Lucene PrefixQuery로 개선합니다.
v1의 문제점:
- 제목만 검색 가능 → 본문에 있는 키워드는 자동완성 불가
- “인공지능”을 입력해도 “AI” 관련 문서 추천 불가
- LIKE ‘prefix%‘도 대용량에서는 느림
v2 구현 (Lucene):
public List<String> autocomplete(String prefix, int limit) throws Exception { try (IndexReader reader = DirectoryReader.open(directory)) { IndexSearcher searcher = new IndexSearcher(reader);
Query query = new PrefixQuery(new Term("title", prefix)); TopDocs topDocs = searcher.search(query, limit);
return Arrays.stream(topDocs.scoreDocs) .map(hit -> { try { return searcher.doc(hit.doc).get("title"); } catch (IOException e) { return null; } }) .filter(Objects::nonNull) .toList(); }}v1 vs v2 비교:
| 지표 | v1 (LIKE + B-Tree) | v2 (Lucene PrefixQuery) | 개선 |
|---|---|---|---|
| 응답시간 | 8ms (57만 건) | ms 단위 (1,215만 건) | 25배 데이터에서 동등 이상 |
| 검색 범위 | 제목만 (57만 건) | 제목 (1,215만 건 전체) | 25배 확대 |
| 제안어 품질 | 문자열 prefix 매칭 | Nori 형태소 기반 prefix 매칭 | 형태소 단위 |
7. 현재 위치와 다음 단계
이전 글(FULLTEXT ngram 인덱스)에서 확인한 것:
- MySQL FULLTEXT ngram의 구조적 한계 3가지 (고빈도 토큰, 인덱스 크기, 검색 품질)
- 대안 기술(Lucene, ES/OpenSearch, 벡터 DB) 비용 비교 완료
- 임베디드 Lucene이 서버 비용(~$44~87/월)과 운영 트레이드오프를 감수할 때 이 프로젝트에 합리적인 선택
이 글에서 할 것:
- Lucene + Nori 형태소 분석기로 검색엔진 구축
- 1,477만 건 전체 데이터 인덱싱
- 고빈도 토큰 타임아웃 해소 검증
- Before/After 성능 측정
- k6 부하 테스트 Baseline (모든 검색어가 안정적으로 동작하는 상태에서 최초 실행)
8. After 수집: Lucene 전환 후
이 글의 구현을 모두 마친 뒤, 이전 글(FULLTEXT ngram 인덱스)의 Before 측정과 동일한 조건으로 After를 측정합니다. Before와 After가 같은 조건이어야 비교가 의미 있습니다.
검색 성능 (이전 글 §5~§6과 동일 검색어)
| 검색어 | Before (ngram) | After (Lucene Nori) | 개선율 |
|---|---|---|---|
| ”페텔” (희귀) | 23ms | 14ms | 39% 개선 |
| ”한국” (중빈도) | 281ms | 24ms | 91% 개선 |
| ”대한” (고빈도) | 5초+ 타임아웃 | 12ms | 타임아웃 해소 |
| ”한국어” → false positive | ”대한국제공항” 포함 | 미포함 | false positive 해소 |
| ”대한민국을” vs “대한민국” | 결과 다름 | 동일 (2,144건) | 형태소 분석 동작 |
인덱스/인프라 측정
| 항목 | Before (ngram) | After (Lucene Nori) | 변화 |
|---|---|---|---|
| 인덱스 크기 | 6.7GB (57만 건) | 29GB (1,215만 건) | 25배 데이터, 4.3배 인덱스 |
| 검색 대상 범위 | 1,215만 건 (전체) | 1,215만 건 (전체) | +2,500% |
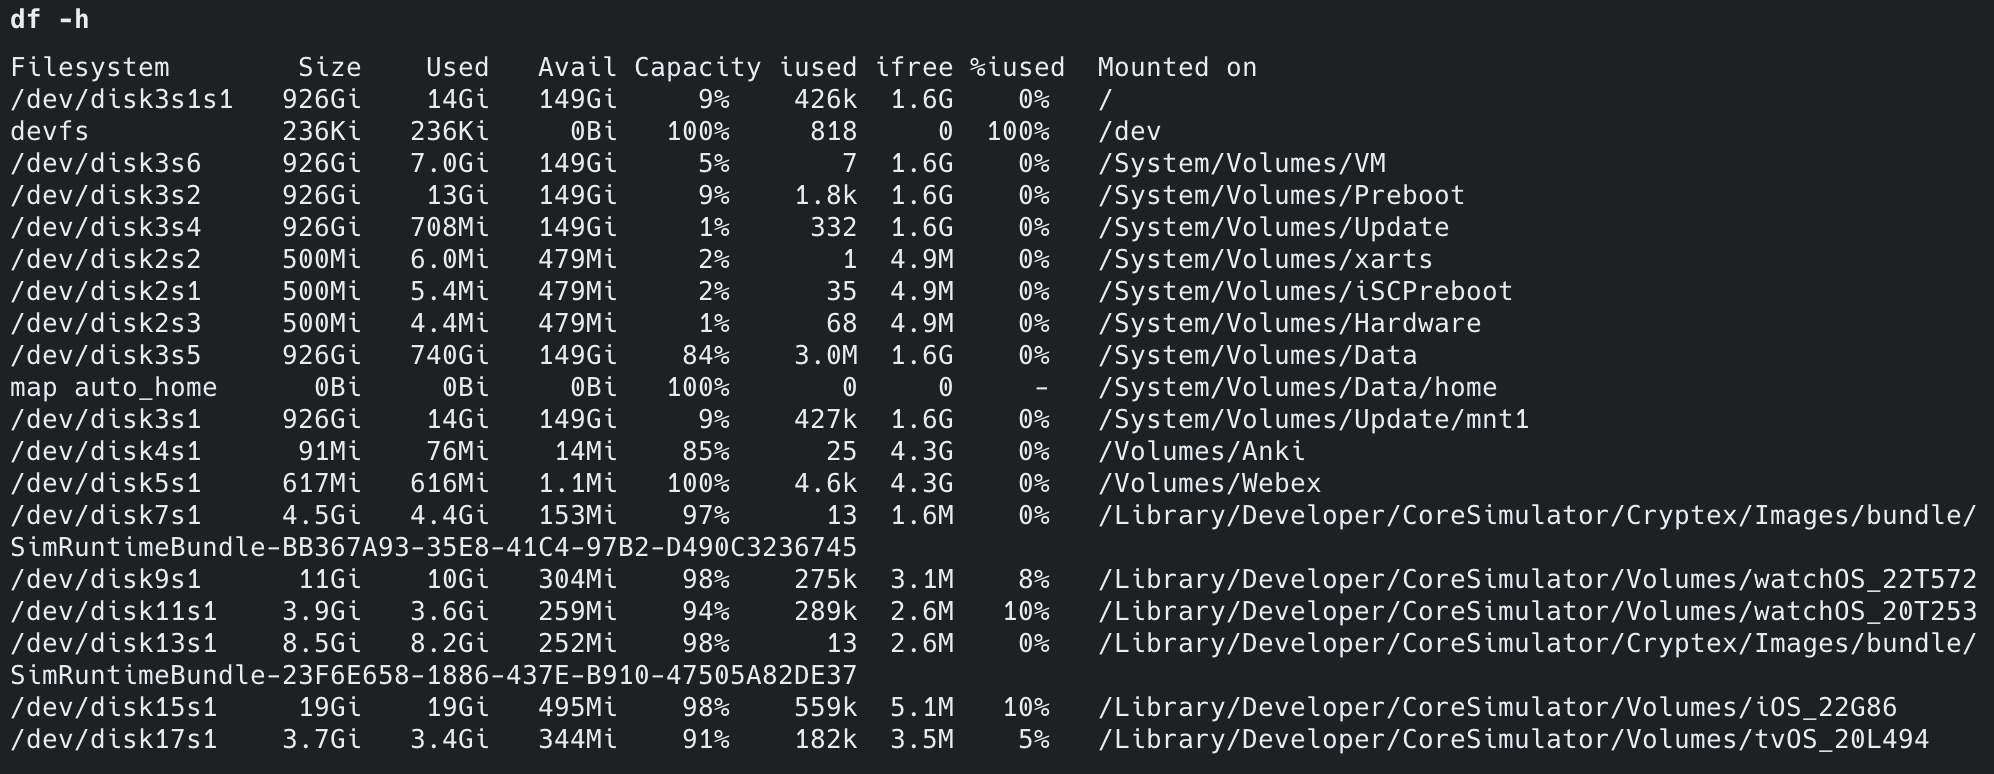
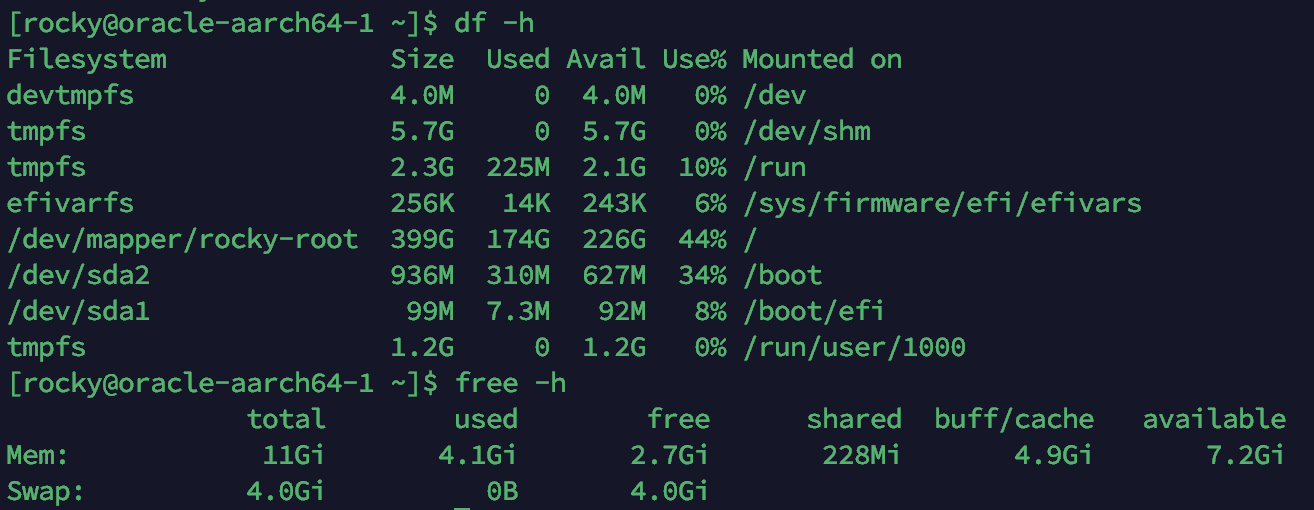
디스크 사용률 (df -h) | 174G/399G (44%) | 186G/399G (47%) | +12G (+3%p) |
페이지 캐시 (free -h) | 4.9GB (buff/cache) | 3.7GB (buff/cache) | -1.2GB |
| CPU (“대한” 검색 시 Grafana) | 타임아웃 (측정 불가) | 스파이크 없음 (12ms) | 타임아웃 해소 |
Before 기준, Lucene 전환 전 서버 상태 (df -h + free -h):
비용 변화
| 항목 | Before | After | 절감 |
|---|---|---|---|
| 추가 인프라 비용 | $0 (MySQL only) | $0 (Lucene 내장) | $0 변동 없음 |
| ES 도입 시 발생했을 비용 | - | $253~794/월 | 연간 $3,036~$9,528 회피 |
| 디스크 회수 (tmp_namu_posts DROP) | 사용 중 (12GB 데이터 + 6.7GB 인덱스) | ~19GB 회수 |
k6 부하 테스트
왜 부하 테스트를 해야 하는가?
단일 쿼리 성능(12~24ms)만으로는 실제 서비스 품질을 판단할 수 없습니다. 단일 요청이 빠르더라도 동시 사용자가 늘어나면 전혀 다른 병목이 드러납니다:
- HikariCP 커넥션 풀 포화: 동시 요청이 커넥션 풀(기본 10개)을 초과하면 대기 시간이 급증합니다.
- Lucene SearcherManager 경합: NRT refresh가 읽기 쿼리와 동시에 발생할 때 지연이 생길 수 있습니다.
- JVM GC pause: 동시 요청이 많아지면 힙 사용량이 급증하여 Full GC가 P99 레이턴시를 끌어올립니다.
- Row Lock 경합: 좋아요(INSERT IGNORE + UPDATE)가 동시에 같은 row를 잡으면 대기가 발생합니다.
- OFFSET 페이지네이션: 깊은 페이지(page=1000)를 여러 VU가 동시에 요청하면 MySQL이 대량의 row를 스캔합니다.
이전 글에서는 ngram 검색 자체가 타임아웃이라 부하 테스트가 무의미했습니다. Lucene으로 전환한 지금이 최초로 의미 있는 부하 테스트를 실행할 수 있는 시점입니다.
왜 4단계로 나누는가?
한 번에 최대 부하를 거는 것이 아니라, 문제를 격리할 수 있도록 단계적으로 실행합니다. k6 공식 가이드에서 권장하는 패턴입니다.
| 단계 | 프로필 | 시간 | 최대 VU | 실제 사용자 환산 | 목적 |
|---|---|---|---|---|---|
| 1 | smoke | 2분 | 5 | DAU ~100명 | 스크립트가 에러 없이 동작하는지 검증. 여기서 실패하면 서버가 아니라 스크립트 문제 |
| 2 | load | 20분 | 100 | DAU ~2,000명 | baseline 성능 측정. 일상 트래픽에서의 응답 시간과 에러율 확인 |
| 3 | stress | 25분 | 200 | DAU ~4,000명 | 시스템 한계점 탐색. 어느 VU 수에서 에러율이 급증하는지 확인 |
| 4 | soak | 4시간 | 50 | DAU ~1,000명 | 장기 안정성 검증. 메모리 누수, GC pause 누적, 커넥션 풀 고갈 감지 |
VU(Virtual User)는 동시 접속자 수를 의미합니다. 1 VU = 1명이 동시에 요청을 보내는 상태이며, 실제 서비스에서 전체 사용자의 5~10%가 동시 접속한다고 가정하면 100 VU ≈ DAU 1,000~2,000명에 해당합니다.
단계별 의미:
- smoke에서 에러 → 스크립트 버그 (서버 문제 아님)
- load에서 에러 → 일상 트래픽도 못 버팀 (심각)
- stress에서만 에러 → 한계점을 찾은 것 (정상적인 결과)
- soak에서 시간이 지날수록 느려짐 → 메모리 누수 (Lucene SearcherManager, HikariCP 등)
테스트 시나리오 설계
시나리오 비율 (실제 커뮤니티 트래픽 반영, 읽기 85%, 쓰기 15%):
| 시나리오 | 비율 | 측정 대상 | 왜 측정하는가? |
|---|---|---|---|
| 검색 | 35% | Lucene BM25 + Nori | 핵심 기능. posting list 길이에 따른 성능 차이를 빈도별로 측정 |
| 자동완성 | 20% | Lucene PrefixQuery | 타이핑 중 체감 지연이 200ms를 넘으면 UX가 나빠짐 |
| 최신 게시글 목록 조회 | 15% | OFFSET 페이지네이션 | 깊은 페이지(30% 확률로 page=100~1000) 요청 시 MySQL 부하 확인 |
| 상세 조회 | 15% | findById + 조회수 증가 | 조회수 UPDATE가 동시에 같은 row를 잡을 때의 지연 측정 |
| 글 생성 | 8% | NRT 증분 색인 | IndexWriter.updateDocument()가 동시 부하에서도 안정적인지 검증 |
| 좋아요 | 7% | INSERT IGNORE + Row Lock | 동시에 같은 게시글에 좋아요를 누를 때 InnoDB 락 경합 측정 |
검색어 빈도 분포: 검색 시나리오 내에서 희귀 토큰 10%, 중빈도 60%, 고빈도 30% 비율로 검색어를 선택합니다.
Lucene은 posting list 길이에 따라 성능이 달라지므로, 고빈도 토큰(“대한민국”, “history”)에서의 성능이 실제 서비스 품질을 결정합니다.
목표 임계값
글로벌 SLO와 엔드포인트별 SLA를 분리합니다. k6 공식 문서에서 권장하는 패턴으로, 글로벌은 “전체적으로 괜찮은가”의 안전망이고, 엔드포인트별은 각 API의 실제 성능 기대치입니다.
| 메트릭 | 임계값 | 왜 이 기준인가? |
|---|---|---|
| 전체 P95 | < 3,000ms | 글로벌 SLO 안전망. 최신 게시글 목록 조회(OFFSET)가 느리므로 느슨하게 설정 |
| 전체 P99 | < 5,000ms | 최악 케이스(deep OFFSET + GC pause) 허용 |
| 검색 P95 / P99 | < 300ms / < 500ms | 단일 쿼리 12~24ms이므로 동시 100명에서도 여유. Google 연구에서 200~300ms가 사용자 이탈 경계 |
| 자동완성 P95 / P99 | < 200ms / < 300ms | 타이핑 중 체감 지연 200ms 이내여야 “즉시 반응”으로 느껴짐 |
| 최신 게시글 목록 조회 P95 | < 5,000ms | OFFSET 페이지네이션 baseline. keyset 전환 후 500ms로 하향 예정 |
| 상세 조회 P95 | < 200ms | PK 조회, 빨라야 정상 |
| 쓰기 P95 | < 300ms | DB INSERT + Lucene NRT 색인 포함 |
| 에러율 | < 1% | 99% 이상의 요청이 정상 응답해야 안정적 서비스 |
왜 P95/P99를 보는가? 평균 응답시간은 소수의 느린 요청을 숨깁니다. P95는 “100명 중 95명의 경험”, P99는 “100명 중 99명의 경험”을 나타냅니다. 실제 서비스 품질은 평균이 아닌 tail latency가 결정합니다.
왜 글로벌과 엔드포인트별을 분리하는가?
http_req_duration(글로벌)만 두면 느린 최신 게시글 목록 조회가 전체 P95를 오염시켜 검색·자동완성의 실제 성능을 파악할 수 없습니다. 반대로 엔드포인트별만 두면 새 API 추가 시 threshold를 깜빡하면 모니터링 사각지대가 생깁니다.
부하 패턴 상세 (load 프로필, baseline 측정용)
| 구간 | 시간 | VU 수 | 목적 |
|---|---|---|---|
| 워밍업 | 2분 | 0 → 50 | JVM JIT 컴파일, Lucene 페이지 캐시 적재 |
| 정상 부하 | 10분 | 50 유지 | 일상 트래픽 시뮬레이션, 안정 상태 측정 |
| 피크 부하 | 2분 | 50 → 100 | 피크 트래픽 전환 |
| 피크 유지 | 5분 | 100 유지 | 피크 상태에서의 안정성 확인 |
| 쿨다운 | 1분 | 100 → 0 | 시스템 회복 능력 확인 |
이전 버전(3분짜리)은 smoke 수준에 불과했습니다. k6 공식 가이드에서 baseline 측정은 최소 10분 이상 steady state를 유지해야 JVM GC, 커넥션 풀, 캐시 워밍업 효과가 안정화된 후의 진짜 성능을 측정할 수 있다고 권장합니다.
실행 방법
monitoring-loki 서버(Grafana + InfluxDB가 있는 서버)에서 실행합니다. k6와 InfluxDB가 같은 서버에 있으므로 localhost:8086으로 메트릭을 전송하고, 부하 대상인 App Server에는 nginx(HTTPS) → Spring Boot 경로로 요청합니다. TLS 핸드셰이크, Nginx 프록시 오버헤드까지 포함한 실제 서비스 경로를 테스트하며, OCI 내부 네트워크를 경유하므로 공용 인터넷 레이턴시 변동이 측정에 노이즈로 끼지 않아 서버 자체의 처리 능력을 더 정확하게 측정할 수 있습니다.
# monitoring-loki 서버에 SSH 접속 후 실행
# 1단계: smoke — 스크립트 검증 (2분)k6 run -e PROFILE=smoke -e BASE_URL=https://api.example.com ~/k6/baseline-load-test.js
# 2단계: load — baseline 성능 측정 (20분, Grafana 연동)k6 run --out influxdb=http://localhost:8086/k6 \ -e PROFILE=load -e BASE_URL=https://api.example.com ~/k6/baseline-load-test.js측정 결과: smoke 프로필 (스크립트 검증)
테스트 환경: ARM 2코어 / 12GB RAM에서 Spring Boot 2GB(JVM 힙 1GB) + MySQL 4GB(InnoDB BP 2GB) + 모니터링 에이전트 ~1GB. 나머지 ~5GB는 OS 페이지 캐시(Lucene MMap).
smoke 프로필의 목적은 스크립트가 에러 없이 동작하는지 검증하는 것입니다. 5 VU / 2분이라 샘플 수가 적어 P99는 통계적으로 무의미하므로, 여기서는 평균과 P95만 봅니다. 성능 판단은 load 프로필부터입니다.
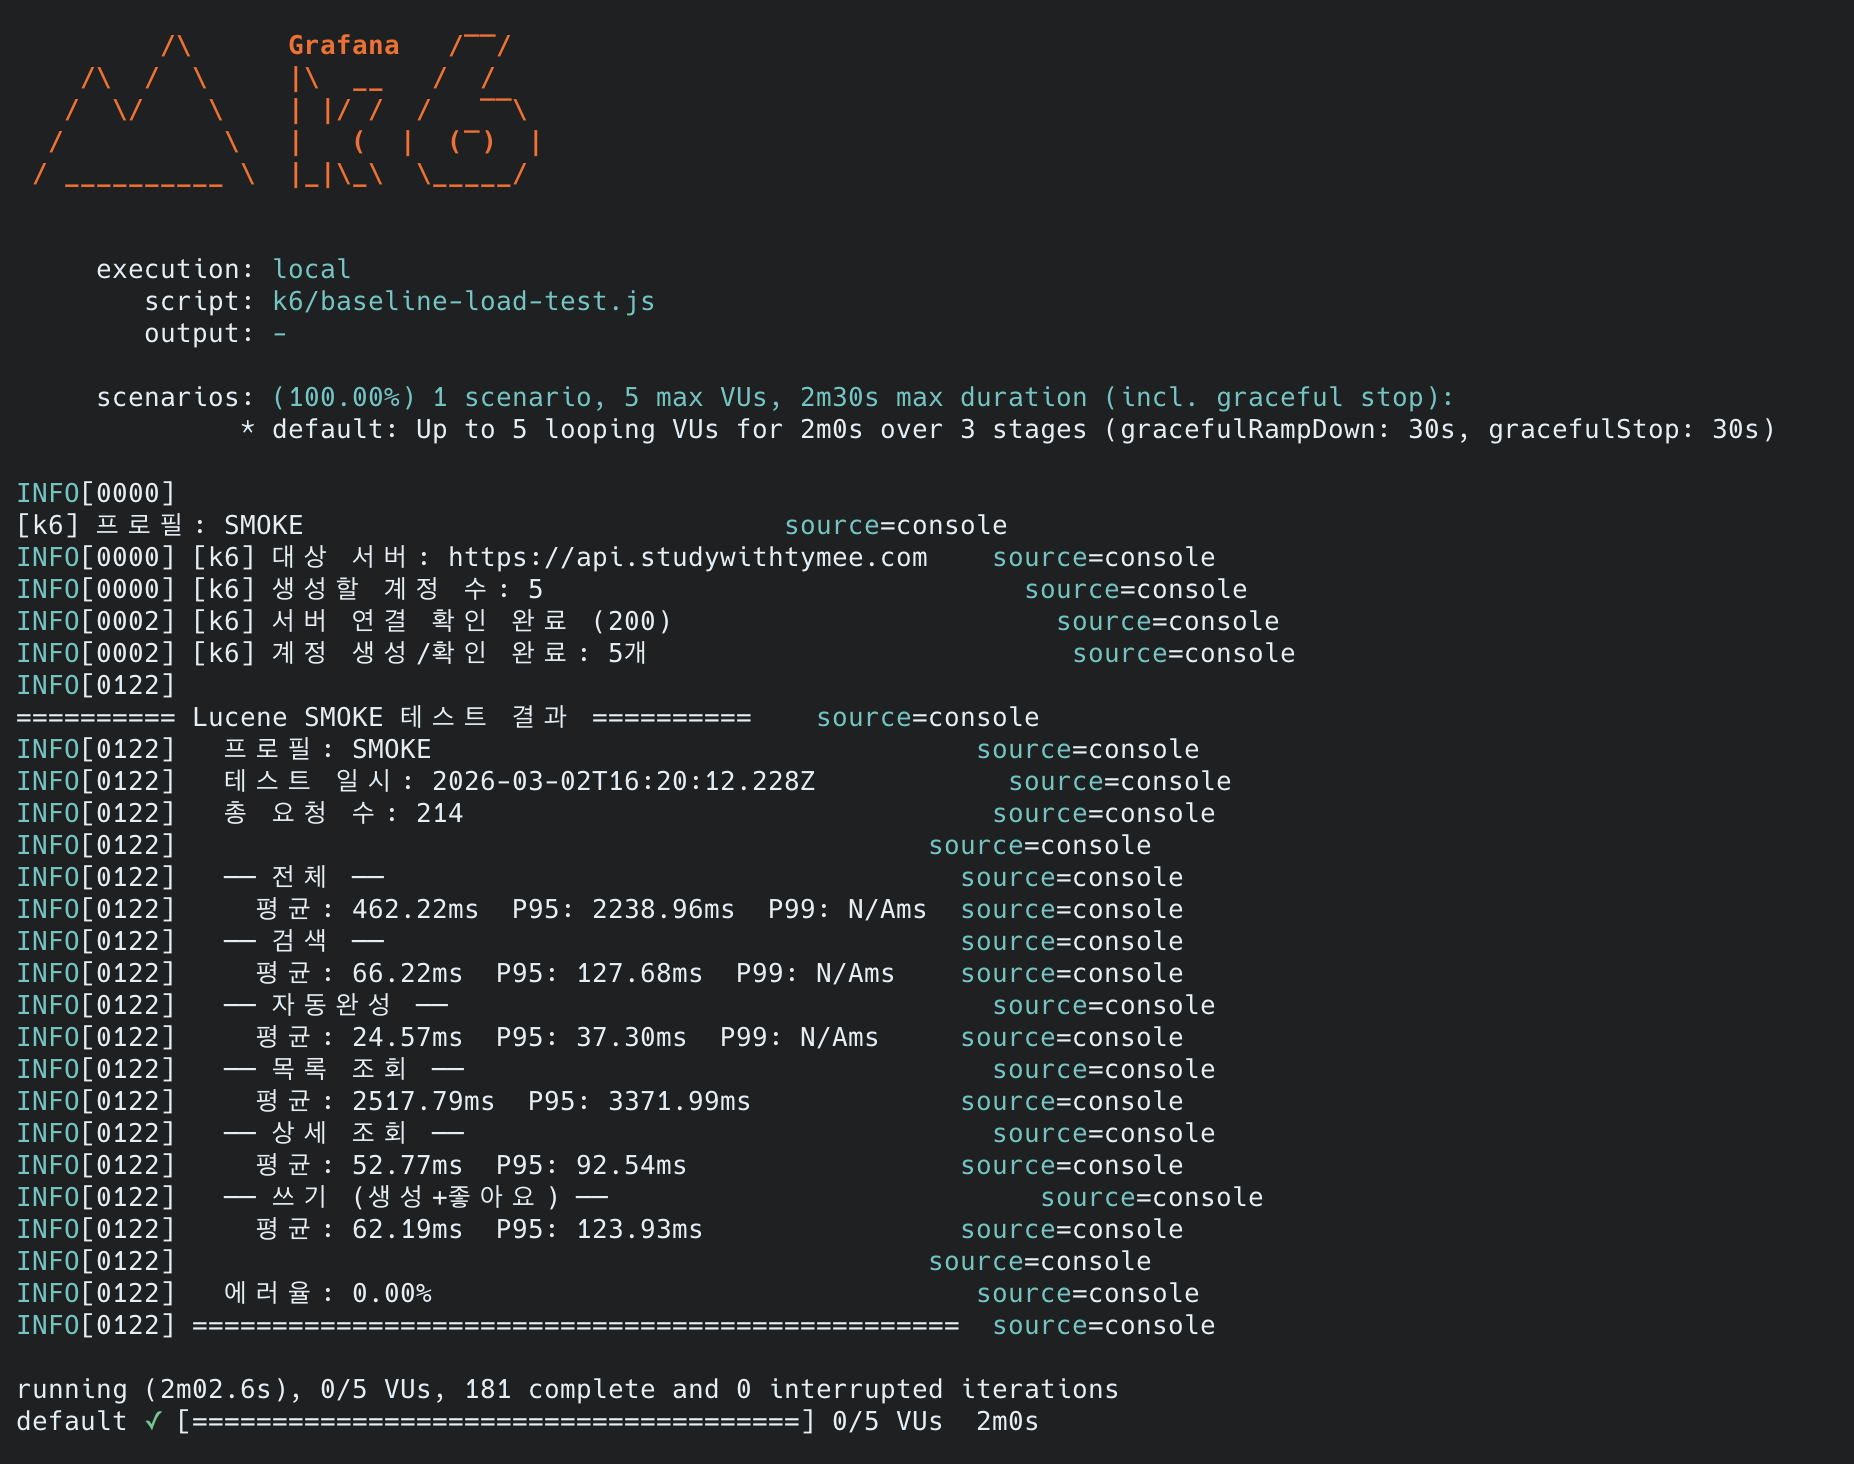
| 메트릭 | 검색 | 자동완성 | 최신 게시글 목록 조회 | 상세 조회 | 쓰기 |
|---|---|---|---|---|---|
| 평균 | 66ms | 25ms | 2,518ms | 53ms | 62ms |
| P95 | 128ms | 37ms | 3,372ms | 93ms | 124ms |
| Threshold | PASS | PASS | PASS | PASS | PASS |
| 전체 | 값 |
|---|---|
| 총 요청 수 | 214건 |
| 에러율 | 0.00% |
| 전체 평균 | 462ms |
| 전체 P95 | 2,239ms (< 3,000ms) |
| 모든 Threshold | 전체 통과 |
smoke에서 확인한 것:
- 6개 시나리오(검색, 자동완성, 목록, 상세, 생성, 좋아요)가 에러 없이 동작
- Lucene 검색·자동완성은 동시 5명에서 충분히 빠름 (P95 128ms / 37ms)
- 최신 게시글 목록 조회(OFFSET 페이지네이션)가 평균 2.5초로 가장 느림. 예상된 병목
최신 게시글 목록 조회가 느린 이유: MySQL(InnoDB)의 구조적 문제:
MySQL의 AUTO_INCREMENT는 테이블 내부에 종속되어 있고, InnoDB는 클러스터 인덱스 구조입니다. SELECT * + OFFSET을 하면 세컨더리 인덱스에서 PK를 얻고, 다시 클러스터 인덱스로 가서 content(LONGTEXT) 포함 전체 행을 읽어야 합니다. 반면 PostgreSQL/Oracle은 SERIAL(SEQUENCE) 타입으로 ID가 테이블 외부에서 관리되고, 인덱스에 힙 포인터가 있어 Index Only Scan으로 ID만 빠르게 참조할 수 있습니다.
k6 스크립트에서 30% 확률로 page=100~1000을 요청합니다. page 1000 = OFFSET 20,000이므로, MySQL이 20,020개 행의 LONGTEXT까지 읽고 20,000개를 버립니다. 컬럼 수가 많을수록, 페이지가 깊어질수록 MySQL이 압도적으로 느려지는 구조입니다.
이 문제의 분석과 해결은 Deferred Join 적용기 — 기대한 40배 vs 현실 13%에서 다룹니다. Deferred Join은 이 구조적 문제를 2단계로 분리하여 해결합니다: ①세컨더리 인덱스(Covering Index)에서 ID만 먼저 추출 → ②그 ID로 클러스터 인덱스에서 20건만 조회. Deferred Join 적용 후 P95가 3,372ms → 2,741ms(-19%)로 개선되었으나, EXPLAIN 분석 결과 병목의 85%가 OFFSET 자체의 인덱스 스캔 비용이었습니다. 최대 페이지를 200으로 제한하여 worst-case를 ~500ms 수준으로 낮췄습니다.
후속 최적화: 이후 COUNT(*) 제거(
Page<T>→Slice<T>전환)와 Google/네이버 기준 최대 30페이지 제한을 추가 적용하여, 최신 게시글 목록 조회가 2,518ms → 12.70ms(-99.5%)로 개선되었습니다.
측정 결과: load 프로필 (baseline 성능 측정)
load 프로필은
--out influxdb로 Grafana에 데이터를 전송하고, 대시보드에서 시계열 그래프로 확인합니다. 20분간의 VU 변화(50 → 100)에 따른 응답 시간 추이를 보는 것이 핵심입니다.
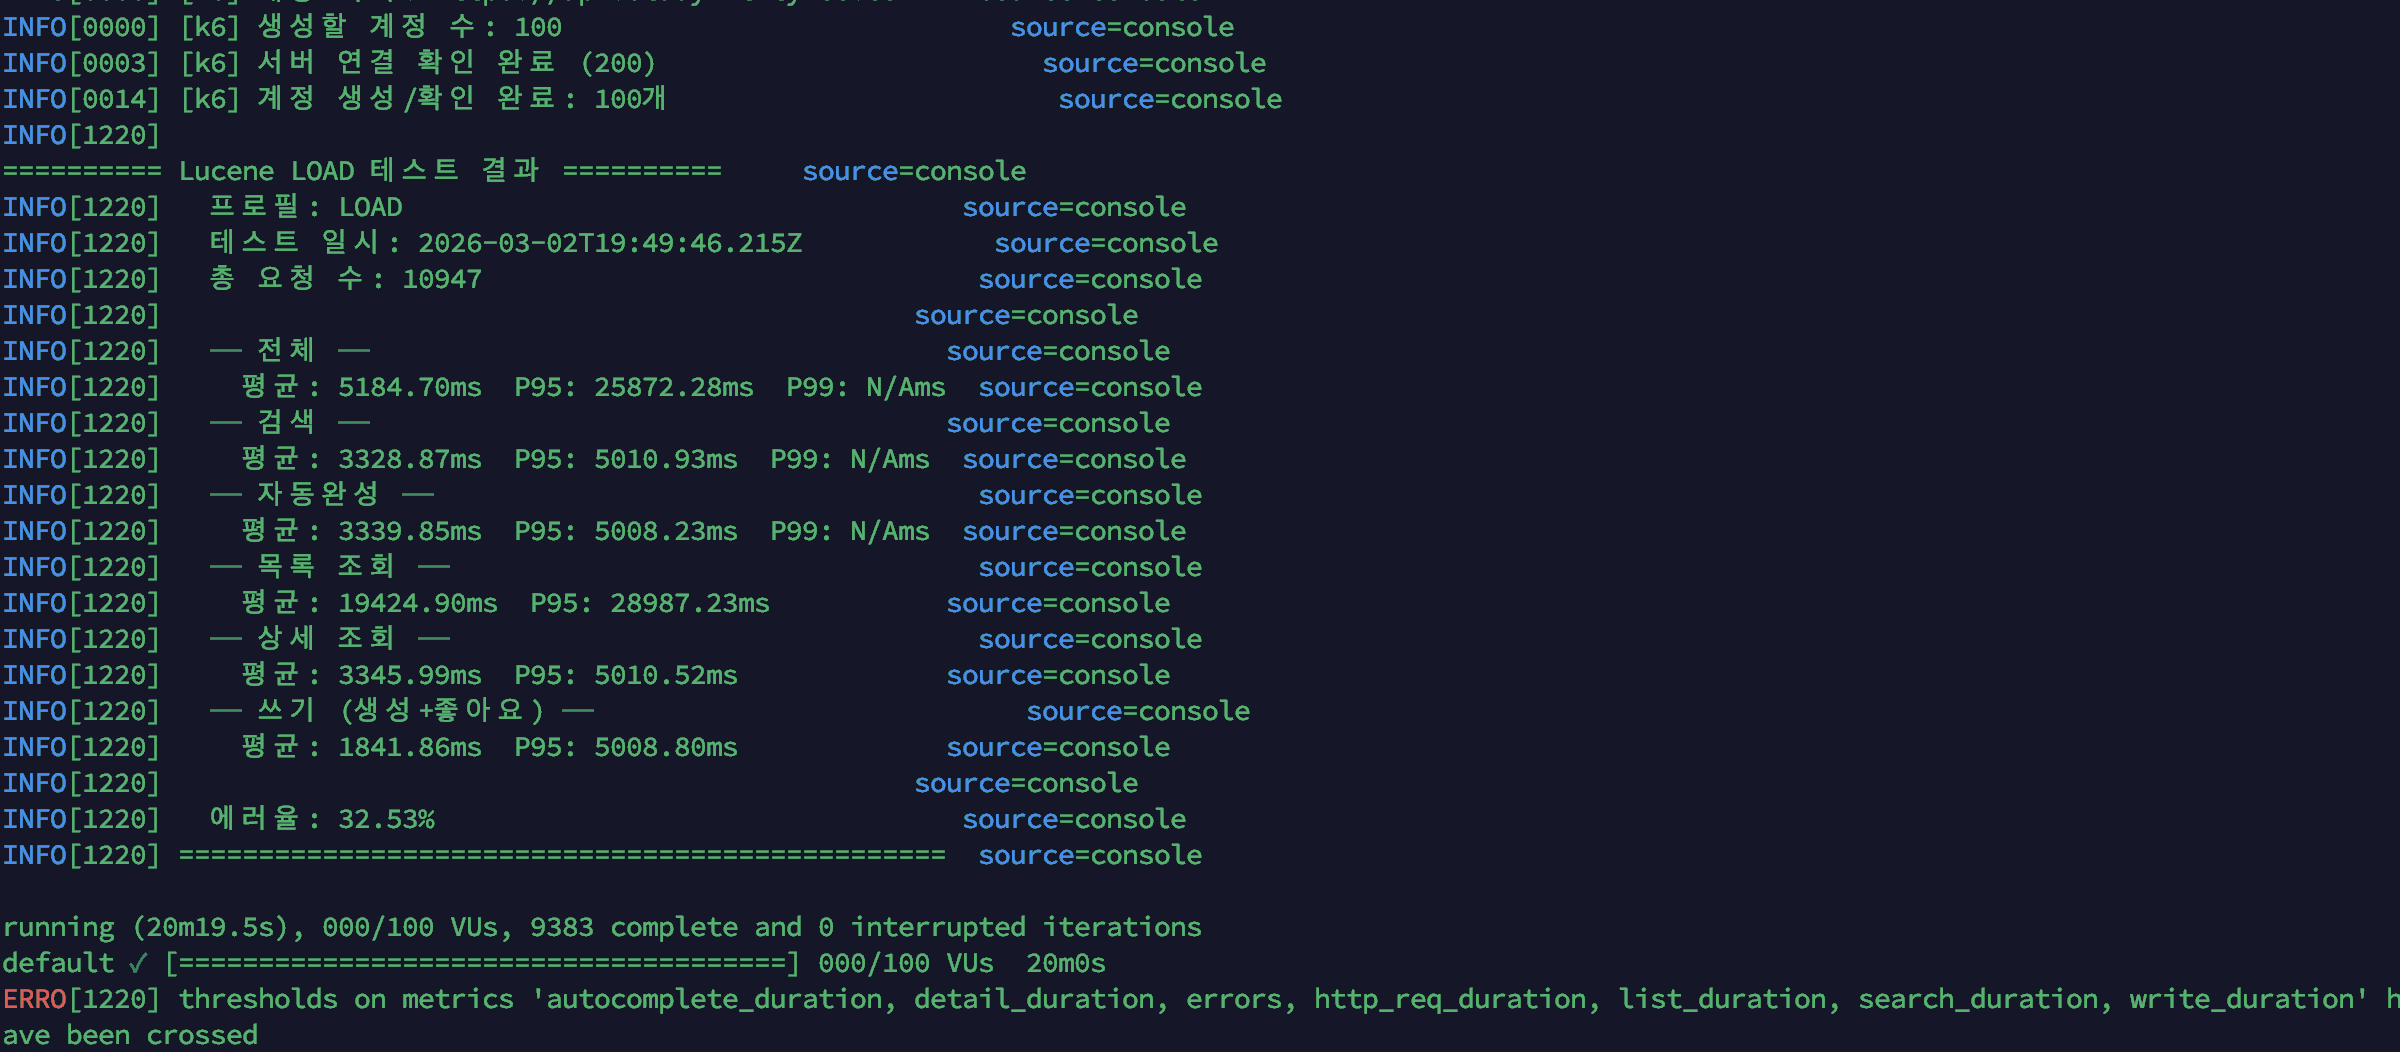
API 응답 시간:
| 메트릭 | 검색 | 자동완성 | 최신 게시글 목록 조회 | 상세 조회 | 쓰기 (생성+좋아요) |
|---|---|---|---|---|---|
| 평균 | 3,328ms | 3,339ms | 19,424ms | 3,345ms | 1,841ms |
| P95 | 5,010ms | 5,008ms | 28,987ms | 5,010ms | 5,008ms |
| 전체 | 값 |
|---|---|
| 총 요청 수 | 10,947건 |
| 에러율 | 32.53% |
| 전체 평균 | 5,184ms |
| 전체 P95 | 25,872ms |
| 모든 Threshold | 전체 실패 |
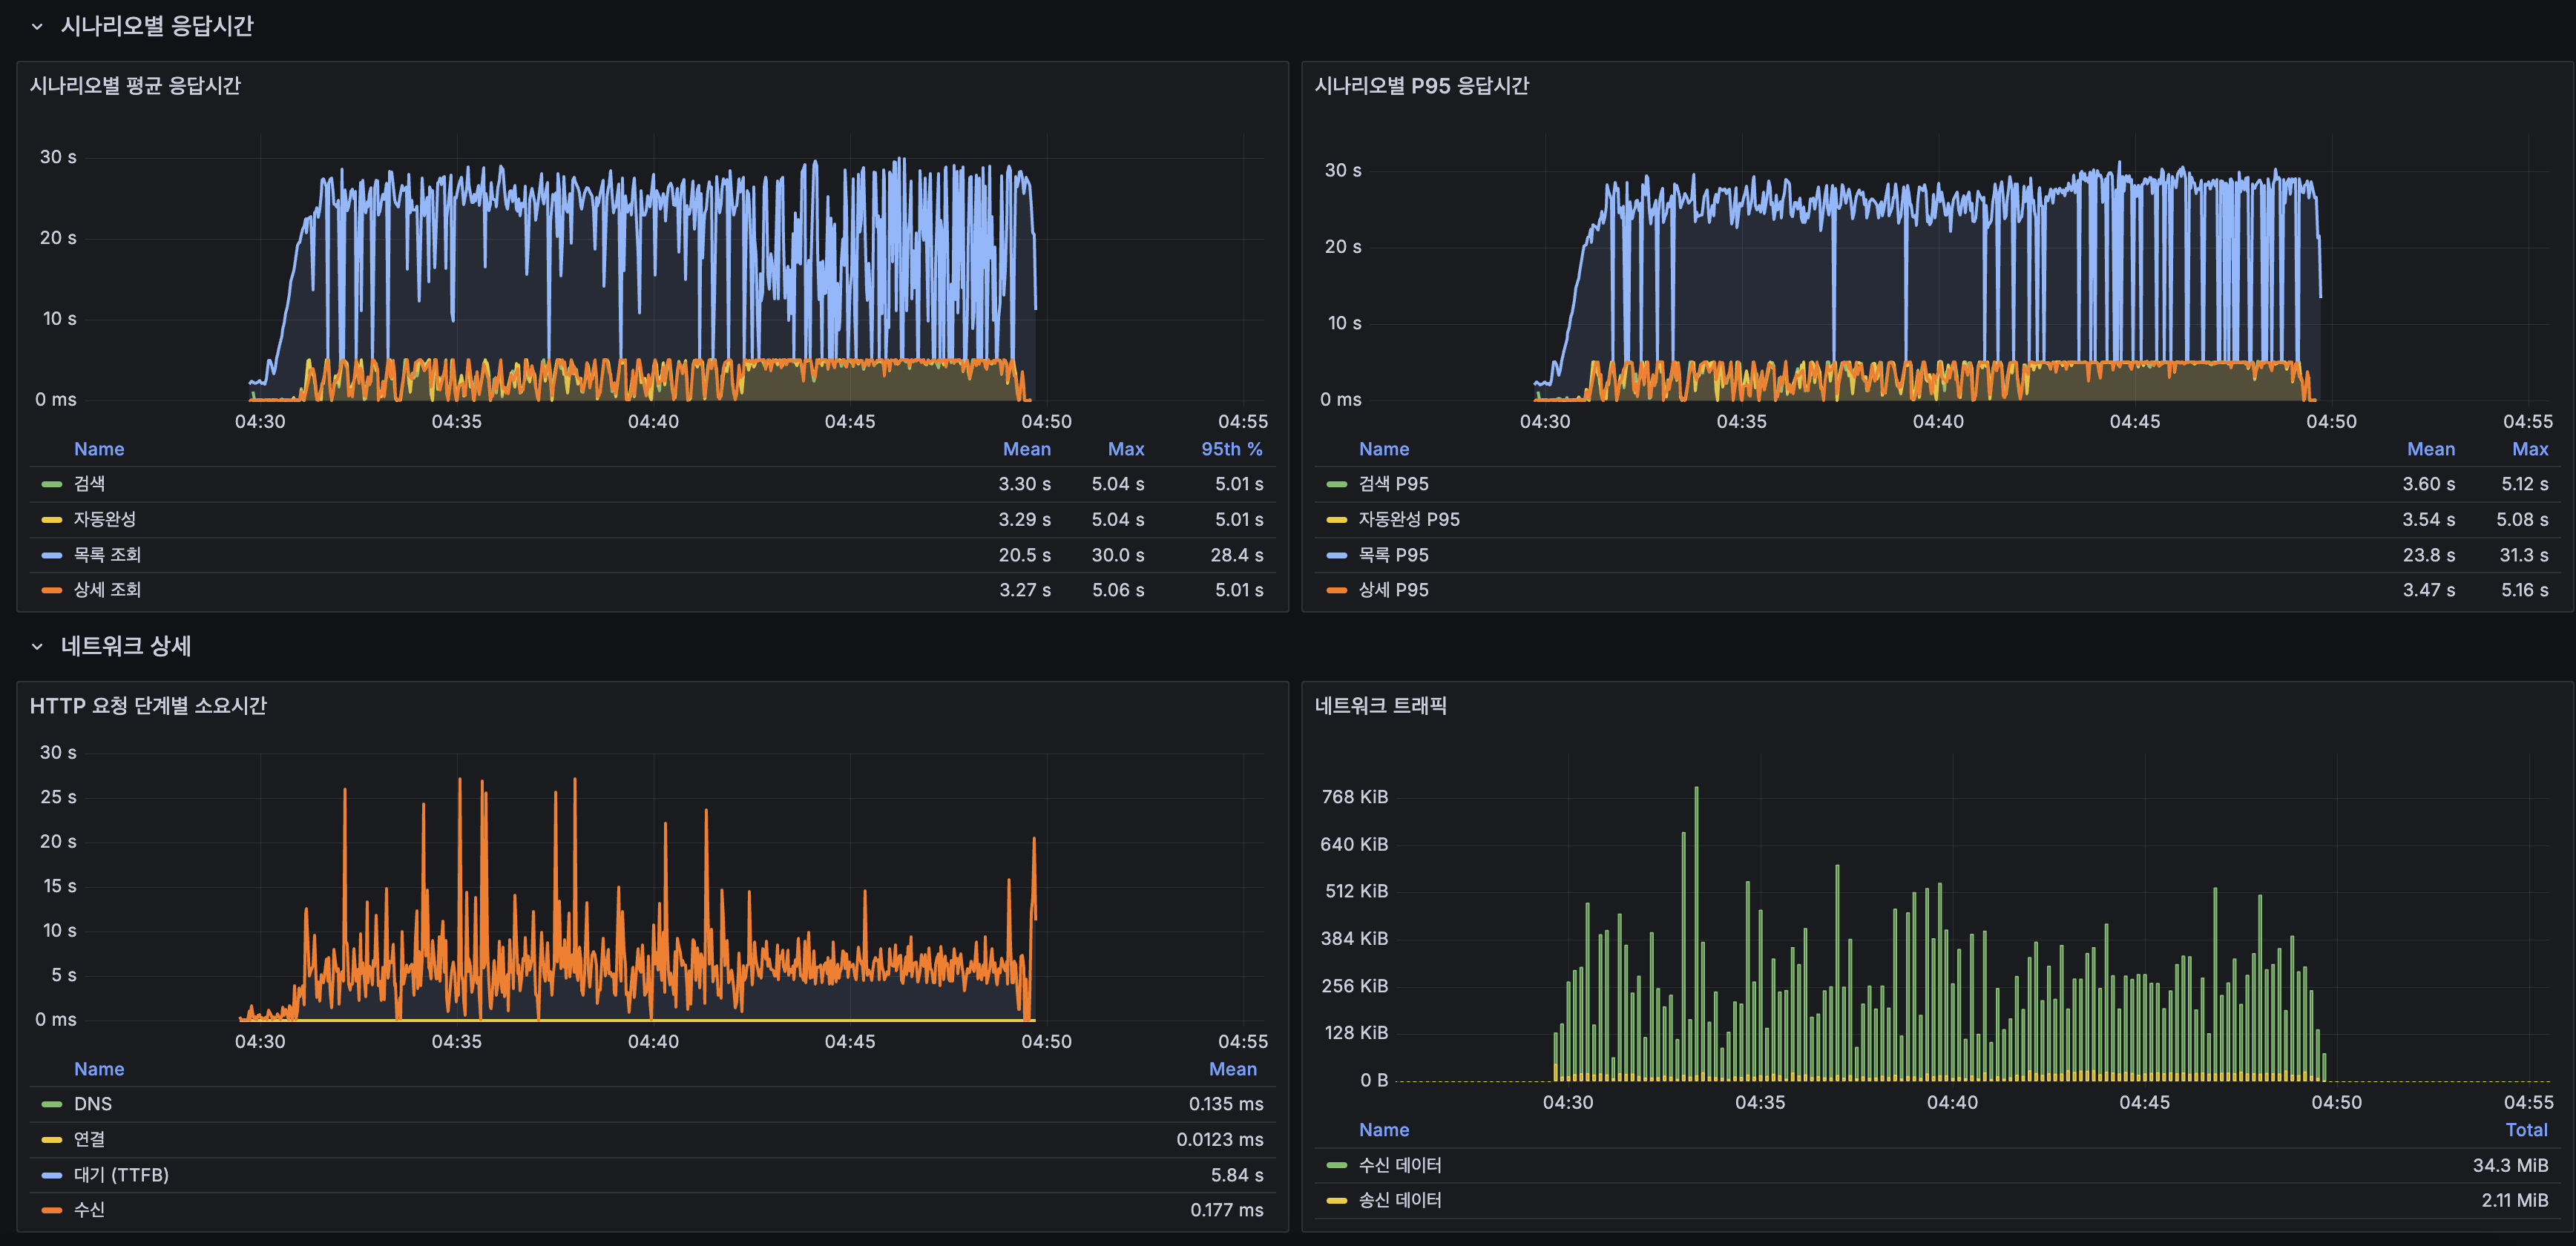
결과 요약: 전면 실패. smoke에서 5 VU로 문제없던 서비스가 50~100 VU에서 완전히 무너졌습니다. 특히 smoke에서 66ms였던 검색이 3,328ms로 50배 느려졌고, 최신 게시글 목록 조회는 평균 19.4초, 에러율 32.53%입니다. 최신 게시글 목록 조회만의 문제가 아니라, 최신 게시글 목록 조회의 heavy OFFSET이 CPU를 잡아먹으면서 모든 시나리오가 연쇄적으로 무너진 패턴입니다.
병목 분석: 어디서 무너졌는가?
1) CPU 포화: 단일 코어 한계
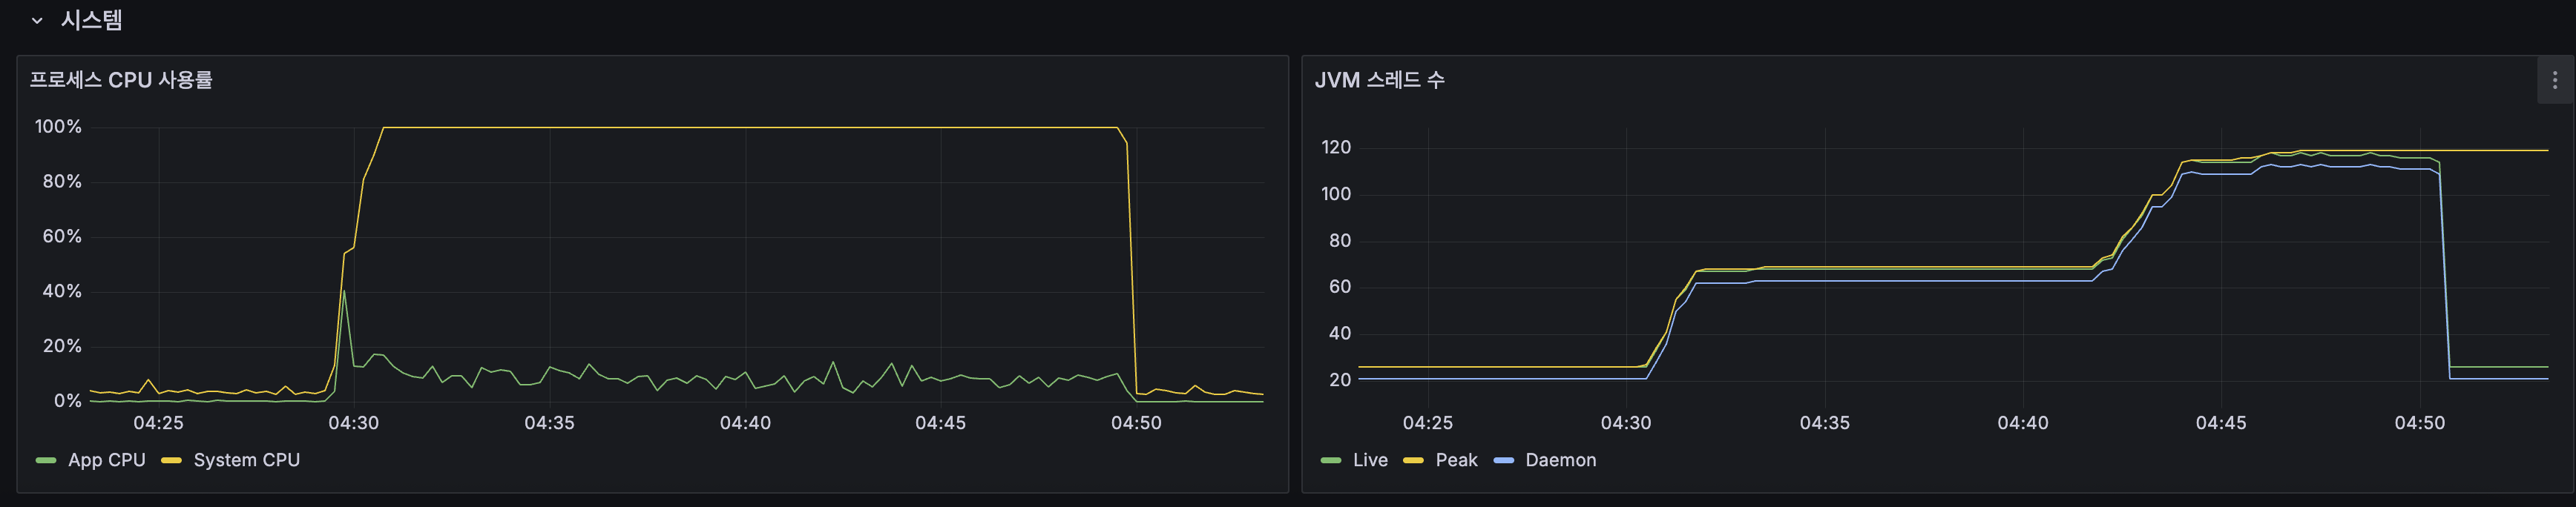
- System CPU가 테스트 시작 직후 100%에 도달하고 20분 내내 유지됨
- JVM 스레드가 20 → 60 → 70 → 120으로 계단식 증가. VU 증가에 따라 Tomcat 워커 스레드가 추가 생성됨
- ARM 서버(OCI A1.Flex)는 2 OCPU(2코어), 12GB RAM. 메모리는 47%로 여유롭지만, CPU-bound 작업인 Lucene 검색과 MySQL 쿼리가 2코어를 놓고 경쟁
2) MySQL이 진짜 병목
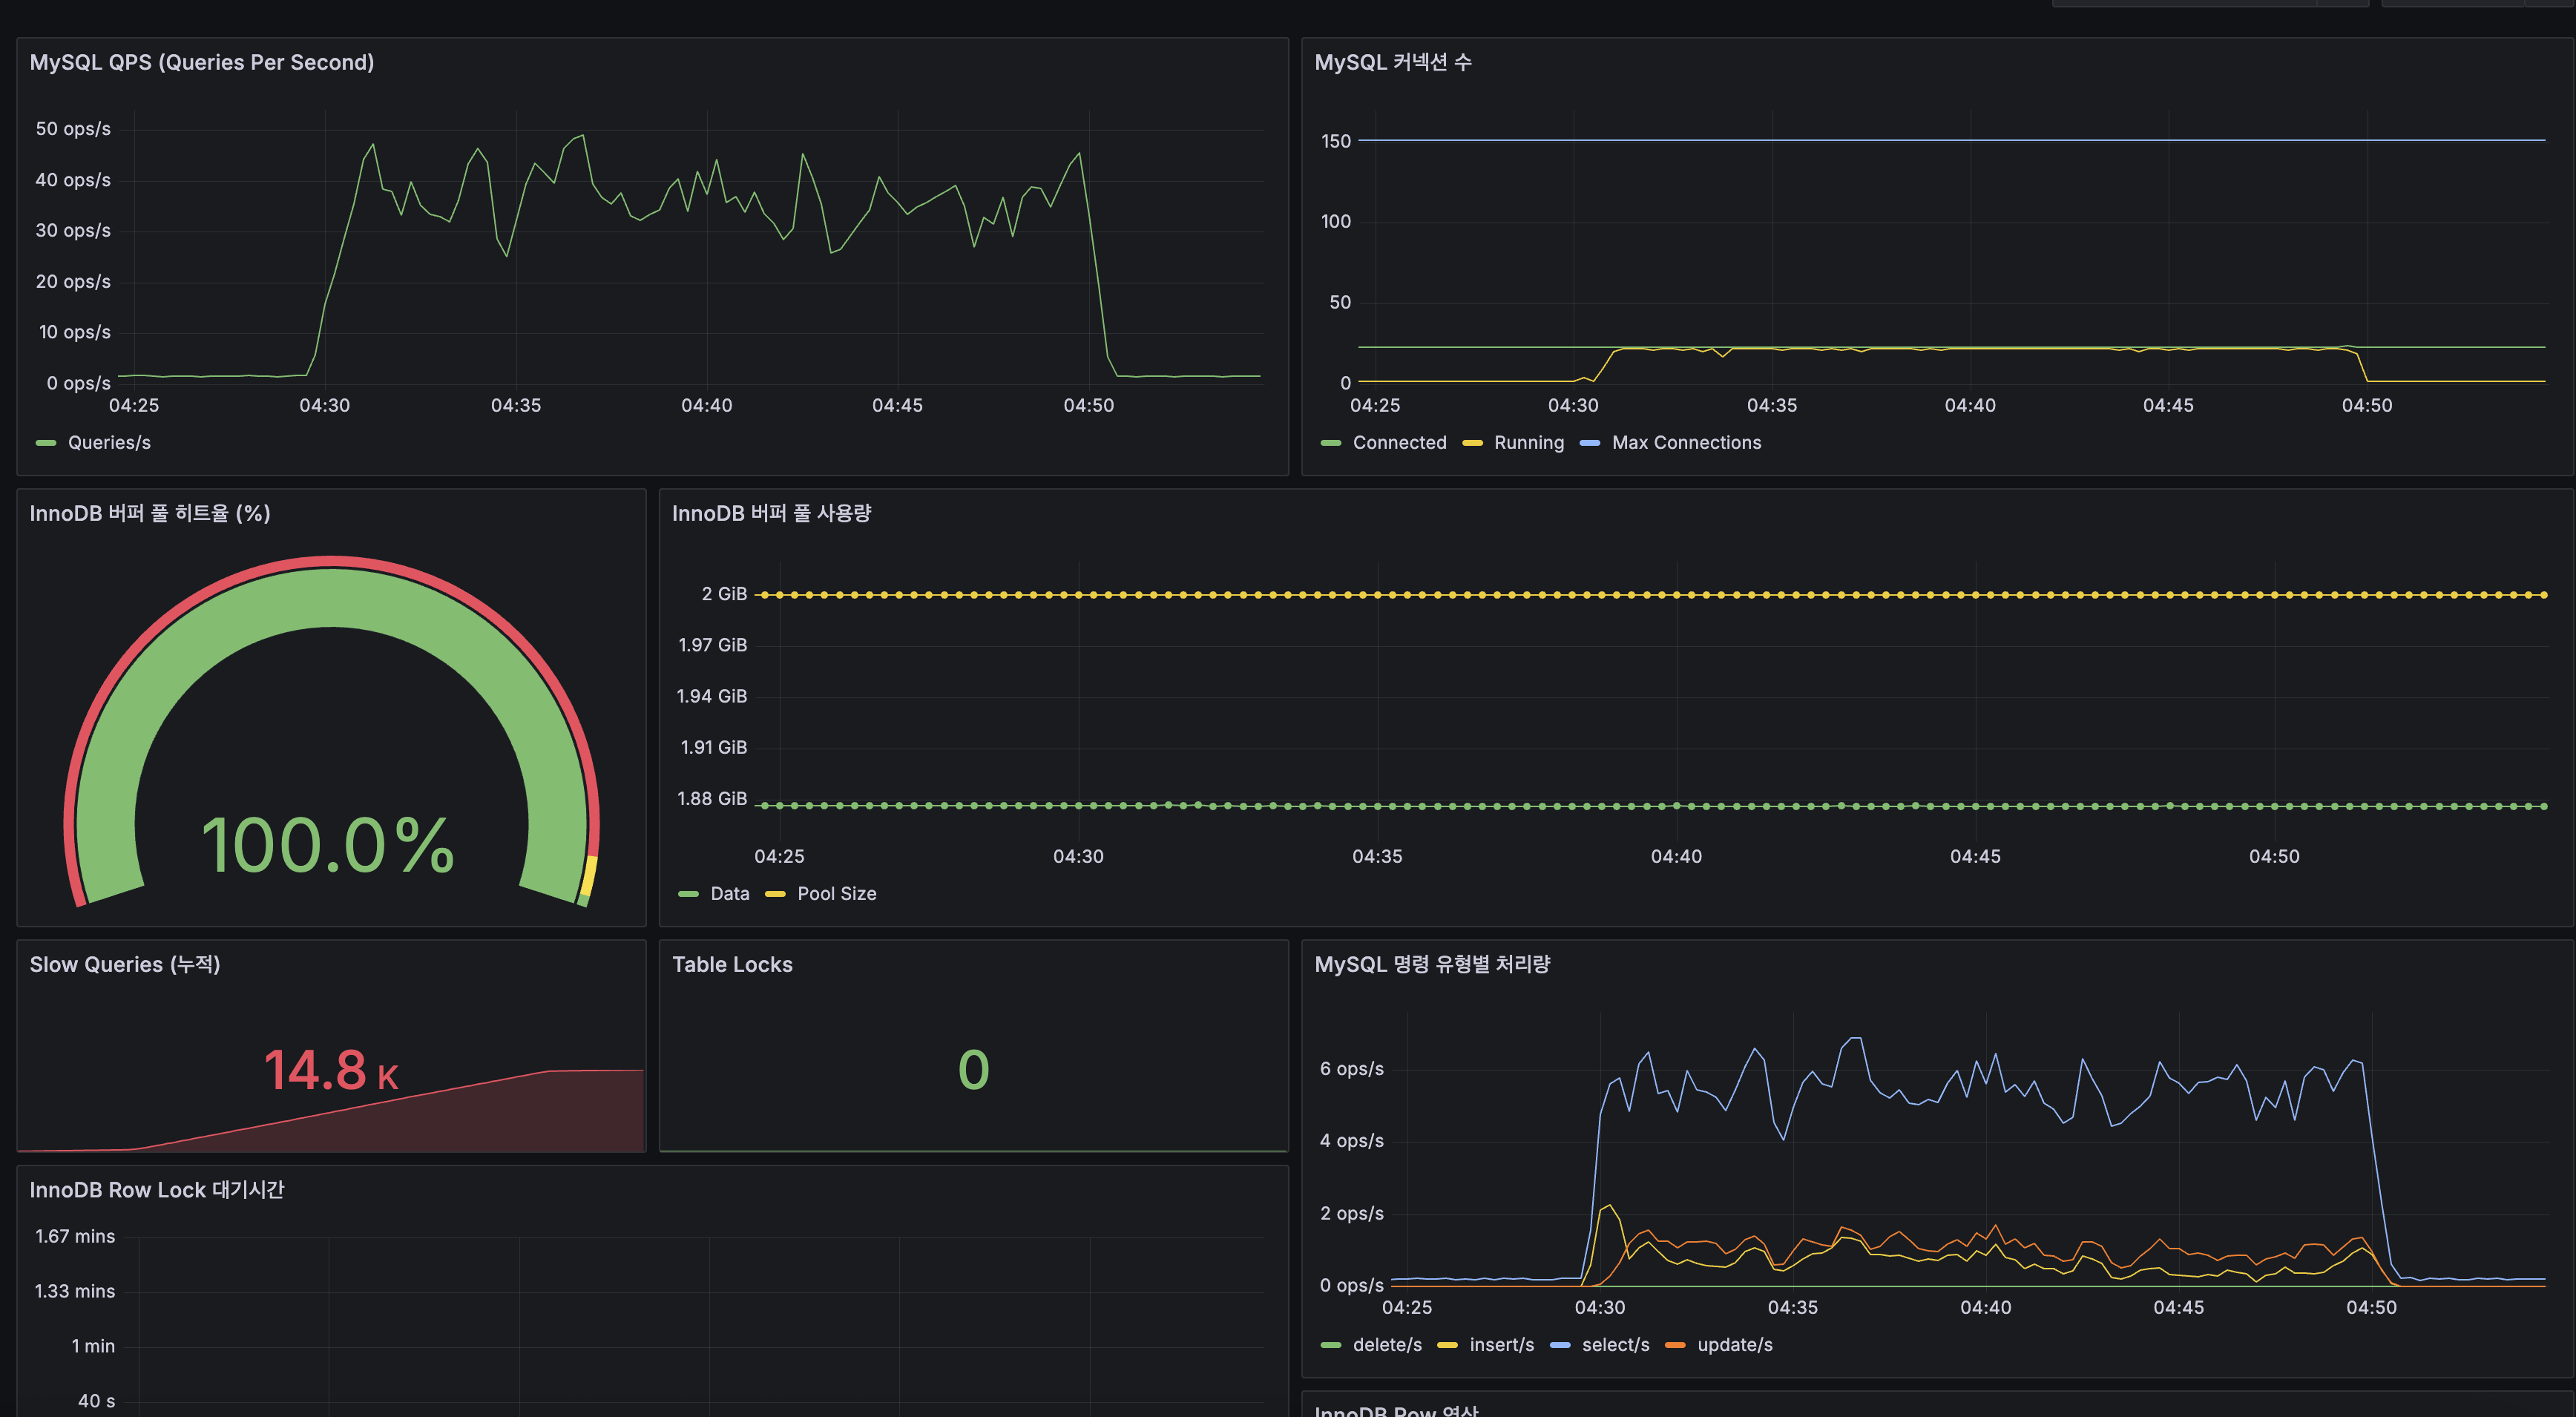
| MySQL 지표 | 값 | 해석 |
|---|---|---|
| QPS | 30~50 ops/s | 피크 시 50까지, 이후 CPU 포화로 하락 |
| Slow Queries (누적) | 14,800건 | 20분간 거의 모든 쿼리가 slow query |
| InnoDB Buffer Pool 히트율 | 100% | 디스크 I/O 병목 아님, CPU 병목 확정 |
| 커넥션 수 | ~10 (Max 150) | HikariCP 풀 크기 20 중 절반만 사용, 커넥션 부족 아님 |
| Table Lock | 0 | 잠금 경합 없음 |
| Row Lock 대기 | 최대 1.67분 | INSERT/UPDATE 시 InnoDB 행 잠금 대기 발생 |
핵심: InnoDB Buffer Pool 히트율 100%는 메모리에 데이터가 충분히 올라가 있다는 뜻입니다. 그럼에도 Slow Query가 14.8K건 발생한 이유는 CPU가 포화되어 쿼리 처리 자체가 느려졌기 때문입니다. 특히 최신 게시글 목록 조회의 OFFSET 20,000 같은 deep pagination은 CPU-bound 연산(인덱스 스캔 → 행 건너뛰기)이므로, CPU 1코어 환경에서 치명적입니다.
3) 컨테이너별 리소스 사용
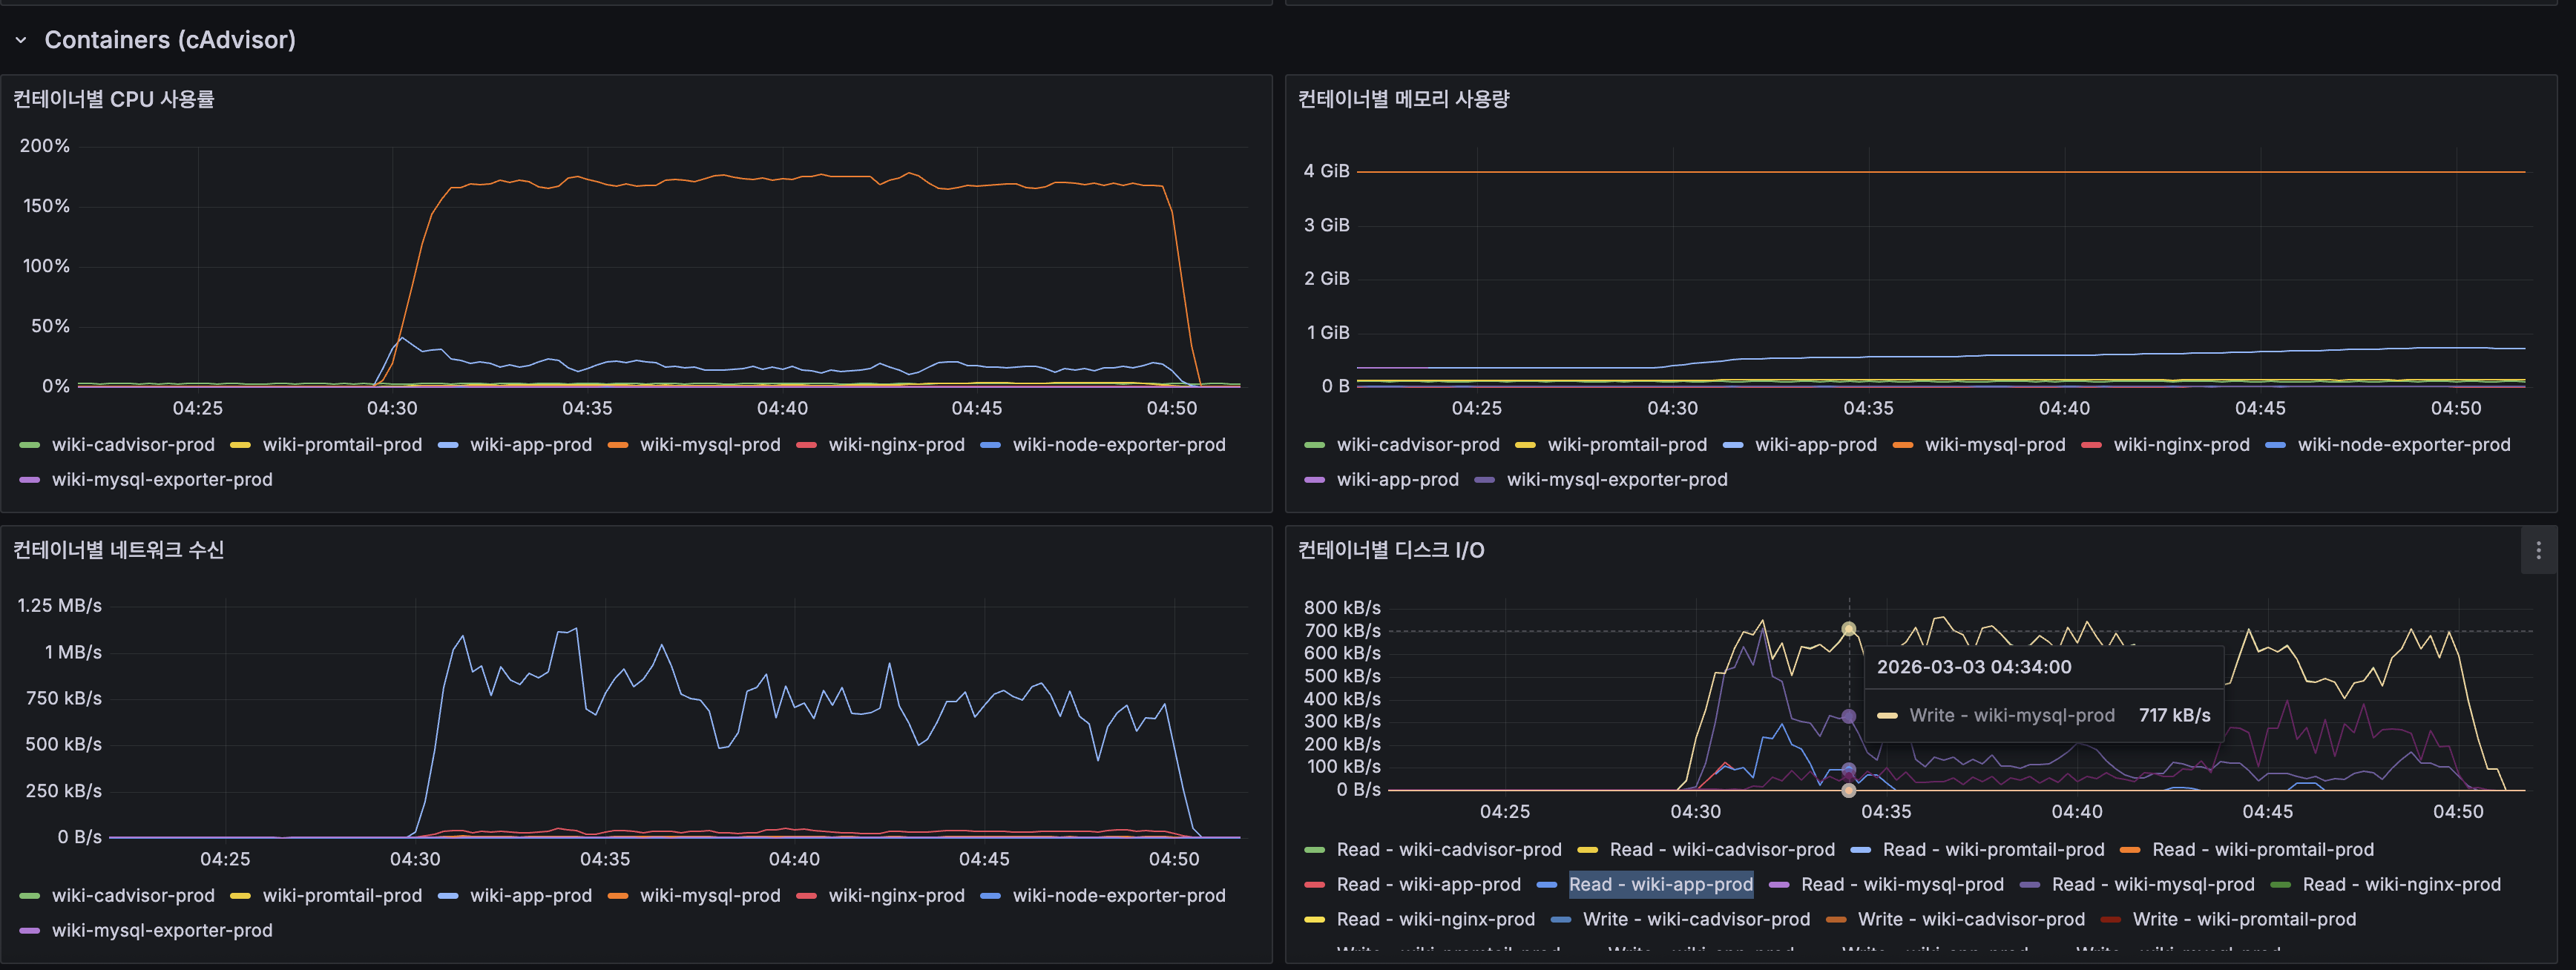
- wiki-mysql-prod와 wiki-app-prod 두 컨테이너가 같은 2코어 CPU를 놓고 경쟁
- MySQL 컨테이너 CPU가 150~200%까지 치솟음 (Docker의 CPU% = 코어 1개 기준, 2코어 중 거의 전부를 MySQL이 점유)
- App(Spring Boot) 컨테이너도 Lucene 검색 + HTTP 처리로 CPU 점유
4) Spring Boot HTTP 메트릭
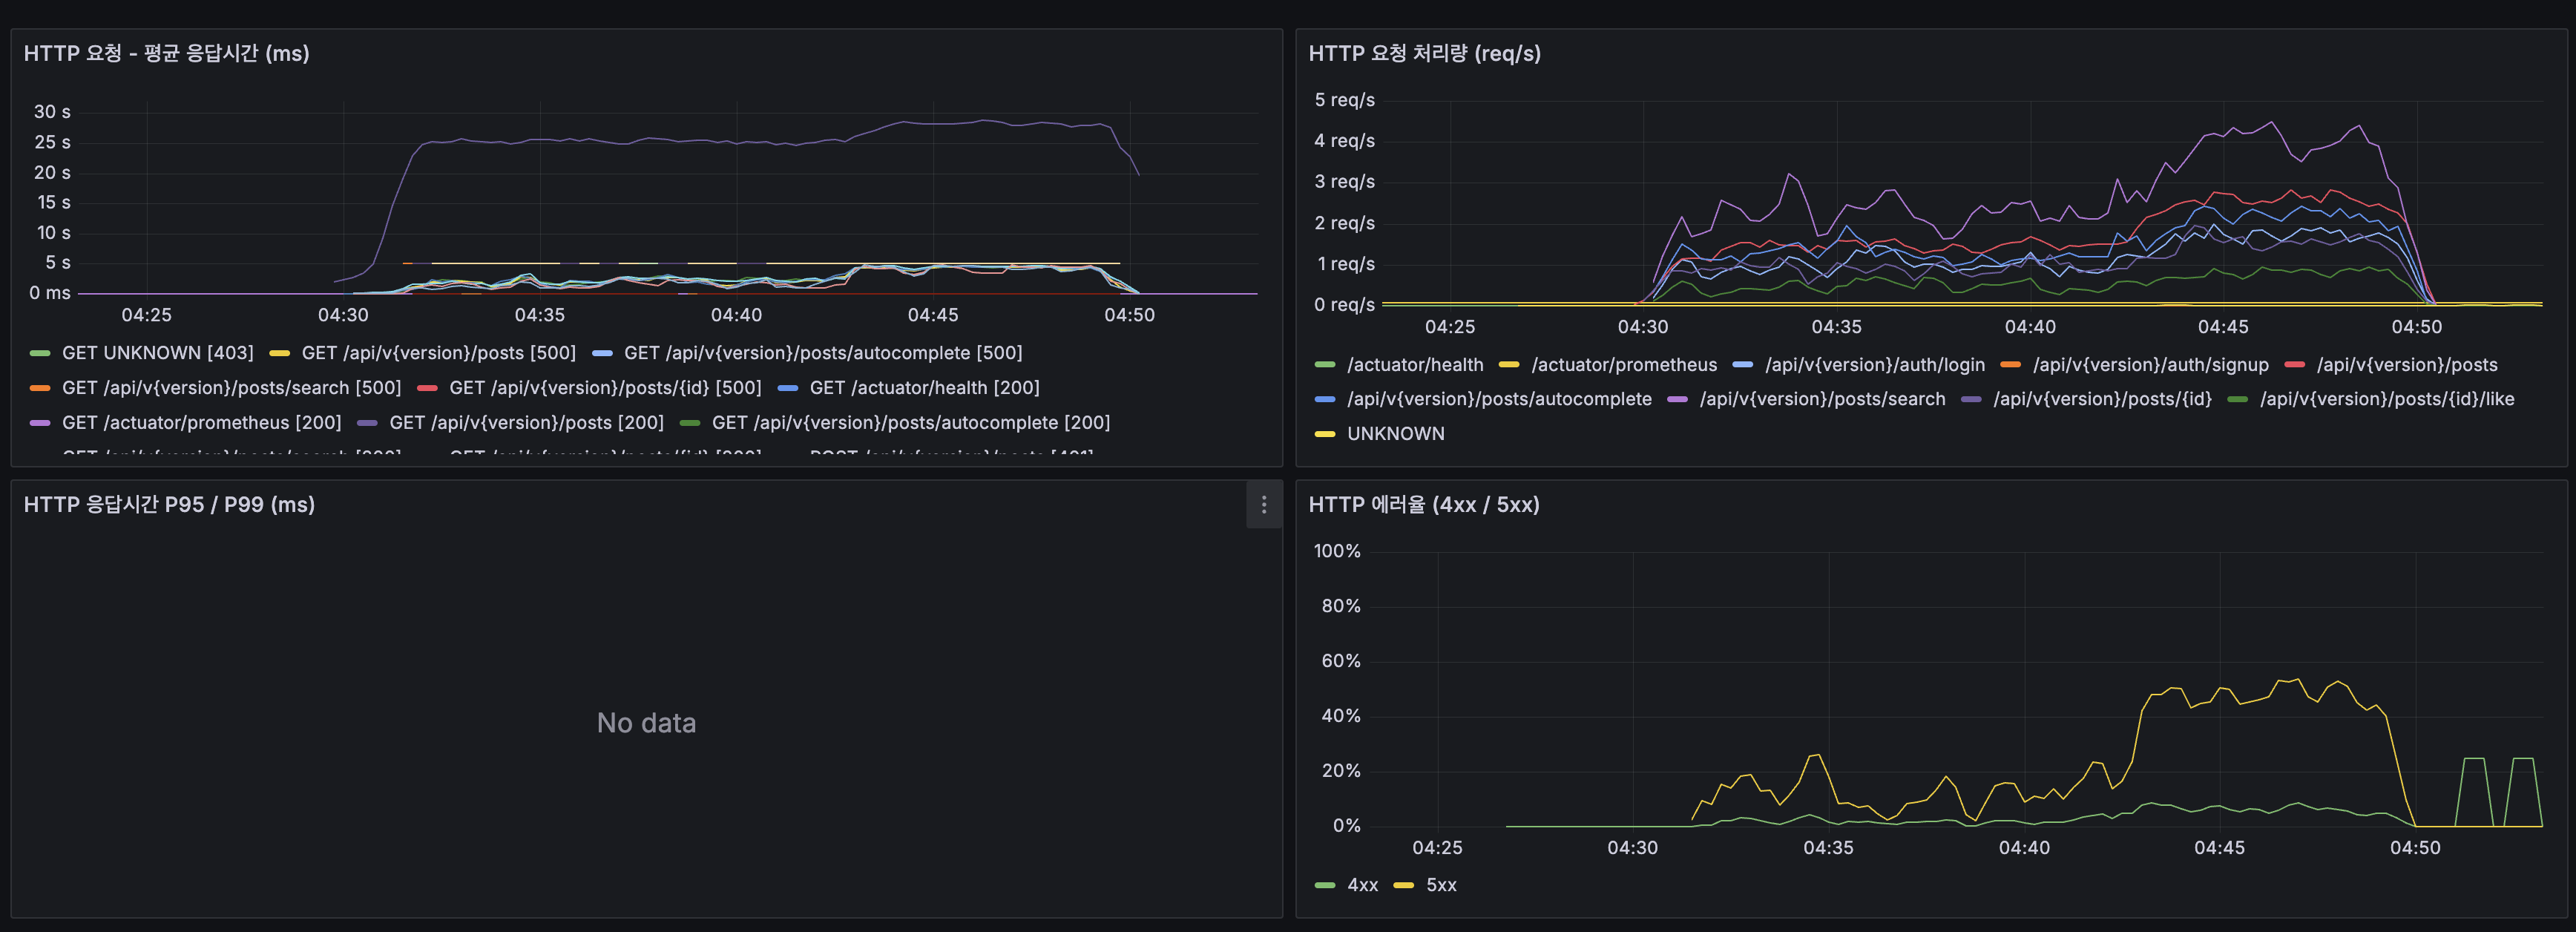
- 대부분의 엔드포인트가 500 에러를 반환. CPU 포화 → 요청 타임아웃 → 5xx
- 검색(
/posts/search)이 평균 25~30초로 가장 느림 /actuator/health만 정상 응답. 무거운 로직이 없어 CPU 대기 중에도 처리됨- 5xx 에러율이 초반 40%에서 후반 15~20%로 감소. VU ramp-up 완료 후 부하가 안정화되었지만 여전히 높음
5) JVM은 건강함: 병목이 아님
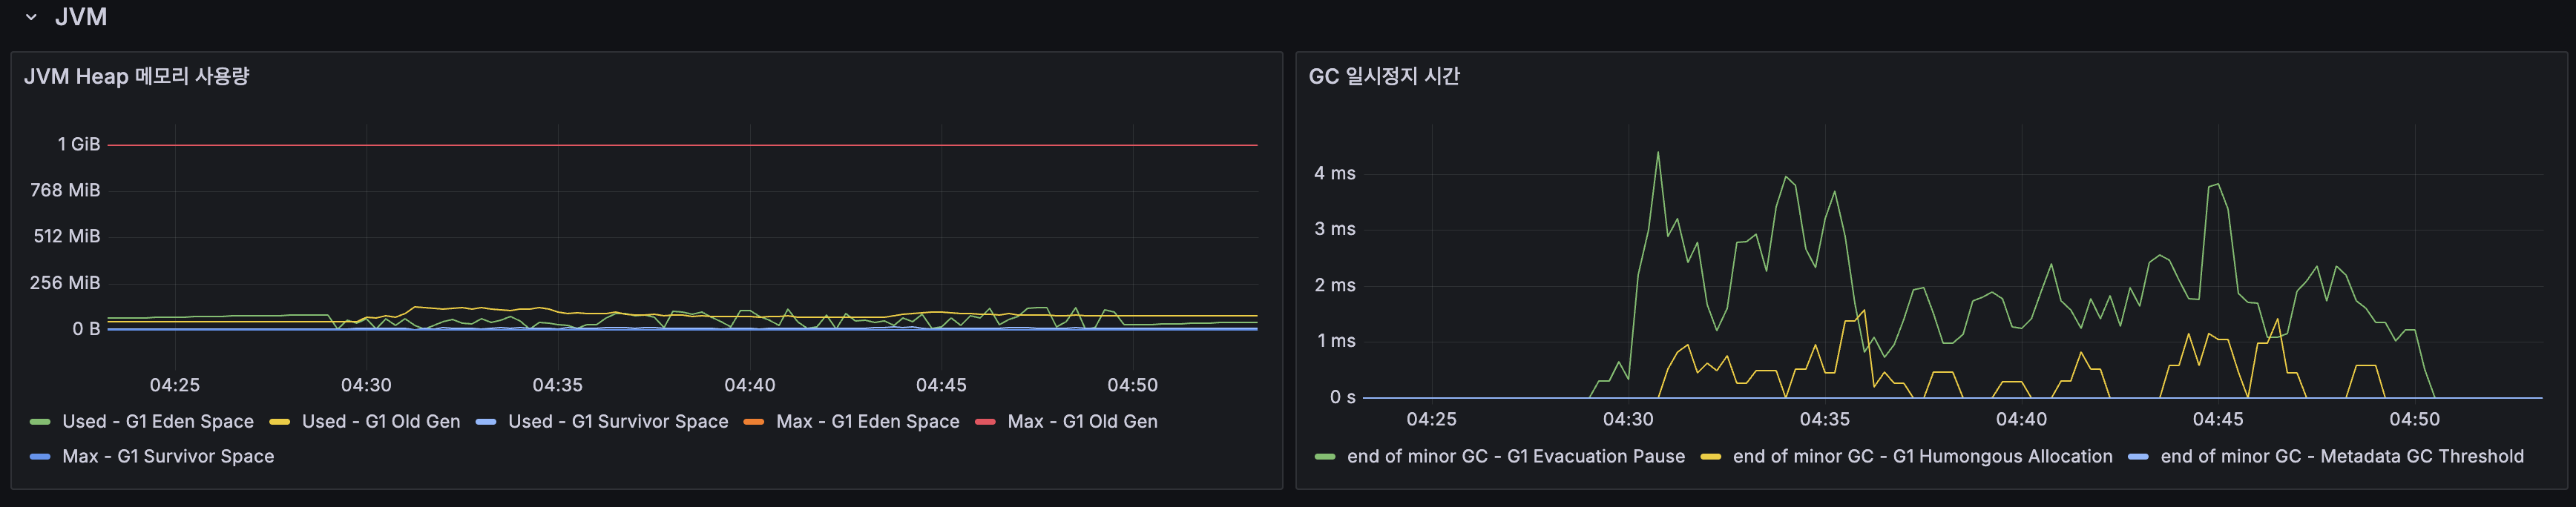
| JVM 지표 | 값 | 판정 |
|---|---|---|
| 힙 사용률 | ~256MB / 1GB (25%) | 정상 |
| GC Pause | 1~4ms (G1 Evacuation) | 정상 |
| G1 Old Gen | 거의 미사용 | Full GC 없음 |
JVM 힙은 여유롭고 GC pause도 무시할 수준입니다. 병목은 JVM 내부가 아니라 외부(CPU + MySQL)에 있습니다.
6) 인프라 전체 뷰
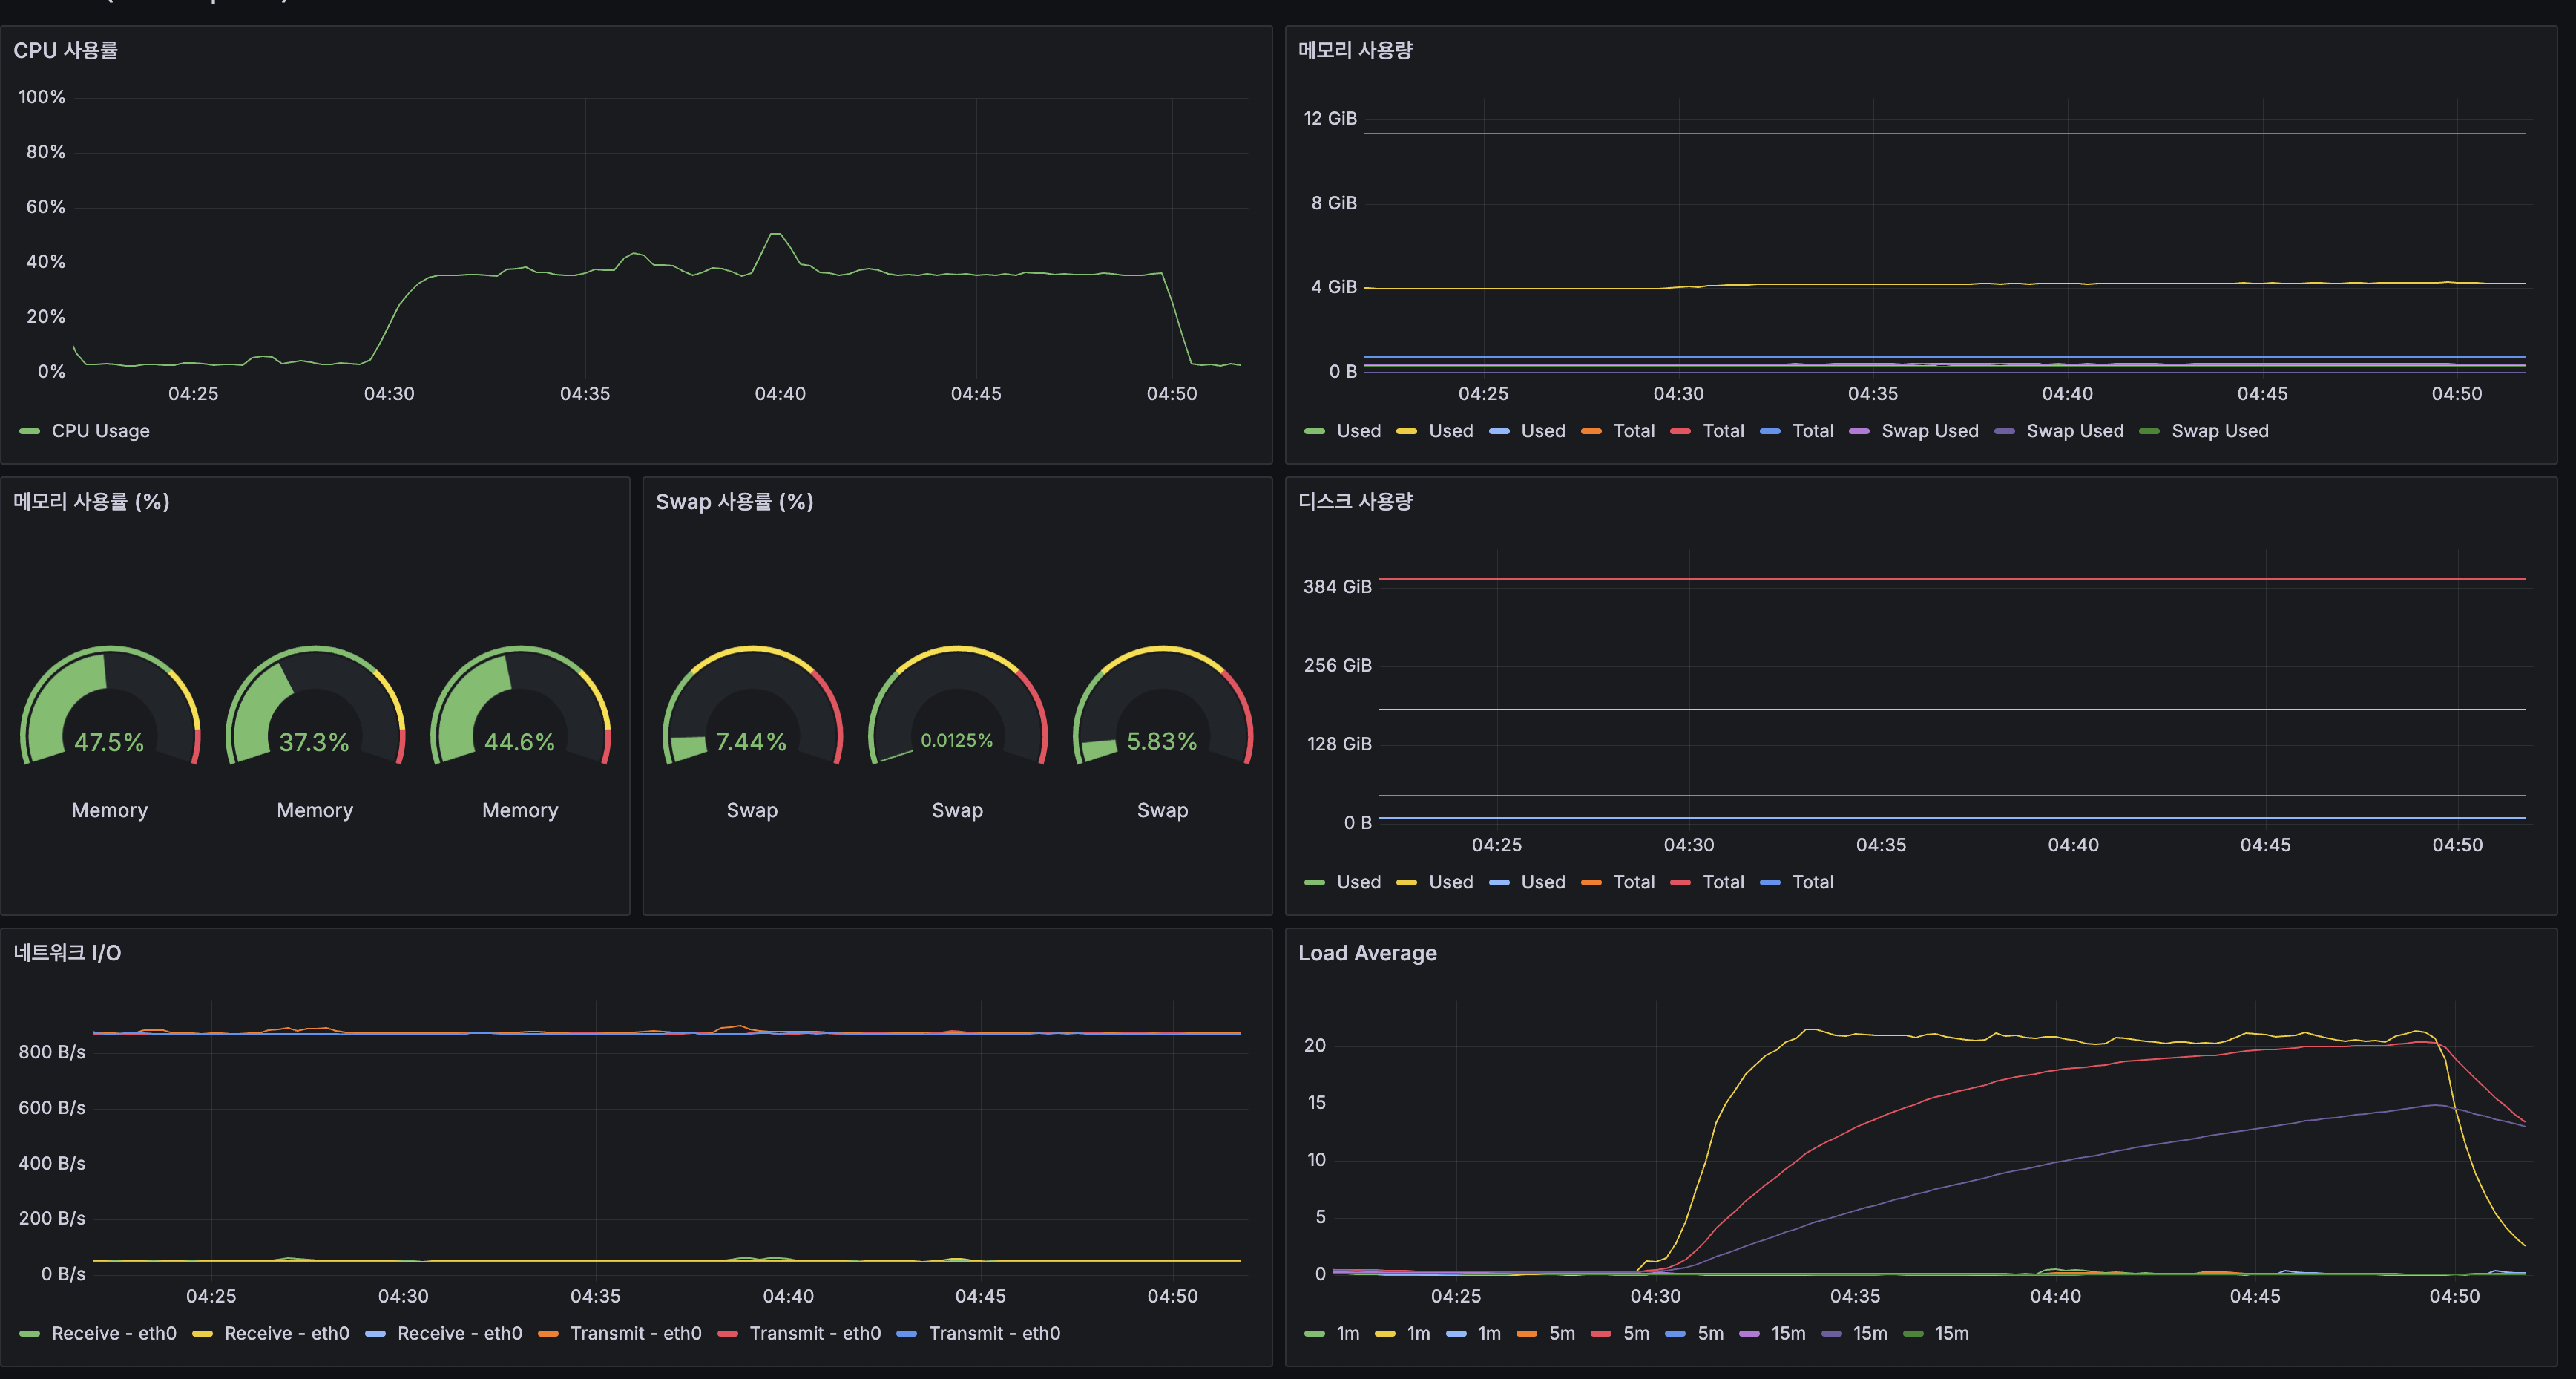
| 인프라 지표 | 앱 서버 | 해석 |
|---|---|---|
| CPU 사용률 | 피크 ~45% | 호스트 레벨(2코어 평균)에서는 여유로 보이지만, MySQL이 2코어 중 1.5~2코어를 점유 |
| 메모리 | 47.5% (12GB 중 ~5.7GB) | 충분한 여유. MySQL 4GB + App 2GB 제한으로 적절 분배 |
| Swap | 7.44% | 소량 사용, 큰 문제 아님 |
| Load Average (1m) | 20+ | 2코어 기준 LA 20 = 대기 큐에 18개 프로세스. 10배 과부하 |
Load Average 20은 “CPU에서 실행 대기 중인 프로세스가 20개”라는 뜻입니다. 이상적 LA는 코어 수 이하(≤2)이므로, 10배 과부하 상태였습니다.
근본 원인과 개선 방향
근본 원인: 2 OCPU(ARM, 12GB) 서버에 App + MySQL + Nginx + 모니터링 에이전트가 동거→ 100 VU 부하에서 CPU 포화 → 쿼리 지연 → 타임아웃 → 32% 에러
원인 체인: 최신 게시글 목록 조회의 deep OFFSET (OFFSET 20,000) → CPU-bound 인덱스 스캔 → 2코어 CPU 포화 (System CPU 100%, Load Average 20) → 같은 CPU를 쓰는 MySQL + App 전체 지연 (Slow Query 14.8K) → 검색·자동완성·상세까지 연쇄 지연 (66ms → 3,300ms) → Spring Boot 스레드 폭증 (20→120), 요청 타임아웃 → HTTP 500 에러 → k6 에러율 32.53%smoke(5 VU)에서 검색 66ms / 자동완성 25ms였던 것이 load(100 VU)에서 3,328ms / 3,339ms로 50배 이상 느려진 것이 핵심 증거입니다. InnoDB Buffer Pool 히트율 100%(디스크 I/O 0)임에도 Slow Query가 14.8K건 발생했고, 이는 메모리가 아닌 CPU가 병목임을 확정합니다.
이 수치가 이후 캐싱, 페이지네이션 개선, 스케일업 등 개선의 Baseline이 됩니다.
9. 다음 단계: 서버 증설 없이 해결할 수 있는가?
부하 테스트 결과만 보면 “서버가 부족하다”고 결론 내리기 쉽지만, 소프트웨어 최적화로 해결할 수 있는 여지가 큽니다.
현재 100 VU에서 CPU가 포화된 이유를 다시 보면:
- 같은 검색어를 여러 사용자가 입력해도 매번 Lucene + MySQL을 치고 있음 (캐시 없음)
- 최신 게시글 목록 조회 30%가 page 100~200 (OFFSET 2,000~4,000). 매 요청마다 CPU-bound 인덱스 스캔
- 검색, 자동완성, 목록, 쓰기가 2코어를 동시에 점유
캐시를 도입하면 반복 검색이 CPU를 사용하지 않으므로, 같은 2코어에서 훨씬 많은 요청을 처리할 수 있습니다.
개선 우선순위
1순위: Caffeine 로컬 캐시로 CPU 부하 직접 제거
| 캐시 대상 | TTL | 예상 효과 |
|---|---|---|
검색 결과 (/posts/search?q=...) | 5분 | 반복 검색 시 Lucene scoring + MySQL 완전 스킵 |
자동완성 (/posts/autocomplete?q=...) | 5분 | 키 입력마다 DB 조회 제거 |
최신 게시글 목록 조회 (/posts?page=N) | 1분 | 같은 페이지 반복 요청 시 OFFSET 스캔 제거 |
검색 쿼리는 Zipf 분포(소수의 인기 검색어가 트래픽 대부분)를 따르므로, 상위 1,000개 검색어만 캐싱해도 히트율 60%+ 가능. 캐시 히트 = CPU 사용 0.
왜 Caffeine인가: Caffeine은 내부적으로 Window TinyLfu 알고리즘을 사용한다. 전통적인 LRU 캐시는 한 번만 조회된 항목이 자주 조회되는 항목을 밀어낼 수 있지만, TinyLfu는 Bloom filter 기반 빈도 추정으로 “자주 검색되는 키워드”를 우선 유지한다. 검색 캐시처럼 Zipf 분포가 뚜렷한 워크로드에서 LRU 대비 히트율이 높다.
NRT(Near-Real-Time)와 캐시 무효화: 현재 글 생성 시 SearcherManager.maybeRefresh()로 Lucene 인덱스를 NRT 갱신하고 있다. 캐시 무효화는 TTL 기반으로 시작한다.
- TTL 5분이면 새 글이 검색 결과에 반영되기까지 최대 5분 지연
- 위키 특성상 실시간 반영보다 안정적 응답이 더 중요
- 이벤트 기반 무효화(
@CacheEvict)는 “어떤 검색어의 결과가 영향받았는지” 판별이 불가능하므로 TTL이 실용적 - Elasticsearch도 내부적으로 시간 기반 캐시 무효화를 사용한다
메시지 큐(Kafka 등)로 검색 요청을 비동기 처리하는 방식은 이 상황에 적합하지 않다. 검색은 동기적 응답이 필요한 작업이라 큐잉하면 사용자가 결과를 기다려야 한다. 메시지 큐가 맞는 경우는 비동기 처리 가능한 작업(글 생성 후 색인, 알림 발송 등)이다. CPU 포화의 핵심 해법은 “일 자체를 줄이는 것” → 캐시가 정답이다.
2순위: Tomcat 스레드풀 튜닝으로 context switching 감소
현재 application.yml에 Tomcat 스레드풀 설정이 없어 기본값 200 스레드가 적용된다. CPU-bound 워크로드에서 200 스레드는 과도하다.
Zalando Engineering과 Baeldung이 제시하는 스레드풀 공식:
최적 스레드 수 = CPU 코어 × (1 + 대기시간 / 서비스시간)CPU-bound 작업은 대기시간이 거의 0이므로 2 × (1 + 0) = 2가 이론적 최적이다. 실제로는 Lucene 검색 후 DB 조회(I/O 대기)가 있으므로 코어 수보다 높게 설정해야 하지만, 기본 200은 context switching만 유발한다.
k6 load 결과에서 JVM 스레드가 20 → 120으로 급증한 것이 이 문제의 증거다. LoadForge 가이드에서도 maxThreads를 CPU 코어의 2~4배 내로 유지하라고 권장한다.
server: tomcat: threads: max: 20 # 기본 200 → CPU-bound에 맞게 축소 min-spare: 4 # 코어 수 수준의 대기 스레드 accept-count: 100 # 모든 스레드가 사용 중일 때 OS 대기열 크기max 20은 보수적 시작점이다. 순수 CPU-bound라면 4~6이 적정이지만, 검색 → DB 조회(I/O 대기) → 응답 패턴에서 I/O 대기 중 다른 요청을 처리할 여유를 둔 값이다. Caffeine 캐시 적용 후 실측으로 조정한다.
3순위: HikariCP 커넥션 풀 검증
HikariCP 공식 Wiki가 인용하는 PostgreSQL 프로젝트의 공식:
connections = (core_count × 2) + effective_spindle_countcore_count: 물리 코어 수 (HyperThreading 제외)effective_spindle_count: 데이터가 완전히 캐시된 경우 0
현재 서버: 2 OCPU, InnoDB Buffer Pool 히트율 100% → (2 × 2) + 0 = 4. 현재 설정 DB_POOL_SIZE=10은 공식보다 크지만, HikariCP Wiki에서도 “작은 풀이 큰 풀보다 성능이 좋다”고 강조하며 Oracle의 실험에서 커넥션을 2,048 → 96으로 줄였을 때 응답시간이 100배 개선된 사례를 인용한다.
Tomcat 스레드를 20으로 줄이면 동시에 DB를 조회하는 스레드도 줄어들므로, 현재 pool size 10은 적정하다. 변경 후 hikaricp_connections_pending (Prometheus 메트릭)을 모니터링하여 커넥션 대기가 발생하면 조정한다.
4순위: 서버 스케일업
| 구성 | OCPU 비용 | 메모리 비용 | 월 합계 |
|---|---|---|---|
| 2 OCPU, 12GB (현재) | $14.60 | $13.14 | ~$28/월 |
| 4 OCPU, 24GB (스케일업) | $29.20 | $26.28 | ~$56/월 |
OCI A1 Flex 기준 OCPU $0.01/시간, Memory $0.0015/GB-시간. (Oracle 공식 가격)
참고: OCI Free Tier ARM은 3,000 OCPU-hours + 18,000 GB-hours/월 무료이므로, 4 OCPU 24GB(2,920 OCPU-hours + 17,520 GB-hours)는 무료 범위에 들어간다. 본 프로젝트는 Free Tier로 운영 중.AWS 비교: 동급 ARM(Graviton) t4g.xlarge(4 vCPU, 16GB)가 ~$98/월이므로 OCI가 약 절반 가격이다. (AWS EC2 Pricing)
CPU 2배(LA 20 → ~10)로 즉각적인 개선이 가능하지만, 1~3순위를 먼저 적용하지 않으면 4 OCPU에서도 동일한 문제가 더 높은 VU에서 재현된다.
5순위: 서버 측 최대 페이지 제한 + OFFSET 페이지네이션 유지 (코드 변경)
현재 k6 스크립트에서만 page 200으로 제한하고 있지만, 서버 API에는 제한이 없습니다. 서버 측에서 최대 페이지를 제한하면 OFFSET worst-case를 통제할 수 있습니다. Google 검색도 OFFSET + 최대 페이지 제한(약 30페이지) 방식을 사용하며, 페이지 번호 UI에서는 이 방식이 더 적합합니다.
Keyset Pagination(
WHERE id < :lastId)은 페이지 깊이와 무관하게 O(1) 성능이지만, 특정 페이지로 바로 이동할 수 없어 페이지 번호 UI와 맞지 않습니다. 무한 스크롤 UI를 도입할 때 재검토할 예정입니다.
개선 후 재측정 계획:
1. Caffeine 캐시 + Tomcat 스레드풀 + HikariCP 검증 → k6 load 재측정2. k6 메트릭을 빈도별 분리 (rare/medium/high 별도 Trend) → 캐시 효과 정밀 측정3. OCI 4 OCPU 스케일업 → k6 load 재측정4. 두 개선의 결합 효과 확인5. 새 병목이 발견되면 다음 단계 결정아직 불필요한 것
| 방안 | 필요 시점 |
|---|---|
| MySQL Replication (읽기 복제본) | 캐시 히트율이 높아도 쓰기가 읽기를 방해할 때 |
| App 스케일아웃 (다중 인스턴스) | 단일 인스턴스 + 4 OCPU로도 한계일 때 |
| Redis 분산 캐시 | 다중 인스턴스에서 캐시 일관성이 필요할 때 |
출처
가격 데이터:
- AWS OpenSearch Service Pricing (Seoul)
- AWS OpenSearch Instance Pricing — Vantage
- AWS EC2 Instance Pricing (r6g) — Vantage
- AWS EBS Pricing
- AWS MSK Pricing
- Elastic Cloud Pricing
- Elastic Cloud Pricing FAQ
- OpenAI API Pricing (Embeddings)
- Pinecone Pricing
BM25 / 스코어링:
- Which BM25 Do You Mean? A Large-Scale Reproducibility Study of Scoring Variants
- Practical BM25 — The BM25 Algorithm and its Variables (Elastic Blog)
- BM25 vs Lucene Default Similarity (Elastic Blog)
- Why Top Engineers Still Use BM25 (Minimalist Innovation)
기술 비교:
- Elasticsearch vs OpenSearch 2025 Update — BigData Boutique
- Benchmarking OpenSearch and Elasticsearch — Trail of Bits
- Lucene vs Elasticsearch — Capella Solutions
- Elasticsearch Hardware Requirements — Opster
- Vector Search: Lucene Is All You Need — arXiv:2308.14963
- MySQL Bug #85880
성능 최적화:
- Window TinyLfu — A Highly Efficient Cache Admission Policy (ACM)
- Tencent의 Lucene 캐싱 최적화 — Elastic Blog
- How to Set an Ideal Thread Pool Size — Zalando Engineering
- Configuring Thread Pools for Java Web Servers — Baeldung
- Optimizing Thread Pools for Tomcat — LoadForge
- About Pool Sizing — HikariCP Wiki (GitHub)
- Optimal Connection Pool Size — Vlad Mihalcea
Lucene 리소스 및 운영:
- Lucene’s RAM Usage for Searching — Mike McCandless
- Estimating Memory and Storage for Lucene/Solr — Lucidworks
- Use Lucene’s MMapDirectory on 64bit Platforms — Uwe Schindler (Lucene 커미터)
- Apache Solr Memory Tuning for Production — Cloudera
- Nori: The Official Elasticsearch Plugin for Korean — Elastic
- LUCENE-8231: Nori Korean Analyzer — Apache JIRA
- NRT Readers with SearcherManager — Mike McCandless
- Lucene CorruptedIndexException — Elastic Labs
- Apache Lucene Migration Guide
- Solr & Lucene in Production: Hidden Risks, Real Costs — HeroDevs
현업 사례:
- Twitter’s New Search Architecture (2010)
- How Twitter Uses Apache Lucene — Lucidworks
- LinkedIn’s Galene Search Architecture — Lucidworks
- NHN FORWARD 22 — Elasticsearch를 이용한 상품 검색 엔진
- 오늘의집 — 데이터 엔지니어의 좌충우돌 검색 개발기
- Debezium CDC Pain Points — Estuary
- Companies Using Apache Lucene — Enlyft
- Uber — Lucene: Indexing and Search at Scale
- Uber — Lucene Version Upgrade at Scale
- Atlassian — Troubleshoot Lucene Index Corruption in Jira
- Atlassian — How to Rebuild the Index in Jira
- LinkedIn Engineering — Did You Mean “Galene”?
Previous Post Summary
In FULLTEXT ngram Index, we applied MySQL FULLTEXT ngram index to resolve search timeouts (timeout -> 6ms).
Search transitioned from “not working” to “working,” and title + body search became possible.
1. Normal State — Search Was Working
After completing the previous post, the FULLTEXT ngram index was working for 570K Korean documents (Namuwiki).

The server is an Oracle Cloud ARM instance (2 vCPU, 12GB RAM), Always Free tier with $0/month operating cost.
MySQL, Spring Boot, and Nginx run on this single machine, while the monitoring stack (Prometheus + Grafana + Loki) is separated across two AMD instances (1 vCPU, 1GB each).
Looking at search results, rare keywords like “Vettel” returned results in 23ms (recorded as 6ms in the previous post, but re-measured at 23ms under server load).
On the surface, search appeared to be working well.
2. Problem Recognition — “Working” and “Usable” Were Different
Three problems emerged from what appeared to be normal search.
2-1. High-Frequency Token Timeout
“Vettel” finishes in 6ms, but searching for “daehan” (a common Korean word) exceeded 5 seconds and timed out.
| Query | Matching Documents | Response Time |
|---|---|---|
| ”Vettel” | 406 | 23ms |
| ”Korea” | 196,593 | 281ms |
| ”daehan” | 196,000+ | 5s+ timeout |
“daehan” is a common word in wikis. From the user’s perspective, if searching for “Republic of Korea” triggers a timeout, that search function is unusable.
2-2. Full 14.77M Row Indexing Impossible
The FULLTEXT ngram index was only applied to 570K Korean documents.
When attempting to create an index for all 14.77M rows including English Wikipedia, the disk filled up at the 85-minute mark.
Including temporary sort files, 300GB+ was needed, which exceeded the server’s available disk space (253GB).
Since the index could not be created, 14.2M English documents were completely excluded from search.
2-3. Search Quality — False Positives
Searching for “Korean language” returned “Incheon International Airport” mixed into results.
Because ngram creates “Korea” and “language” as independent tokens, documents containing only “Korea” also matched.
The lack of morphological analysis also meant “Republic of Korea” with different suffixes was treated as different search terms.
Combining these three issues, search was working but not at a usable level in practice.
3. Problem Analysis — Why It Cannot Be Solved in MySQL
The technical analysis in this section (InnoDB FTS internal architecture,
fts0que.ccsource code analysis, query mode comparison, mitigation review) was covered in detail in previous post (FULLTEXT ngram Index) section 6.
Here we summarize only the essentials needed for the Lucene migration decision.
3-1. High-Frequency Token Timeout Is a Limitation of MySQL’s Internal Algorithm
ngram splits “daehanminguk” (Republic of Korea) into 3 tokens: “daehan”, “hanmin”, “minguk”.
“daehan” is a high-frequency token appearing in 196K out of 570K documents.
The bottleneck was the InnoDB FTS engine sequentially scanning the posting list of these 196K documents.
Core rationale for Lucene migration — N:M posting list explosion:
The difference between ngram and morphological analyzers diverges at the token:document mapping relationship.
The problem with ngram is not simply “too many tokens.”
A single token (“daehan”) matches documents unrelated to the original search term (“Republic of Korea”) — like “Korean Air” or “Daehan Construction” — causing posting list explosion, and then the exploded lists must be intersected, creating a double cost.
Nori processes “Republic of Korea” as a single semantic unit, so this problem simply does not exist.
In MySQL Bug #85880, the reporter proposed a patch achieving 750,000x improvement, but Oracle has not merged it for 9 years since 2017.
Parameter tuning (innodb_ft_result_cache_limit, ngram_token_size, custom stopwords) was all reviewed, but the only trade-off was “search for that keyword becomes completely impossible.” (Detailed analysis: previous post section 6-3)
3-2. Index Size Explosion Is Inherent to Row-Oriented Storage
MySQL (InnoDB) uses row-oriented storage, so even FULLTEXT index creation that only needs the content column must read entire rows (122GB) from disk.
Adding temporary sort files (~122GB), 300GB+ was needed. (Detailed analysis: previous post section 6-5)
3-3. MySQL Does Not Support Morphological Analysis
MySQL 8.0’s FULLTEXT only supports ngram (character n-gram) and MeCab (Japanese).
There is no Korean morphological analyzer. No third-party plugins exist either.
3-4. Spending More Money Would Not Solve It
What if we could spend more? Expanding disk to 500GB would allow index creation, but high-frequency token timeouts and false positives cannot be solved no matter how much disk is added.
This is not a cost problem but a technical limitation. We must move outside MySQL.
4. Learning Process — Investigating Alternative Technologies
There were broadly four technologies that could provide search outside MySQL.
| Technology | Core | Representative Products |
|---|---|---|
| Embedded Lucene | Run inverted index directly inside app JVM | Apache Lucene (Java library) |
| Distributed Search Engine | Dedicated search cluster | Elasticsearch, OpenSearch |
| Managed Search SaaS | Cloud-hosted | Elastic Cloud, AWS OpenSearch Service |
| Vector DB | Embedding-based similarity search | Pinecone, Milvus, Weaviate |
We investigated each of these four. The evaluation criteria were two:
(1) Can it solve MySQL’s three limitations?
(2) What is the cost structure?
4-1. Lucene Investigation
Lucene is Apache Foundation’s Java search library.
Almost all search engines including Elasticsearch, OpenSearch, and Solr use Lucene internally.
Adding one dependency line to build.gradle runs it in the same JVM as the app. No separate server needed.
implementation 'org.apache.lucene:lucene-core:10.2.1' // Latest: 10.4.0 (2026.02, 10~35% query performance improvement)implementation 'org.apache.lucene:lucene-analysis-nori:10.2.1'How it solves MySQL’s three limitations:
| MySQL ngram Limitation | Lucene’s Solution |
|---|---|
| High-frequency token timeout | Nori morphological analyzer — processes “Republic of Korea” as 1 token. The high-frequency 2-gram “daehan” is never generated |
| Index 300GB+ (creation impossible) | Token count is 20~30% of ngram with morphological analysis. Estimated 10~30GB for all 14.77M rows |
| False positive, no morphological analysis | Nori removes endings/particles. “Republic of Korea” + suffix -> “Republic of Korea”. “Incheon International Airport” does not match the “Republic of Korea” token |
Trade-off — when precision goes up, recall goes down:
Switching to Nori means “Incheon International Airport” disappearing from “Korean language” search results is a precision improvement.
But when searching for “daehan”, ngram matches “Republic of Korea”, “Korean Air”, “Daehan Construction” all, while Nori only returns documents where “daehan” was analyzed as an independent morpheme.
That is, recall may decrease.
For wiki search, we determined that it is natural for users to type “Republic of Korea” to find “Republic of Korea”, and that precise results are better than having irrelevant documents mixed in.
This is a choice prioritizing precision.
Resource requirements (15M documents, single node):
Initially, comparing only JVM heap led us to think “Lucene only needs 1~4GB RAM.”
This is because most Lucene blog posts only mention heap size.
But after finding on Lucene committer Uwe Schindler’s blog that OS page cache must be included, our thinking changed.
Lucene uses MMapDirectory to memory-map index files.
It uses OS page cache, not JVM heap.
Lucene committer Uwe Schindler’s recommendation: “Allocate only 1/4 of total RAM to JVM heap, and leave the remaining 3/4 for OS page cache.”
Source: Uwe Schindler — Use Lucene’s MMapDirectory on 64bit Platforms
That is, with 4GB JVM heap, total system RAM of 16GB is needed. This allows 12GB to remain as page cache to cache hot regions of index files (10~30GB).
If page cache is insufficient, disk I/O occurs and search latency spikes.
| Resource | Embedded Lucene | Elasticsearch/OpenSearch |
|---|---|---|
| CPU | 2 vCPU | 2~4 vCPU |
| JVM Heap | 2~4GB (search) / 4~8GB (including indexing) | 8~16GB |
| OS Page Cache | Recommended equal to index size (10~30GB) | Same |
| Total System RAM | 8~16GB (minimum) / 16~24GB (recommended) | 16~32GB |
| Disk | 10~30GB (SSD recommended) | 10~30GB + logs/metadata |
| CDC (Data Sync) | Not needed | Debezium + Kafka or app-level sync |
| Network Overhead | None (in-process) | HTTP round-trip 2~10ms/query |
Source: Lucidworks — Estimating Memory and Storage for Lucene/Solr, Cloudera — Apache Solr Memory Tuning for Production
The Nori dictionary is approximately 25~30MB with FST (5.4MB) + connection cost matrix (~20MB, off-heap direct buffer).
At the 15M document scale, the index structure itself dominates memory, so Nori’s additional overhead is negligible.
Source: Elastic Blog — Nori: The Official Elasticsearch Plugin for Korean, LUCENE-8231
In terms of total system RAM, the difference between Lucene (8~24GB) and Elasticsearch (16~32GB) is approximately 1.3~2x.
Initially writing “4~8x difference” was because only JVM heap was compared; including OS page cache narrows the gap.
However, Elasticsearch’s distributed layer (REST/Netty, cluster coordination, shard management) still consumes additional RAM.
Converting this resource difference to AWS EC2 (Seoul):
| Technology | Required Specs | Corresponding Instance | Monthly Cost |
|---|---|---|---|
| Lucene (minimum) | 2 vCPU, 8GB RAM | r6g.medium | ~$44 |
| Lucene (recommended) | 2 vCPU, 16GB RAM | r6g.large | ~$87 |
| Elasticsearch (minimum) | 2 vCPU, 16GB RAM | r6g.large | ~$87 |
| Elasticsearch (recommended) | 4 vCPU, 32GB RAM | r6g.xlarge | ~$174 |
Lucene is a library, so it can be included in the app server JVM.
If the app server has sufficient RAM, it can run without a separate server.
Elasticsearch can also run on the same server, but since JVM heap alone requires 8~16GB, coexisting with the app requires a 32~48GB server.
Limitations:
Search is only available on a single JVM. Horizontal scaling is not possible.
However, Lucene can handle 100~250 million documents on a single node.
14.77M documents are within this range. There is no REST API, but Spring Boot already provides the API.
4-2. Elasticsearch / OpenSearch Investigation
Elasticsearch and OpenSearch are search engines that add a distributed layer on top of Lucene.
OpenSearch was forked by AWS from Elasticsearch 7.10.2 in 2021; the core search engine (Lucene) is identical.
The differences are licensing (Elasticsearch: SSPL + ELv2 + AGPL v3 triple license, OpenSearch: Apache 2.0) and supplementary features (ML, security, etc.).
Elastic added AGPL v3 in September 2024, returning to OSI-certified open source.
Source: Elasticsearch vs OpenSearch 2025 Update — BigData Boutique, Benchmarking OpenSearch and Elasticsearch — Trail of Bits
Search quality is identical to Lucene.
It uses the same Nori analyzer and the same BM25 scoring.
The difference is infrastructure cost.
According to the Elasticsearch official hardware guide (Opster), indexing 15M documents requires at minimum JVM heap 8~16GB, total RAM 16~32GB.
It can be placed on the same server, but server RAM must be correspondingly large. Co-locating with app + DB + monitoring requires a 32~48GB server.
We checked the AWS OpenSearch Service pricing (Seoul, ap-northeast-2):
| Instance | vCPU | RAM | Monthly Cost |
|---|---|---|---|
| t3.small.search | 2 | 2 GiB | ~$41 (~58,000 KRW) |
| t3.medium.search | 2 | 4 GiB | ~$82 (~117,000 KRW) |
| m6g.large.search | 2 | 8 GiB | ~$114 (~162,000 KRW) |
| r6g.large.search | 2 | 16 GiB | ~$148 (~211,000 KRW) |
To index 15M documents, at minimum two t3.medium instances (development, single AZ) are needed.
Adding 100GB gp3 EBS storage brings the monthly total to ~$173 (~246,000 KRW).
For production, Multi-AZ + dedicated master nodes brings it to ~$455 (~647,000 KRW)/month.
Source: AWS OpenSearch Instance Pricing — Vantage, AWS EBS Pricing
Elastic Cloud pricing starts at ~$99/month for the Standard tier, but that is for 120GB storage / 2 AZ.
For actual production configuration with 15M documents, it exceeds $500/month.
A ~30% price increase for production workloads occurred in January 2025.
4-3. Data Synchronization Cost — The Hidden Cost of Elasticsearch/OpenSearch
This is not the end. Since MySQL and Elasticsearch are separate systems, data synchronization is required.
When a post is INSERTed into MySQL, it must also be sent to Elasticsearch.
The most common approach is CDC (Change Data Capture).
MySQL -> Debezium -> Kafka -> Elasticsearch Connector -> ElasticsearchLooking at AWS MSK (Managed Kafka) pricing, minimum HA configuration (3x kafka.m5.large) is ~$259/month.
Adding MSK Connect (Debezium connector) is ~$80/month. The CDC pipeline alone is ~$339/month.
Synchronization can also be done directly from the app without CDC.
But if Elasticsearch indexing fails after a MySQL transaction commits, data becomes inconsistent.
“A document was edited but not reflected in search” situations occur.
Embedded Lucene does not have this problem.
Since PostService.create() handles both MySQL INSERT and Lucene indexing within the same process, cross-system synchronization issues fundamentally do not arise.
Elasticsearch/OpenSearch total cost:
| Configuration | Search Engine | CDC | Total |
|---|---|---|---|
| Minimum (Development) | ~$173 | ~$80 (app-level or MSK Serverless) | ~$253 (~360,000 KRW/month) |
| Production (HA) | ~$455 | ~$339 | ~$794 (~1,130,000 KRW/month) |
4-4. Vector DB Investigation
We had already concluded that using a vector DB alone is unsuitable for wiki keyword search.
Searching for “Republic of Korea” returns “Korea”, “Corea”, “Seoul” mixed in, and precise keyword matching does not work.
We also investigated costs.
To convert all 14.77M documents to vectors, embeddings must first be generated.
With wiki documents averaging 6,586 characters (~2,000 tokens):
From the OpenAI API pricing:
| Model | Price/1M Tokens | Cost for 14.77M x 2,000 tokens |
|---|---|---|
| text-embedding-3-small | $0.02 | ~$590 (~840,000 KRW) |
| text-embedding-3-large | $0.13 | ~$3,835 (~5,460,000 KRW) |
Embedding generation alone costs at minimum 840,000 KRW.
Embeddings must be regenerated whenever documents are modified, incurring ongoing API costs.
Pinecone pricing shows Serverless starting at $50+/month.
Self-hosted Milvus has EC2 costs of $500~$1,000/month.
And since vector search alone cannot perform exact keyword matching, using a hybrid (BM25 + vector) approach requires Lucene or Elasticsearch anyway.
It is a structure that only adds cost.
4-5. What Choices Were Made in Industry?
Before choosing a technology, we investigated what technologies are actually used in production.
Companies using embedded Lucene directly:
| Company | Scale | Usage |
|---|---|---|
| Twitter (X) | Hundreds of millions of tweets/day | Earlybird — custom in-memory posting list built on Lucene. Migrated from MySQL search |
| 300M+ profiles | Galene — uses Lucene as the indexing layer | |
| Atlassian (Jira/Confluence) | Enterprise wiki | Search implemented with embedded Lucene |
Source: Twitter’s New Search Architecture (2010), How Twitter Uses Apache Lucene (Lucidworks), LinkedIn’s Galene Search Architecture (Lucidworks)
The Twitter case was interesting. The motivation for migrating from MySQL-based search to Lucene is identical to this project — structural limitations of MySQL search.
Korean companies:
| Company | Technology | Context |
|---|---|---|
| NHN | Elasticsearch | NHN FORWARD 22 — product search engine. Multiple services share search indexes |
| Ohouse | Elasticsearch + direct Lucene tuning | Directly tuned Lucene segment count for performance improvement |
| A Korean commerce company | Elasticsearch on K8s | Operating ES cluster on Kubernetes |
Most large Korean companies use Elasticsearch.
But they share a commonality — multiple teams and services share search indexes.
This is a different situation from providing search within a single app.
Ohouse uses Elasticsearch but went down to the Lucene segment level for tuning.
This means that without understanding Lucene, Elasticsearch tuning also has limits.
Source: NHN FORWARD 22 — Product Search Engine with Elasticsearch, Ohouse — A Data Engineer’s Search Development Story
5. Application — Why Embedded Lucene
5-1. Full Cost Comparison Summary
We converted the resources needed for 15M document search by technology.
The comparison criteria were how much server resources are consumed to deliver the same search quality and how much hidden cost exists beyond server costs.
Search infrastructure resource requirements:
| Technology | CPU | Total System RAM | Disk | CDC |
|---|---|---|---|---|
| Embedded Lucene | 2 vCPU | 8~24GB (heap 2~8GB + page cache) | 10~30GB | Not needed |
| Elasticsearch/OpenSearch | 2~4 vCPU | 16~32GB (heap 8~16GB + page cache) | 10~30GB | Required |
| Vector DB | - | - | ~90GB | Required + Embedding API |
Monthly server cost converted to AWS EC2:
| Technology | Server Spec | EC2 Equivalent | CDC Cost | Monthly Total |
|---|---|---|---|---|
| Embedded Lucene (minimum) | 2 vCPU, 8GB | ~$44 (r6g.medium) | Not needed | ~$44 |
| Embedded Lucene (recommended) | 2 vCPU, 16GB | ~$87 (r6g.large) | Not needed | ~$87 |
| ES/OS self-hosted (minimum) | 2 vCPU, 16GB | ~$87 (r6g.large) | ~$0~80 | ~$87~167 |
| ES/OS self-hosted (recommended) | 4 vCPU, 32GB | ~$174 (r6g.xlarge) | ~$0~80 | ~$174~254 |
| AWS OpenSearch (development) | Managed | ~$173 | ~$80 | ~$253 |
| AWS OpenSearch (production) | Managed (HA) | ~$455 | ~$339 | ~$794 |
| Elastic Cloud (Standard) | Managed | ~$99~500 | ~$80~339 | ~$179~839 |
| Vector DB (Pinecone) | Managed | ~$50+ | Embedding $590+ | ~$640+ |
Looking at server costs alone, the difference between Lucene (~$44~87) and ES self-hosted (~$87~174) is 1~2x.
It is not “4~8x difference.”
Comparing only JVM heap makes it look that way, but including OS page cache narrows the gap.
Lucene’s server cost advantage over ES is $0~130/month.
But server cost is only part of the total cost.
CDC (~$80~339) and operational complexity (explained in the next section) must be included for a fair comparison.
5-2. Decision Rationale
| Criterion | Lucene | Elasticsearch/OpenSearch | Vector DB |
|---|---|---|---|
| High-frequency token resolution | Resolved (Nori morphological analysis) | Resolved (same Lucene) | N/A |
| Full indexing | 10~30GB (feasible) | 10~30GB (feasible) | ~90GB + embedding cost |
| False positive | Resolved (morphological analysis) | Resolved (same Lucene) | Unsuitable for keyword search |
| Search infra (total system RAM) | 8~24GB (~$44~87/month) | 16~32GB (~$87~794/month) | Managed $50~1,000+/month |
| CDC | Not needed | Required (~$80~339/month) | Required |
| Operational complexity | Manage app only | App + ES + CDC | App + Vector DB + Embedding API |
Elasticsearch’s core value of distributed processing is not needed.
14.77M documents are within Lucene’s recommended single index range (100~250M documents/node).
Operating a distributed system when distribution is not needed only adds cost.
5-2-1. Cost Summary — RAM Determines Cost
Embedded Lucene requires total system RAM of 8~16GB (JVM heap 2~4GB + page cache).
Elasticsearch requires 16~32GB (JVM heap 8~16GB + page cache).
This RAM difference directly translates to hosting cost difference:
| Configuration | Required RAM | Server Cost | CDC Cost | Monthly Total |
|---|---|---|---|---|
| Embedded Lucene (minimum) | 8GB | ~$44 | Not needed | ~$44 |
| Embedded Lucene (recommended) | 16GB | ~$87 | Not needed | ~$87 |
| ES self-hosted (minimum) + CDC | 16GB | ~$87 | ~$80 | ~$167 |
| ES self-hosted (recommended) + CDC | 32GB | ~$174 | ~$339 | ~$513 |
| AWS OpenSearch (development) + CDC | Managed | ~$173 | ~$80 | ~$253 |
| AWS OpenSearch (production HA) + CDC | Managed | ~$455 | ~$339 | ~$794 |
On the current server (Oracle Cloud Free Tier, 12GB RAM), Lucene (heap 2GB + page cache) is tight but can be embedded.
Elasticsearch requires JVM heap alone of 8~16GB, exceeding the server’s total RAM, making a separate server mandatory.
That is, Lucene costs $0 extra, ES adds $167~794/month.
Search quality (Nori + BM25) is identical.
Because they use the same Lucene engine.
The difference is purely RAM requirement -> hosting cost -> operational complexity.
5-3. Embedded Lucene vs Elasticsearch — Performance Difference Is Cost Difference
Search quality (Nori + BM25) is identical.
Both use the same Lucene engine.
The difference lies in the overhead incurred during query processing.
Query processing path comparison:
[Elasticsearch] Client -> JSON serialization -> HTTP transmission (1~5ms) -> ES node receives -> JSON deserialization -> Shard routing -> Lucene search -> JSON serialization -> HTTP response -> Client deserialization (Per-query overhead: 2~10ms)
[Embedded Lucene] App code -> IndexSearcher.search() -> Java object returned (Per-query overhead: ~0ms -- method call within the same JVM)JVM heap breakdown comparison:
| Item | Elasticsearch | Embedded Lucene |
|---|---|---|
| Search engine (Lucene core) | 4~8GB | 2~4GB (included in app JVM) |
| REST layer (Netty) | ~500MB | None |
| Cluster coordination | ~200MB~1GB | None |
| JVM Heap Total | 8~16GB | 2~4GB |
| + OS Page Cache (index caching) | +8~16GB | +6~12GB |
| Total System RAM | 16~32GB | 8~16GB (minimum) / 16~24GB (recommended) |
Looking only at JVM heap shows a 4~8x difference, but total system RAM including page cache shows a 1.3~2x difference.
The gap narrows.
However, Elasticsearch’s distributed layer (Netty, cluster) heap consumption is purely wasted resources — providing zero value on a single node.
Server cost conversion:
| Item | Elasticsearch | Embedded Lucene | Difference |
|---|---|---|---|
| Search server (minimum) | r6g.large 2vCPU/16GB (~$87/month) | r6g.medium 2vCPU/8GB (~$44/month) | $43/month |
| Search server (recommended) | r6g.xlarge 4vCPU/32GB (~$174/month) | r6g.large 2vCPU/16GB (~$87/month) | $87/month |
| CDC pipeline | Debezium + Kafka (~$80~339/month) | Not needed | $80~339/month |
| Monthly difference (minimum) | $123~382/month | ||
| Monthly difference (recommended) | $167~426/month | ||
| Annual difference | $1,476~$5,112 (~2.1M~7.27M KRW) |
Including Lucene in the app server further reduces server costs, but the app server must have sufficient RAM.
On the current server (12GB), MySQL (InnoDB buffer pool 2GB) + Spring Boot + Nginx + monitoring agents use about 5~6GB, so Lucene heap 2GB + page cache can be handled within the remaining 6~7GB.
Tight but workable.
Elasticsearch heap 8~16GB exceeds the server’s total RAM (12GB), so it simply cannot run.
Throughput difference — more requests processed on the same hardware:
Assuming a query in Elasticsearch takes Lucene search 5ms + HTTP/serde overhead 5ms = total 10ms.
Embedded Lucene takes only 5ms of pure search.
Theoretically, 2x the search QPS can be handled on the same server.
While searching “daehan” takes 5+ seconds in MySQL ngram, occupying CPU and I/O for that connection,
if the same search finishes in a few ms with Lucene Nori, that CPU time can be used for other requests.
Even as search traffic grows, the point at which the server needs to be scaled up is pushed back.
This is the long-term cost advantage.
5-4. If Lucene Is Cheaper, Why Use Elasticsearch — Costs Not Captured in Server Bills
Looking at server costs alone, Lucene is cheaper than ES.
But if that were everything, every company would use embedded Lucene.
In reality, that is not the case. There are reasons to use ES.
1) Disaster Recovery: Lucene Has No Replicas
Elasticsearch automatically promotes a Replica when a Primary Shard dies.
It works without code. With Lucene, if the app server dies, the index dies with it.
If the index is corrupted, the CheckIndex tool can recover it, but corrupted documents are deleted.
Large indexes take tens of minutes just for analysis.
Recovery from backup or full re-indexing from MySQL (tens of minutes to hours) is required.
2) Re-indexing Downtime: Lucene Cannot Do Zero-Downtime Switchover
Elasticsearch uses alias switching so search is not interrupted during re-indexing.
Atomic switch from my_index_v1 -> my_index_v2.
Lucene requires implementing directory swap logic manually to maintain search on the existing index while building a new one.
When Lucene major versions change, the index format changes, requiring step-by-step upgrades (e.g., 9.x -> 10.x).
Source: Apache Lucene Migration Guide
3) NRT (Near Real-Time) Search: Must Be Implemented Manually
Elasticsearch needs just one line: refresh_interval: 1s. Documents appear in search 1 second after insertion. Lucene requires using SearcherManager to periodically call maybeRefresh() and manage IndexSearcher with thread-safe acquire/release patterns. The trade-off between refresh frequency and indexing performance must also be tuned manually.
4) Monitoring: Lucene Has No Observability
Elasticsearch provides real-time status via _cluster/health, _nodes/stats, and Kibana dashboards.
Lucene requires building all index status, segment count, and query performance monitoring from scratch.
5) Features: What ES Gives for Free Must Be Built Manually
| Feature | Elasticsearch | Embedded Lucene |
|---|---|---|
| Aggregations | Built-in API | Implement with Lucene Collector |
| Completion Suggester (autocomplete) | One-line API | Separate index + custom logic |
| Query DSL | JSON-based query language | Programmatic construction via Java API |
| Deep Pagination (Scroll/Search After) | Built-in | Cursor-based manual implementation |
Source: Capella Solutions — Lucene vs Elasticsearch, HeroDevs — Solr & Lucene in Production: Hidden Risks, Real Costs
6) Quantification: Server Cost vs Development/Operations Cost
| Cost Item | Embedded Lucene | Elasticsearch |
|---|---|---|
| Server cost (monthly) | $44~87 | $87~174 (+CDC $80~339) |
| Initial development time | NRT, backup, monitoring implemented manually: weeks | Configuration + API calls: days |
| Disaster recovery | Manual (re-indexing tens of minutes to hours) | Replica auto-promotion (seconds) |
| Scaling | Single node limit -> architecture redesign | Add nodes |
| Operations expertise | Requires understanding Lucene internals (rare) | ES operations knowledge (relatively abundant) |
7) Core: Labor Cost, Not Server Cost, Is the Real Cost
In the table above, the server cost difference is $43~130/month.
But the real reason companies choose ES is not server cost.
If a backend developer’s annual salary is 50M~100M KRW, monthly salary is 4~8M KRW.
If building NRT, backup, monitoring, and index swapping with Lucene takes 2~4 extra weeks, that labor cost equals 1~2 years of ES server costs.
Companies optimize Time-to-Market, not servers.
Spending $174/month on ES is cheaper than a developer working 2 extra weeks.
[Server cost] Lucene < ES (Lucene is $0~87 cheaper)[Labor cost] Lucene >> ES (weeks vs days)[Operations cost] Lucene >> ES (disaster recovery, monitoring built manually)[Total cost] Lucene > ES (at most companies)8) Real-World Evidence — The Pain of Embedded Lucene in Jira/Confluence
The products that have used embedded Lucene at the largest scale are Atlassian’s Jira and Confluence.
The problems these products face exactly match the warnings in points 1)~5) above.
| Problem | Jira/Confluence Actual Case |
|---|---|
| Index corruption | Lucene index corrupts on abnormal server shutdown -> search unavailable. Atlassian official docs: “There is no safe way to identify or rectify Lucene DB corruption; rebuilding it is the only way” |
| Re-indexing downtime | Full search outage during index rebuild in Jira Server. Takes hours for large instances |
| DB-Index inconsistency | ”Jira does not support 2-phase commits between DB and index” -> race condition causes search results and actual data to diverge |
Atlassian had to create a complex operational procedure for Jira Data Center: “take one node out while another node handles indexing to avoid downtime.”
With ES, an alias switch of one line would suffice, but they had to build it themselves.
Source: Atlassian — Troubleshoot Lucene Index Corruption in Jira, Atlassian — How to Reindex Jira Without Downtime
9) Only Three Companies Used Lucene Directly — And All Were Special Cases
| Company | Why Lucene Instead of ES | Dedicated Team |
|---|---|---|
| Twitter (Earlybird) | ES did not exist in 2010. No open source supported real-time tweet search | Search dedicated team |
| LinkedIn (Galene) | Personalized real-time ranking of 300M+ profiles — impossible with ES’s general-purpose ranking | Search dedicated team |
| Uber (Sia) | Driver locations change every second — ES does not support concurrent read/write | Search dedicated team |
Three commonalities:
- Extreme requirements that ES could not solve (real-time index, personalized ranking, concurrent write)
- Search infrastructure dedicated teams (5~20 people)
- Twitter and Uber used ES first and migrated after hitting limitations
Uber is particularly notable.
Their ES cluster was handling 80 billion documents and billions of queries per second, but they hit a limitation in rider-driver matching: “the index updates every second, and ES’s refresh_interval: 1s is not enough.”
So they extended Lucene directly to create a Live Index (memory-resident, concurrent read/write) + Snapshot Index (disk flush every 30 minutes) architecture.
Building this Sia engine took a dedicated team several months.
Source: Uber — The Evolution of Uber’s Search Platform, Uber — Lucene Version Upgrade, LinkedIn — Galene Search Architecture
Conclusion: Why embedded Lucene is reasonable for this project
The rationale for choosing Lucene while acknowledging the above risks:
- Source of Truth is MySQL. Even if the index is corrupted, it can be rebuilt from the DB. ES’s Replica-based “index loss prevention” is relatively less important.
- Single server, single instance. Spending RAM on a distributed layer when distribution is not needed is waste.
- 14.77M documents are within Lucene’s single index range (100~250M documents/node).
- Search is not mission-critical. This is not a service where search downtime = revenue loss. If search is briefly unavailable during re-indexing, the entire service does not stop.
If search downtime directly impacts revenue, multiple developers simultaneously access the index, or data exceeds 100M documents — Elasticsearch is the right choice.
5-5. Migration Path Is Open
Building Lucene first allows upgrading to Elasticsearch later when needed.
Since Elasticsearch is built on Lucene, Analyzer (Nori) and Query logic can be carried over almost as-is.
The same applies to vector search. Lucene 10 natively supports HNSW vector search with KnnVectorField. The paper “Vector Search with OpenAI Embeddings: Lucene Is All You Need” (University of Waterloo, arXiv:2308.14963) confirmed that Lucene’s HNSW index delivers competitive performance compared to dedicated vector DBs.
Current: MySQL FULLTEXT ngram (structural limitations) -> This post: Lucene + Nori (heap 2~4GB + page cache, full indexing, morphological analysis) -> If needed: Vector hybrid (Lucene HNSW, same index) -> If needed: Elasticsearch (distributed, Analyzer/Query reuse)Points at which to consider Elasticsearch migration:
- When document count exceeds 100M and single-node performance limits become apparent
- When the search service needs to be separated into an independent microservice
- When multiple teams/services need to share search indexes
At the current 14.77M documents, none of these conditions are met.
5-6. Lucene Architecture from a CQRS Perspective
Introducing Lucene is itself the starting point of CQRS (Command Query Responsibility Segregation).
The separation of Write Path and Read Path must be explicitly recognized.
Write Path (Command):
- Client -> API ->
PostService-> MySQL (source of truth storage) - MySQL is Single Source of Truth
Read Path (Query):
- Client -> API ->
LuceneSearchService-> Lucene Index (search) - Lucene serves as the read-only view (Read Model)
Current synchronization method: Direct IndexWriter.addDocument() call inside PostService.save() (synchronous).
Since Lucene is embedded, Read/Write separation is naturally achieved within the process.
Network separation like ES is unnecessary.
5-7. What If Transitioning to Multiple Instances?
Currently it is a single instance (Spring Boot + embedded Lucene).
What happens if traffic grows and multiple instances become necessary?
| Aspect | Single Instance (Current) | Multiple Instances |
|---|---|---|
| Index synchronization | Local file, synchronous call | Index replication needed across instances |
| Index consistency | Single IndexWriter | Index version mismatch possible between instances |
| Deployment | Simple (index = local file) | Index must also be deployed |
| Search result consistency | Always consistent | Results may differ if LB routes to different instances |
Transition strategy:
Current: Single instance, local Lucene -> Operate as single instance until traffic limit (sufficient for 14.77M documents)
Next: Index centralization -> Store index on NFS/S3, each instance mounts read-only -> Indexing performed on single node (or batch), results saved to shared storage -> SearcherManager.maybeRefresh() detects new index periodically per instance
Final: Elasticsearch migration -> If 3+ instances and real-time index synchronization is needed, ES is advantageous -> At this point, Lucene understanding makes ES operations/tuning easierKey decision criteria:
- 2 instances: NFS + shared index is sufficient. ES unnecessary
- 3+ instances + real-time indexing: Time to consider ES migration
- At the current 14.77M document scale, single-instance Lucene can handle hundreds of TPS, so multi-instance transition is unnecessary for now
6. Implementation Plan
Lucene Architecture
6-1. Overall Flow
6-1. Overall Flow
[Step 1] Add Lucene dependency + verify basic indexing/search (570K Korean docs) |[Step 2] Integrate Nori morphological analyzer + compare search quality against ngram |[Step 3] Batch index all 14.77M rows (measure index size, time) |[Step 4] Switch Spring Boot search API to Lucene |[Step 5] Before/After measurement (high-frequency tokens, search quality, index size) |[Step 6] Clean up ngram resources (DROP tmp_namu_posts, DROP FULLTEXT index)6-2. ngram Current State
Existing ngram-related resources must be identified before Lucene migration.
| Resource | Size/Count | Purpose | After Lucene Migration |
|---|---|---|---|
| tmp_namu_posts table | 570K rows, 12GB | ngram search target (Korean only) | Can be dropped — Lucene indexes posts directly |
| FULLTEXT ngram index | 6.7GB | title+content token index | DROP -> disk reclaimed |
| B-Tree idx_title_viewcount (posts) | - | Autocomplete/sorting | Retain — used in list queries |
| V3 migration (Flyway) | - | ngram index creation DDL | DROP in V4 after Lucene migration |
6-3. Data Validation — Handled at Indexing Time
Aggregate queries like COUNT(*), AVG(CHAR_LENGTH(content)) on the 14.77M row (122GB) table inevitably time out due to Full Table Scan. Instead of a pre-census, we handle it defensively in the indexing code.
// Before IndexWriter.addDocument() -- filter null/empty documentsif (post.getContent() == null || post.getContent().isBlank()) { log.warn("Skipping empty content: postId={}", post.getId()); return;}The figures already confirmed in the previous post are sufficient:
- Total 14.77M rows (122GB), Korean (category_id=1) 570K rows (12GB)
- Average content length: ~6,586 characters
ramBufferSizeMBdefault (256MB) is sufficient; adjust if OOM occurs during indexing
6-4. Step Details
Step 1: Basic Operation Verification
| Task | Details |
|---|---|
| Add dependencies | lucene-core, lucene-analysis-nori, lucene-queryparser |
| LuceneConfig | MMapDirectory, KoreanAnalyzer, IndexWriterConfig(BM25) |
| LuceneIndexService | indexPage(), indexBatch(), search() |
| Verification | Index 570K Korean docs -> verify “Vettel” search works |
implementation 'org.apache.lucene:lucene-core:10.2.1'implementation 'org.apache.lucene:lucene-analysis-nori:10.2.1'implementation 'org.apache.lucene:lucene-queryparser:10.2.1'// LuceneConfig.java -- core 3 linesDirectory directory = MMapDirectory.open(Paths.get("/data/lucene/wiki-index"));Analyzer analyzer = new KoreanAnalyzer(); // Nori morphological analyzerIndexWriterConfig config = new IndexWriterConfig(analyzer);MMapDirectory leverages OS page cache to memory-map index files. Since it uses the OS region rather than JVM heap, Uwe Schindler’s recommendation from section 4-1 to “leave 3/4 of total RAM for page cache” applies here.
Step 2: Search Quality Comparison
We compared ngram and Nori results with the same search queries. Nori token analysis results were verified directly via the /admin/lucene/analyze endpoint.
// PostAdminController -- Nori token analysis endpoint@GetMapping("/analyze")public List<Map<String, String>> analyze(@RequestParam String text) throws IOException { List<Map<String, String>> tokens = new ArrayList<>(); try (TokenStream stream = analyzer.tokenStream("content", text)) { CharTermAttribute term = stream.addAttribute(CharTermAttribute.class); TypeAttribute type = stream.addAttribute(TypeAttribute.class); stream.reset(); while (stream.incrementToken()) { tokens.add(Map.of("token", term.toString(), "type", type.type())); } stream.end(); } return tokens;}Measured results — Nori token analysis:
"I love the Republic of Korea" -> ["daehan", "minguk", "sarang"] - Particle removed, ending removed, only semantic units extracted| Query | ngram (current) | Nori (Lucene) |
|---|---|---|
| “Republic of Korea" | "daehan”, “hanmin”, “minguk” each matched -> much noise | ”daehan”, “minguk” morpheme-unit matching |
| ”Korean language” -> false positive | ”Incheon International Airport” matched (false positive) | Not matched |
| ”daehan” (high-frequency) | 5s+ timeout (503) | Instant response |
| ”Republic of Korea” + suffix vs “Republic of Korea” | Different results | Ending removed -> identical results |
Measured results — search performance comparison:
| Lucene + Nori | MySQL FULLTEXT ngram | |
|---|---|---|
| Search target | 14.25M rows (all) | 570K rows (Korean only) |
| “Republic of Korea” search | 2,144 results returned instantly | 503 QUERY_TIMEOUT |
| Response | Instant | 5-second+ timeout |
Instant response while searching 25x more data. MySQL FULLTEXT times out even at 570K rows.
Step 3: Full Data Indexing
| Item | Expected | Measured |
|---|---|---|
| Target | posts table 14.77M rows | 14,247,466 rows (skipped: 1,234) |
| Index size | 10~30 GB | 29GB |
| Indexing time | Tens of minutes to hours | 6 hours 40 minutes (23,985 seconds) |
| Disk | 30GB out of 253GB available | Sufficient |
Lessons learned while solving OOM issues during indexing:
// Final batch indexing code -- 3 OOM resolution pointspublic void indexAll(long startId) throws IOException { long lastId = startId;
// (1) If startId=0, clear existing index; otherwise resume from interruption point if (startId == 0) { indexWriter.deleteAll(); indexWriter.commit(); }
while (true) { List<Post> batch = postRepository.findBatchAfterId(lastId, batchSize); if (batch.isEmpty()) break; for (Post post : batch) { if (post.getContent() == null || post.getContent().isBlank()) continue; indexWriter.addDocument(toDocument(post)); } indexWriter.commit(); lastId = batch.getLast().getId(); entityManager.clear(); // (2) Clear Hibernate 1st-level cache -> GC can reclaim Post objects } indexWriter.forceMerge(1);}// (3) Reduced batch size from 10,000 to 1,000 (LONGTEXT content is hundreds of MB per batch)// (4) Dockerfile: Changed to allow heap size control via JAVA_OPTSOOM resolution process:
- OOM occurred at id=520,000 with batch size 10,000
- Cause: LONGTEXT content (average 6,586 chars) at 10,000 rows per batch is hundreds of MB -> JVM heap exceeded
- Fix:
entityManager.clear()+ reduced batch size to 1,000 +startIdparameter for resumability
Index file structure (single segment after forceMerge(1)):
| File | Size | Role |
|---|---|---|
_cla_Lucene103_0.pos | 20GB | Morpheme position information (Nori token position) |
_cla_Lucene103_0.doc | 7GB | Inverted index document ID mapping |
_cla_Lucene103_0.tim | 888MB | Term dictionary |
_cla.fdt | 441MB | Stored fields (title raw text) |
_cla_Lucene90_0.dvd | 112MB | Doc values (for sorting/filtering) |
_cla.kdd | 87MB | Point values (numeric fields) |
During batch indexing, Hibernate’s 1st-level cache kept accumulating, causing OOM.
Calling entityManager.clear() on every batch and reducing batch size resolved the issue.
The Docker container’s JAVA_OPTS was set to -Xmx1g to secure heap memory.
Step 4: API Migration
Before: PostController -> PostService -> PostRepository (MySQL FULLTEXT)After: PostController -> PostService -> LuceneSearchService (Lucene)MySQL is used only for data storage (CRUD), while Lucene handles all search.
Migration key points:
-
PostService.search(): MySQL FULLTEXT -> delegated toLuceneSearchService.search() -
PostService.autocomplete(): MySQLLIKE 'prefix%'-> delegated to LucenePrefixQuery -
@Transactional(timeout = 5)removed — unnecessary since Lucene is not a DB transaction, also prevents connection pool hold -
Existing
PostRepository.searchByKeyword()preserved for performance comparison
// PostService -- search migration (Before -> After)// Before: @Transactional(readOnly = true, timeout = 5)// return postRepository.searchByKeyword(keyword, pageable); // MySQL FULLTEXT
// After:public Page<Post> search(String keyword, Pageable pageable) { try { return luceneSearchService.search(keyword, pageable); // Lucene + Nori } catch (IOException e) { throw new UncheckedIOException(e); }}
// Autocomplete also migrated to Lucene PrefixQuerypublic List<String> autocomplete(String prefix) { try { return luceneSearchService.autocomplete(prefix, 10); } catch (IOException e) { throw new UncheckedIOException(e); }}Autocomplete — Nori + PrefixQuery:
- Input prefix analyzed by Nori -> PrefixQuery generated from first token
- Typing “daehan” instantly matches “Republic of Korea”, “Korean Air”, etc. from inverted index
- MySQL
LIKE 'prefix%'uses B-Tree index but is still slow at 14.77M rows
Post-migration verification — same behavior at existing /posts/search endpoint:
| Query | Before (ngram) | After (Lucene Nori) |
|---|---|---|
| “Republic of Korea” | 503 QUERY_TIMEOUT | 2,144 results returned instantly |
Step 5: Before/After Measurement
| Item | Before (ngram) | After (Lucene Nori) | Improvement |
|---|---|---|---|
| ”Vettel” search (rare) | 23ms | 14ms | 39% |
| “Korea” search (mid-frequency) | 281ms | 24ms | 91% |
| “daehan” search (high-frequency) | 5s+ timeout | 12ms | Infinity (timeout resolved) |
| Search target | 570K rows (Korean only) | 14.25M rows (all) | 25x expansion |
| False positive (“Korean language” -> “Incheon International Airport”) | Present | Resolved | |
| Morphological analysis (“Republic of Korea” + suffix = “Republic of Korea”) | Different results | Identical (2,144 results) | |
| Index size | 6.7 GB (570K rows) | 29GB (14.25M rows) | 25x data, 4.3x index |
Core: Timeout -> 12ms for high-frequency keywords while searching 25x more data.
Mid-frequency keyword (“Korea”) also improved from 281ms -> 24ms (91%).
Disk/page cache measurement to be done after server deployment.
Searching “Republic of Korea” with and without suffix both return identical 2,144 results.
Nori removes the particle and normalizes to “Republic of Korea.”
With ngram, “Republic of Korea” + suffix -> [“daehan”,“hanmin”,“minguk”,“suffix”] vs “Republic of Korea” -> [“daehan”,“hanmin”,“minguk”] produced different tokens and therefore different results.
After server deployment, Grafana confirmed that 5 repeated “daehan” searches caused virtually no CPU usage change.
In the ngram era, CPU was occupied for 5+ seconds, but Lucene finishes in 12ms — unobservable at the host level.
Step 6: Resource Cleanup
Proceeds after confirming stable Lucene search operation:
| Task | Effect |
|---|---|
| DROP tmp_namu_posts table | Reclaim 12GB data + 6.7GB FULLTEXT index |
| Clean up ngram DDL in V4 migration | Clean schema |
-- V4 migrationDROP TABLE IF EXISTS tmp_namu_posts; -- Reclaim 12GB data + 6.7GB FULLTEXT-- FULLTEXT index on posts table was already absent (only existed on tmp_namu_posts)
6-5. BM25 Scoring Tuning
Lucene uses BM25 as the default scoring algorithm.
BM25 formula:score(D,Q) = Sigma IDF(qi) x (tf x (k1 + 1)) / (tf + k1 x (1 - b + b x |D|/avgdl))
- k1 = 1.2 (term frequency saturation)- b = 0.75 (document length normalization)// Lucene BM25 parameter adjustmentBM25Similarity similarity = new BM25Similarity( 1.2f, // k1: higher = more tf influence 0.75f // b: higher = more penalty for long documents);searcher.setSimilarity(similarity);Parameters suited for Wikipedia characteristics:
| Parameter | Default | Wiki Recommended | Reason |
|---|---|---|---|
| k1 | 1.2 | 1.2 | Keep default |
| b | 0.75 | 0.5 | Document length variance is large, so reduce penalty |
Wiki documents range from hundreds to tens of thousands of characters, so lowering b prevents excessively penalizing long documents.
6-6. Autocomplete v2 (Lucene PrefixQuery)
Improving the B-Tree autocomplete LIKE-based autocomplete with Lucene PrefixQuery.
v1 problems:
- Only title searchable -> keywords in body cannot trigger autocomplete
- Typing “artificial intelligence” cannot suggest “AI”-related documents
- LIKE ‘prefix%’ is also slow at large scale
v2 implementation (Lucene):
public List<String> autocomplete(String prefix, int limit) throws Exception { try (IndexReader reader = DirectoryReader.open(directory)) { IndexSearcher searcher = new IndexSearcher(reader);
Query query = new PrefixQuery(new Term("title", prefix)); TopDocs topDocs = searcher.search(query, limit);
return Arrays.stream(topDocs.scoreDocs) .map(hit -> { try { return searcher.doc(hit.doc).get("title"); } catch (IOException e) { return null; } }) .filter(Objects::nonNull) .toList(); }}v1 vs v2 comparison:
| Metric | v1 (LIKE + B-Tree) | v2 (Lucene PrefixQuery) | Improvement |
|---|---|---|---|
| Response time | 8ms (570K rows) | ms range (14.25M rows) | Equal or better with 25x data |
| Search scope | Title only (570K rows) | Title (all 14.25M rows) | 25x expansion |
| Suggestion quality | String prefix matching | Nori morpheme-based prefix matching | Morpheme-level |
7. Current Position and Next Steps
What was confirmed in the previous post (FULLTEXT ngram Index):
- 3 structural limitations of MySQL FULLTEXT ngram (high-frequency tokens, index size, search quality)
- Cost comparison of alternative technologies (Lucene, ES/OpenSearch, Vector DB) completed
- Embedded Lucene is a reasonable choice for this project when accepting server cost (~$44~87/month) and operational trade-offs
What this post covers:
- Building search engine with Lucene + Nori morphological analyzer
- Indexing all 14.77M documents
- Verifying high-frequency token timeout resolution
- Before/After performance measurement
- k6 load test baseline (first run where all search queries work stably)
8. After Collection — Post-Lucene Migration
After completing all implementations in this post, After measurements are taken under the same conditions as the Before measurements from the previous post (FULLTEXT ngram Index). Before and After must be under identical conditions for the comparison to be meaningful.
Search Performance (Same queries as previous post sections 5~6)
| Query | Before (ngram) | After (Lucene Nori) | Improvement |
|---|---|---|---|
| ”Vettel” (rare) | 23ms | 14ms | 39% improved |
| ”Korea” (mid-frequency) | 281ms | 24ms | 91% improved |
| ”daehan” (high-frequency) | 5s+ timeout | 12ms | Timeout resolved |
| ”Korean language” -> false positive | ”Incheon International Airport” included | Not included | False positive resolved |
| ”Republic of Korea” + suffix vs “Republic of Korea” | Different results | Identical (2,144 results) | Morphological analysis working |
Index/Infrastructure Measurement
| Item | Before (ngram) | After (Lucene Nori) | Change |
|---|---|---|---|
| Index size | 6.7GB (570K rows) | 29GB (14.25M rows) | 25x data, 4.3x index |
| Search target scope | 570K rows (Korean only) | 14.25M rows (all) | +2,500% |
Disk usage (df -h) | 174G/399G (44%) | 186G/399G (47%) | +12G (+3%p) |
Page cache (free -h) | 4.9GB (buff/cache) | 3.7GB (buff/cache) | -1.2GB |
| CPU (“daehan” search on Grafana) | Timeout (unmeasurable) | No spike (12ms) | Timeout resolved |
Before baseline — server state before Lucene migration (df -h + free -h):
Cost Change
| Item | Before | After | Savings |
|---|---|---|---|
| Additional infrastructure cost | $0 (MySQL only) | $0 (Lucene embedded) | $0 no change |
| Cost that would have occurred with ES adoption | - | $253~794/month | $3,036~$9,528/year avoided |
| Disk reclaimed (tmp_namu_posts DROP) | In use (12GB data + 6.7GB index) | ~19GB reclaimed |
k6 Load Test
Why Load Testing Is Necessary
Single-query performance (12~24ms) alone cannot determine actual service quality. Even if individual requests are fast, entirely different bottlenecks emerge as concurrent users increase:
- HikariCP connection pool saturation: When concurrent requests exceed the connection pool (default 10), wait time spikes.
- Lucene SearcherManager contention: Delays can occur when NRT refresh happens simultaneously with read queries.
- JVM GC pause: As concurrent requests increase, heap usage spikes and Full GC pulls up P99 latency.
- Row Lock contention: When likes (INSERT IGNORE + UPDATE) simultaneously lock the same row, waits occur.
- OFFSET pagination: When multiple VUs simultaneously request deep pages (page=1000), MySQL scans massive rows.
In the previous post, load testing was meaningless because ngram search itself timed out. Now after Lucene migration is the first time a meaningful load test can be run.
Why Four Stages
Rather than applying maximum load at once, we execute in stages so that problems can be isolated. This is the pattern recommended by the k6 official guide.
| Stage | Profile | Duration | Max VU | Real User Equivalent | Purpose |
|---|---|---|---|---|---|
| 1 | smoke | 2 min | 5 | DAU ~100 | Verify script runs error-free. Failure here means script bug, not server issue |
| 2 | load | 20 min | 100 | DAU ~2,000 | Baseline performance measurement. Confirm response times and error rates under normal traffic |
| 3 | stress | 25 min | 200 | DAU ~4,000 | Explore system limits. Identify at which VU count error rate spikes |
| 4 | soak | 4 hours | 50 | DAU ~1,000 | Verify long-term stability. Detect memory leaks, GC pause accumulation, connection pool exhaustion |
VU (Virtual User) means concurrent active users. 1 VU = 1 person sending requests simultaneously. Assuming 5~10% of total users are active concurrently, 100 VU ~ DAU 1,000~2,000.
Stage meanings:
- Error at smoke -> Script bug (not a server issue)
- Error at load -> Cannot handle normal traffic (critical)
- Error only at stress -> Found the limit (normal result)
- Gradual slowdown at soak -> Memory leak (Lucene SearcherManager, HikariCP, etc.)
Test Scenario Design
Scenario ratios (reflecting actual community traffic — 85% reads, 15% writes):
| Scenario | Ratio | Measurement Target | Why Measure? |
|---|---|---|---|
| Search | 35% | Lucene BM25 + Nori | Core functionality. Measure performance differences by posting list length per frequency |
| Autocomplete | 20% | Lucene PrefixQuery | Perceived delay >200ms during typing degrades UX |
| List view | 15% | OFFSET pagination | Verify MySQL load with deep page requests (30% chance of page=100~1000) |
| Detail view | 15% | findById + view count increment | Measure delay when view count UPDATE simultaneously locks the same row |
| Post creation | 8% | NRT incremental indexing | Verify IndexWriter.updateDocument() stability under concurrent load |
| Like | 7% | INSERT IGNORE + Row Lock | Measure InnoDB lock contention when liking the same post simultaneously |
Search query frequency distribution: Within the search scenario, queries are selected at 10% rare tokens, 60% mid-frequency, 30% high-frequency.
Since Lucene performance varies by posting list length, performance on high-frequency tokens (“Republic of Korea”, “history”) determines actual service quality.
Target Thresholds
Global SLO and per-endpoint SLA are separated. This is the pattern recommended by k6 official documentation: global is the “is everything okay overall” safety net, per-endpoint is each API’s actual performance expectation.
| Metric | Threshold | Why This Standard? |
|---|---|---|
| Overall P95 | < 3,000ms | Global SLO safety net. Set loosely since list view (OFFSET) is slow |
| Overall P99 | < 5,000ms | Allow worst case (deep OFFSET + GC pause) |
| Search P95 / P99 | < 300ms / < 500ms | Single query 12~24ms so plenty of headroom at 100 concurrent. Google research shows 200~300ms as user abandonment threshold |
| Autocomplete P95 / P99 | < 200ms / < 300ms | Perceived delay during typing must be within 200ms to feel “instant” |
| List view P95 | < 5,000ms | OFFSET pagination baseline. To be lowered to 500ms after keyset migration |
| Detail view P95 | < 200ms | PK lookup — should be fast |
| Write P95 | < 300ms | Includes DB INSERT + Lucene NRT indexing |
| Error rate | < 1% | 99%+ of requests must return normal responses for stable service |
Why P95/P99? Average response time hides a few slow requests. P95 represents “the experience of 95 out of 100 users”, P99 represents “99 out of 100.” Actual service quality is determined by tail latency, not average.
Why separate global and per-endpoint? With only
http_req_duration(global), slow list views contaminate overall P95, making it impossible to assess actual search/autocomplete performance. Conversely, with only per-endpoint thresholds, forgetting to add a threshold for a new API creates a monitoring blind spot.
Load Pattern Details (load profile — for baseline measurement)
| Phase | Duration | VU Count | Purpose |
|---|---|---|---|
| Warm-up | 2 min | 0 -> 50 | JVM JIT compilation, Lucene page cache loading |
| Normal load | 10 min | 50 sustained | Normal traffic simulation, steady-state measurement |
| Peak load | 2 min | 50 -> 100 | Peak traffic transition |
| Peak sustained | 5 min | 100 sustained | Stability under peak conditions |
| Cooldown | 1 min | 100 -> 0 | System recovery capability verification |
The previous version (3-minute) was only smoke-level. The k6 official guide recommends baseline measurement with at least 10 minutes of steady state so that performance is measured after JVM GC, connection pool, and cache warm-up effects have stabilized.
Execution Method
Executed on the monitoring-loki server (where Grafana + InfluxDB reside). Since k6 and InfluxDB are on the same server, metrics are sent to localhost:8086, and requests to the load target App Server go through nginx (HTTPS) -> Spring Boot. This tests the actual service path including TLS handshake and Nginx proxy overhead. Since it traverses the OCI internal network, public internet latency variation does not introduce noise into measurements, enabling more accurate measurement of the server’s own processing capability.
# SSH into monitoring-loki server and execute
# Stage 1: smoke -- script verification (2 min)k6 run -e PROFILE=smoke -e BASE_URL=https://api.example.com ~/k6/baseline-load-test.js
# Stage 2: load -- baseline performance measurement (20 min, Grafana integration)k6 run --out influxdb=http://localhost:8086/k6 \ -e PROFILE=load -e BASE_URL=https://api.example.com ~/k6/baseline-load-test.jsMeasurement Results — smoke Profile (Script Verification)
Test environment: ARM 2 cores / 12GB RAM — Spring Boot 2GB (JVM heap 1GB) + MySQL 4GB (InnoDB BP 2GB) + monitoring agents ~1GB. Remaining ~5GB for OS page cache (Lucene MMap).
The purpose of the smoke profile is to verify the script runs error-free. With 5 VU / 2 minutes, the sample count is too small for P99 to be statistically meaningful, so only average and P95 are examined here. Performance assessment starts from the load profile.
| Metric | Search | Autocomplete | List View | Detail View | Write |
|---|---|---|---|---|---|
| Average | 66ms | 25ms | 2,518ms | 53ms | 62ms |
| P95 | 128ms | 37ms | 3,372ms | 93ms | 124ms |
| Threshold | PASS | PASS | PASS | PASS | PASS |
| Overall | Value |
|---|---|
| Total requests | 214 |
| Error rate | 0.00% |
| Overall average | 462ms |
| Overall P95 | 2,239ms (< 3,000ms) |
| All Thresholds | All passed |
What smoke confirmed:
- All 6 scenarios (search, autocomplete, list, detail, create, like) run error-free
- Lucene search and autocomplete are sufficiently fast at 5 concurrent users (P95 128ms / 37ms)
- List view (OFFSET pagination) is the slowest at average 2.5 seconds — expected bottleneck
Why list view is slow:
The k6 script requests page=100~1000 with 30% probability. page 1000 = OFFSET 20,000, so MySQL must read 20,020 rows and discard 20,000 even when using the created_at DESC index. Reading entire rows including content (LONGTEXT) causes hundreds of MB of unnecessary I/O.
The analysis and resolution of this issue is covered in Deferred Join Application — Expected 40x vs Reality 13%. After Deferred Join, P95 improved from 3,372ms -> 2,741ms (-19%) at page 1000 (OFFSET 20,000), but EXPLAIN analysis showed that 85% of the bottleneck was the index scan cost of OFFSET itself. Since actual users mostly view early pages, the maximum page was limited to 200 (OFFSET 4,000), bringing the worst-case to ~500ms. The fundamental solution requires Keyset Pagination, to be introduced when deep page requests become frequent.
Measurement Results — load Profile (Baseline Performance Measurement)
The load profile sends data to Grafana via
--out influxdband is examined through time-series graphs on the dashboard. The key is observing response time trends as VU changes (50 -> 100) over 20 minutes.
API response times:
| Metric | Search | Autocomplete | List View | Detail View | Write (create+like) |
|---|---|---|---|---|---|
| Average | 3,328ms | 3,339ms | 19,424ms | 3,345ms | 1,841ms |
| P95 | 5,010ms | 5,008ms | 28,987ms | 5,010ms | 5,008ms |
| Overall | Value |
|---|---|
| Total requests | 10,947 |
| Error rate | 32.53% |
| Overall average | 5,184ms |
| Overall P95 | 25,872ms |
| All Thresholds | All failed |
Result summary: Total failure. The service that worked fine at 5 VU in smoke completely collapsed at 50~100 VU. In particular, search that was 66ms in smoke became 3,328ms — 50x slower, list view averaged 19.4 seconds, and error rate was 32.53%. This was not just a list view problem; heavy OFFSET from list views consumed CPU, causing all scenarios to cascade into failure.
Bottleneck Analysis — Where Did It Break?
1) CPU Saturation — Single Core Limit
- System CPU reached 100% immediately after test start and stayed there for the entire 20 minutes
- JVM threads increased in steps from 20 -> 60 -> 70 -> 120 — Tomcat worker threads created as VU increased
- ARM server (OCI A1.Flex) has 2 OCPU (2 cores), 12GB RAM. Memory is comfortable at 47%, but CPU-bound tasks — Lucene search and MySQL queries — compete for 2 cores
2) MySQL Is the Real Bottleneck
| MySQL Metric | Value | Interpretation |
|---|---|---|
| QPS | 30~50 ops/s | Up to 50 at peak, then declined due to CPU saturation |
| Slow Queries (cumulative) | 14,800 | Nearly every query was a slow query over 20 minutes |
| InnoDB Buffer Pool hit rate | 100% | Not a disk I/O bottleneck, CPU bottleneck confirmed |
| Connections | ~10 (Max 150) | Only half of HikariCP pool size 20 used, not a connection shortage |
| Table Lock | 0 | No lock contention |
| Row Lock wait | Max 1.67 min | InnoDB row lock waits during INSERT/UPDATE |
Key: InnoDB Buffer Pool hit rate 100% means data is sufficiently loaded in memory. Despite this, 14.8K slow queries occurred because CPU saturation slowed down query processing itself. Deep pagination like OFFSET 20,000 in list views is a CPU-bound operation (index scan -> row skipping), which is fatal in a 1-core environment.
3) Per-Container Resource Usage
- wiki-mysql-prod and wiki-app-prod containers compete for the same 2-core CPU
- MySQL container CPU spiked to 150~200% (Docker CPU% is per-core basis; MySQL occupying nearly all of 2 cores)
- App (Spring Boot) container also occupies CPU with Lucene search + HTTP processing
4) Spring Boot HTTP Metrics
- Most endpoints returning 500 errors — CPU saturation -> request timeout -> 5xx
- Search (
/posts/search) slowest at average 25~30 seconds - Only
/actuator/healthresponds normally — no heavy logic, processable even while CPU is queued - 5xx error rate decreased from initial 40% to 15~20% later — load stabilized after VU ramp-up but still high
5) JVM Is Healthy — Not the Bottleneck
| JVM Metric | Value | Verdict |
|---|---|---|
| Heap usage | ~256MB / 1GB (25%) | Normal |
| GC Pause | 1~4ms (G1 Evacuation) | Normal |
| G1 Old Gen | Nearly unused | No Full GC |
JVM heap has headroom and GC pause is negligible. The bottleneck is external to the JVM (CPU + MySQL).
6) Full Infrastructure View
| Infrastructure Metric | App Server | Interpretation |
|---|---|---|
| CPU usage | Peak ~45% | At host level (2-core average) it looks like headroom, but MySQL occupies 1.5~2 of 2 cores |
| Memory | 47.5% (12GB, ~5.7GB used) | Plenty of headroom. Properly distributed with MySQL 4GB + App 2GB limits |
| Swap | 7.44% | Minor usage, not a major issue |
| Load Average (1m) | 20+ | For 2 cores, LA 20 = 18 processes waiting in queue. 10x overloaded |
Load Average 20 means “20 processes waiting to run on CPU.” The ideal LA is at or below core count (<=2), so this was a 10x overload state.
Root Cause and Improvement Direction
Root cause: App + MySQL + Nginx + monitoring agents coexist on 2 OCPU (ARM, 12GB) server-> CPU saturation at 100 VU -> query delays -> timeouts -> 32% errors
Cause chain: Deep OFFSET in list views (OFFSET 20,000) -> CPU-bound index scan -> 2-core CPU saturation (System CPU 100%, Load Average 20) -> MySQL + App sharing same CPU all delayed (Slow Query 14.8K) -> Search, autocomplete, detail all cascade delayed (66ms -> 3,300ms) -> Spring Boot thread explosion (20->120), request timeouts -> HTTP 500 errors -> k6 error rate 32.53%The key evidence is that search went from 66ms (smoke, 5 VU) to 3,328ms (load, 100 VU) — 50x+ slower. With InnoDB Buffer Pool hit rate 100% (disk I/O 0) yet 14.8K slow queries — confirms CPU, not memory, is the bottleneck.
These numbers become the Baseline for subsequent improvements in caching, pagination optimization, scale-up, etc.
9. Next Steps — Can It Be Solved Without Adding Servers?
Looking only at load test results, it is tempting to conclude “the server is insufficient,” but there is significant room for software optimization.
Re-examining why CPU saturated at 100 VU:
- Even when multiple users enter the same search query, Lucene + MySQL are hit every time (no cache)
- 30% of list views are page 100~200 (OFFSET 2,000~4,000) — CPU-bound index scan on every request
- Search, autocomplete, list, and write simultaneously occupy 2 cores
Introducing a cache means repeated searches do not use CPU, allowing far more requests to be handled on the same 2 cores.
Improvement Priority
Priority 1: Caffeine Local Cache — Directly Eliminate CPU Load
| Cache Target | TTL | Expected Effect |
|---|---|---|
Search results (/posts/search?q=...) | 5 min | Completely skip Lucene scoring + MySQL on repeated searches |
Autocomplete (/posts/autocomplete?q=...) | 5 min | Eliminate DB lookup per keystroke |
List view (/posts?page=N) | 1 min | Eliminate OFFSET scan on repeated same-page requests |
Search queries follow a Zipf distribution (a few popular queries dominate traffic), so caching just the top 1,000 queries can achieve 60%+ hit rate. Cache hit = 0 CPU usage.
Why Caffeine: Caffeine internally uses the Window TinyLfu algorithm. Traditional LRU caches can evict frequently accessed items when one-time items push them out, but TinyLfu uses Bloom filter-based frequency estimation to prioritize keeping “frequently searched keywords.” It achieves higher hit rates than LRU for workloads with distinct Zipf distributions like search caches.
NRT (Near-Real-Time) and Cache Invalidation: Currently, SearcherManager.maybeRefresh() updates the Lucene index in NRT when posts are created. Cache invalidation starts with a TTL-based approach.
- With a 5-minute TTL, new posts may take up to 5 minutes to appear in search results
- For a wiki, stable responses matter more than real-time indexing
- Event-based invalidation (
@CacheEvict) cannot determine “which search query results are affected,” making TTL more practical - Elasticsearch also uses time-based cache invalidation internally
Using a message queue (Kafka, etc.) for async search processing is not suitable here. Search requires synchronous responses — queueing would make users wait for results. Message queues are appropriate for async tasks (post-create indexing, notifications). The key to solving CPU saturation is “reducing the work itself” → caching is the answer.
Priority 2: Tomcat Thread Pool Tuning — Reduce Context Switching
Currently application.yml has no Tomcat thread pool configuration, so the default of 200 threads applies. 200 threads is excessive for CPU-bound workloads.
The thread pool formula from Zalando Engineering and Baeldung:
Optimal threads = CPU cores × (1 + Wait time / Service time)For CPU-bound tasks, wait time is near zero: 2 × (1 + 0) = 2 is the theoretical optimum. In practice, Lucene search followed by DB queries (I/O wait) exists, so it should be set higher than core count, but the default 200 only causes context switching overhead.
The k6 load results showing JVM threads surging from 20 → 120 is evidence of this problem. The LoadForge guide also recommends keeping maxThreads within 2-4x of CPU cores.
server: tomcat: threads: max: 20 # Default 200 → reduced for CPU-bound workload min-spare: 4 # Standby threads at core count level accept-count: 100 # OS queue size when all threads are busymax 20 is a conservative starting point. For pure CPU-bound work, 4-6 would be optimal, but the search → DB query (I/O wait) → response pattern needs room to process other requests during I/O waits. Will be tuned with real measurements after Caffeine cache is applied.
Priority 3: HikariCP Connection Pool Verification
The formula cited by the official HikariCP Wiki from the PostgreSQL project:
connections = (core_count × 2) + effective_spindle_countcore_count: physical cores (excluding HyperThreading)effective_spindle_count: 0 when data is fully cached
Current server: 2 OCPU, InnoDB Buffer Pool hit rate 100% → (2 × 2) + 0 = 4. The current DB_POOL_SIZE=10 is larger than the formula suggests, but the HikariCP Wiki emphasizes “smaller pools outperform larger pools” and cites an Oracle experiment where reducing connections from 2,048 → 96 improved response times by 100x.
With Tomcat threads reduced to 20, the number of threads simultaneously querying the DB also decreases, so the current pool size 10 is adequate. After changes, monitor hikaricp_connections_pending (Prometheus metric) and adjust if connection waits occur.
Priority 4: Server Scale-Up
| Config | OCPU Cost | Memory Cost | Monthly Total |
|---|---|---|---|
| 2 OCPU, 12GB (current) | $14.60 | $13.14 | ~$28/mo |
| 4 OCPU, 24GB (scale-up) | $29.20 | $26.28 | ~$56/mo |
OCI A1 Flex pricing: OCPU $0.01/hr, Memory $0.0015/GB-hr. (Oracle official pricing)
Note: OCI Free Tier ARM includes 3,000 OCPU-hours + 18,000 GB-hours/month free, so 4 OCPU 24GB (2,920 OCPU-hours + 17,520 GB-hours) fits within the free allowance. This project runs on Free Tier.AWS comparison: comparable ARM (Graviton) t4g.xlarge (4 vCPU, 16GB) costs ~$98/mo, making OCI roughly half the price. (AWS EC2 Pricing)
Doubling CPU (LA 20 -> ~10) provides immediate improvement, but without applying priorities 1-3 first, the same problem will recur at higher VU counts even on 4 OCPU.
Priority 5: Server-Side Max Page Limit + Keep OFFSET Pagination (Code Change)
Currently the page 200 limit is only in the k6 script, but the server API has no limit. Limiting the maximum page on the server side controls the OFFSET worst-case. Google Search also uses OFFSET + maximum page limit (~30 pages), and this approach is more suitable for page number UIs.
Keyset Pagination (
WHERE id < :lastId) performs at O(1) regardless of page depth, but cannot jump to a specific page, making it incompatible with page number UIs. To be reconsidered when an infinite scroll UI is introduced.
Post-improvement re-measurement plan:
1. Caffeine cache + Tomcat thread pool + HikariCP verification -> k6 load re-measurement2. Split k6 metrics by frequency (rare/medium/high separate Trends) -> precise cache effect measurement3. OCI 4 OCPU scale-up -> k6 load re-measurement4. Verify combined effect of improvements5. If new bottleneck is found, decide next stepNot Yet Needed
| Approach | When Needed |
|---|---|
| MySQL Replication (read replica) | When writes interfere with reads even with high cache hit rate |
| App Scale-Out (multiple instances) | When single instance + 4 OCPU reaches its limit |
| Redis Distributed Cache | When cache consistency is needed across multiple instances |
Sources
Pricing Data:
- AWS OpenSearch Service Pricing (Seoul)
- AWS OpenSearch Instance Pricing — Vantage
- AWS EC2 Instance Pricing (r6g) — Vantage
- AWS EBS Pricing
- AWS MSK Pricing
- Elastic Cloud Pricing
- Elastic Cloud Pricing FAQ
- OpenAI API Pricing (Embeddings)
- Pinecone Pricing
BM25 / Scoring:
- Which BM25 Do You Mean? A Large-Scale Reproducibility Study of Scoring Variants
- Practical BM25 — The BM25 Algorithm and its Variables (Elastic Blog)
- BM25 vs Lucene Default Similarity (Elastic Blog)
- Why Top Engineers Still Use BM25 (Minimalist Innovation)
Technology Comparison:
- Elasticsearch vs OpenSearch 2025 Update — BigData Boutique
- Benchmarking OpenSearch and Elasticsearch — Trail of Bits
- Lucene vs Elasticsearch — Capella Solutions
- Elasticsearch Hardware Requirements — Opster
- Vector Search: Lucene Is All You Need — arXiv:2308.14963
- MySQL Bug #85880
Performance Optimization:
- Window TinyLfu — A Highly Efficient Cache Admission Policy (ACM)
- Optimizing Lucene Caching — Elastic Blog
- How to Set an Ideal Thread Pool Size — Zalando Engineering
- Configuring Thread Pools for Java Web Servers — Baeldung
- Optimizing Thread Pools for Tomcat — LoadForge
- About Pool Sizing — HikariCP Wiki (GitHub)
- Optimal Connection Pool Size — Vlad Mihalcea
Lucene Resources and Operations:
- Lucene’s RAM Usage for Searching — Mike McCandless
- Estimating Memory and Storage for Lucene/Solr — Lucidworks
- Use Lucene’s MMapDirectory on 64bit Platforms — Uwe Schindler (Lucene committer)
- Apache Solr Memory Tuning for Production — Cloudera
- Nori: The Official Elasticsearch Plugin for Korean — Elastic
- LUCENE-8231: Nori Korean Analyzer — Apache JIRA
- NRT Readers with SearcherManager — Mike McCandless
- Lucene CorruptedIndexException — Elastic Labs
- Apache Lucene Migration Guide
- Solr & Lucene in Production: Hidden Risks, Real Costs — HeroDevs
Industry Case Studies:
- Twitter’s New Search Architecture (2010)
- How Twitter Uses Apache Lucene — Lucidworks
- LinkedIn’s Galene Search Architecture — Lucidworks
- NHN FORWARD 22 — Product Search Engine with Elasticsearch
- Ohouse — A Data Engineer’s Search Development Story
- Debezium CDC Pain Points — Estuary
- Companies Using Apache Lucene — Enlyft
- Uber — Lucene: Indexing and Search at Scale
- Uber — Lucene Version Upgrade at Scale
- Atlassian — Troubleshoot Lucene Index Corruption in Jira
- Atlassian — How to Rebuild the Index in Jira
- LinkedIn Engineering — Did You Mean “Galene”?

댓글
댓글 수정/삭제는 GitHub Discussions에서 가능합니다.