COUNT(*) 제거와 페이지 제한으로 19,424ms → 8ms
목차
이전 글
Deferred Join 적용기에서 1,475만 건 OFFSET 페이지네이션에 Deferred Join을 적용하고, 기대 대비 낮은 개선율의 원인을 분석했습니다.
이전 글 요약
Lucene 전환 글에서 Lucene + Nori 형태소 분석기로 검색엔진을 전환했습니다.
1,215만 건 전체 검색, 고빈도 토큰 타임아웃 해소, false positive 제거까지 완료했습니다.
k6 부하 테스트를 처음 실행한 결과, 검색이 아니라 최신 게시글 목록 조회가 최대 병목이었습니다.
테스트 환경: ARM 2코어 / 12GB RAM. Spring Boot 2GB(JVM 힙 1GB) + MySQL 4GB(InnoDB BP 2GB) + 모니터링 에이전트 ~1GB로 나뉘고, 나머지 ~5GB는 OS 페이지 캐시(Lucene MMap)입니다.
| 시나리오 | smoke (5 VU) | load (100 VU) |
|---|---|---|
| 검색 (Lucene) | 66ms | 3,328ms |
| 자동완성 (Lucene) | 25ms | 3,339ms |
| 최신 게시글 목록 (MySQL OFFSET) | 2,518ms | 19,424ms |
| 상세 조회 (MySQL) | 53ms | 3,345ms |
| 에러율 | 0% | 32.53% |
smoke에서 검색(66ms)보다 최신 게시글 목록 조회(2,518ms)가 38배 느렸습니다.
load에서는 최신 게시글 목록 조회의 heavy OFFSET이 CPU를 포화시키면서 모든 시나리오가 연쇄적으로 무너졌습니다.
1. 문제 발견: 검색이 아니라 최신 게시글 목록 조회가 병목이었다
이 문제는 최신 게시글 목록 조회(
GET /api/v1.0/posts)에 해당합니다.
Lucene 검색(GET /api/v1.0/posts/search)은 역색인에서 직접 결과를 반환하므로 OFFSET 문제가 없습니다.
k6 스크립트에서 30% 확률로 page=100~1000을 요청하는 조건이었습니다.
page 1000 = OFFSET 20,000이므로, MySQL이 20,020개 행을 읽고 20,000개를 버려야 합니다.
-- 최신 글 목록: created_at DESC로 정렬SELECT * FROM postsORDER BY created_at DESCLIMIT 20 OFFSET 20000; -- page 10012. 원인 분석: SELECT * + OFFSET의 구조적 비효율
MySQL의 SELECT * + OFFSET은 다음 과정을 거칩니다:
1. 세컨더리 인덱스(idx_posts_created_at)에서 PK를 순차 획득2. 각 PK로 클러스터 인덱스에서 전체 행(LONGTEXT 포함) 랜덤 I/O3. OFFSET 20,000개를 읽고 버림 → 20,000 × ~13KB(위키 본문 평균) ≈ ~260MB를 읽고 버림4. 나머지 20개만 반환PostSummaryResponse는 content를 사용하지 않습니다. 필요 없는 LONGTEXT를 읽고 있었습니다.
CPU 포화 원인 체인 (k6 load 결과):
최신 게시글 목록 조회의 deep OFFSET (OFFSET 20,000) → CPU-bound 인덱스 스캔→ 2코어 CPU 포화 (System CPU 100%, Load Average 20)→ 같은 CPU를 쓰는 MySQL + App 전체 지연 (Slow Query 14.8K)→ 검색·자동완성·상세까지 연쇄 지연 (66ms → 3,300ms)→ Spring Boot 스레드 폭증 (20→120), 요청 타임아웃→ HTTP 500 에러 → k6 에러율 32.53%핵심 증거: InnoDB Buffer Pool 히트율 100%(디스크 I/O 0)인데도 Slow Query가 14.8K건 발생했습니다. 메모리가 아닌 CPU가 병목이었습니다.
3. 해결 1: Deferred Join (지연 조인)
원리
내부 서브쿼리에서 SELECT id만 하여 Covering Index Scan으로 처리하고,
외부 쿼리에서 최종 20개 PK로만 클러스터 인덱스를 조회합니다.
-- Before: 전체 행(LONGTEXT 포함) 20,020건 랜덤 I/OSELECT * FROM postsORDER BY created_at DESCLIMIT 20 OFFSET 20000;
-- After: Covering Index로 PK만 추출 후, 20건만 클러스터 I/OSELECT p.* FROM posts pINNER JOIN ( SELECT id FROM posts ORDER BY created_at DESC LIMIT 20 OFFSET 20000) AS tmp ON p.id = tmp.idORDER BY p.created_at DESC;
idx_posts_created_at에는(created_at, id)두 값이 들어 있으므로
SELECT id ... ORDER BY created_at DESC는 이 인덱스만으로 완결됩니다 (Covering Index).
현재 구현
PostRepository.java:
@Query(value = """ SELECT p.* FROM posts p INNER JOIN ( SELECT id FROM posts ORDER BY created_at DESC LIMIT :#{#pageable.pageSize} OFFSET :#{#pageable.offset} ) AS tmp ON p.id = tmp.id ORDER BY p.created_at DESC """, countQuery = "SELECT COUNT(*) FROM posts", nativeQuery = true)Page<Post> findAllWithDeferredJoin(Pageable pageable);PostService.java:
public Page<Post> getPosts(Pageable pageable) { return postRepository.findAllWithDeferredJoin(pageable);}EXPLAIN 결과
| id | select_type | table | type | key | rows | Extra |
|---|---|---|---|---|---|---|
| 2 | DERIVED | posts | index | idx_posts_created_at | 20,020 | Using index (Covering) |
| 1 | PRIMARY | <derived2> | ALL | NULL | 20,020 | Using temporary; Using filesort |
| 1 | PRIMARY | p | eq_ref | PRIMARY | 1 |
클러스터 인덱스 랜덤 I/O: 20,020회 → 20회 (1,000배 감소)
측정 결과 (k6 smoke, 5 VU, 2분)
| 메트릭 | Before | After | 개선율 |
|---|---|---|---|
| 평균 응답시간 | 2,518ms | 2,199ms | -13% |
| P95 | 3,372ms | 2,741ms | -19% |
기대(40배) 대비 낮은 개선율(13%) 원인
EXPLAIN 분석 결과:
- 전체 비용의 ~85%는 인덱스 20,020개 엔트리 순차 스캔 (Deferred Join이 제거할 수 없는 부분)
- LONGTEXT I/O는 ~15%뿐 → 이것만 제거해서 13%
- 추가로 임시 테이블 생성(Using temporary; Using filesort) 오버헤드가 일부 상쇄
| OFFSET 크기 | Deferred Join 개선율 | 이유 |
|---|---|---|
| OFFSET 200 (page 10) | ~60% | 클러스터 I/O 비중이 큼 |
| OFFSET 2,000 (page 100) | ~40% | |
| OFFSET 10,000 (page 500) | ~20% | |
| OFFSET 20,000 (page 1000) | ~13% | 인덱스 스캔이 지배적 |
사용자 트래픽의 ~90%는 page 1~10이므로, 평균 체감 개선은 k6 측정치(13%)보다 높습니다.
4. 해결 2: 최대 페이지 수 제한
OFFSET의 근본 한계(O(N) 스캔)는 Deferred Join으로 완화되지만, 무제한 페이지는 여전히 위험합니다.
Google은 ~30페이지, 네이버도 ~30페이지가 한계입니다. 최대 페이지 수를 제한하여 worst-case를 통제합니다.
현업 페이지 제한 비교
| 서비스 | 페이지당 결과 | 최대 페이지 | 최대 결과 수 |
|---|---|---|---|
| 10건 | ~30페이지 | ~300건 | |
| 네이버 | 15건 | ~30페이지 | ~450건 |
| wikiEngine | 20건 | 31페이지 (0~30) | 620건 |
구현
Step 1: ErrorCode 추가
ErrorCode.java에 PAGE_LIMIT_EXCEEDED 추가:
// 400 Bad RequestPAGE_LIMIT_EXCEEDED(HttpStatus.BAD_REQUEST, "최대 페이지 수를 초과했습니다"),Step 2: PostService에 페이지 제한 로직 추가
private static final int MAX_LIST_PAGE = 30; // 최신 게시글 목록private static final int MAX_SEARCH_PAGE = 30; // Lucene 검색
private void validatePageLimit(Pageable pageable, int maxPage) { if (pageable.getPageNumber() > maxPage) { throw new BusinessException(ErrorCode.PAGE_LIMIT_EXCEEDED); }}왜 30페이지인가:
| 최대 페이지 | 최대 OFFSET | Deferred Join 실측 |
|---|---|---|
| 1,000 (제한 없음) | 19,980 | 19.4ms (Covering Index 스캔) |
| 30 (Google/네이버 수준) | 580 | ~1ms |
- Deferred Join 덕분에 page 1000도 19.4ms이지만, 30페이지면 OFFSET 580으로 사실상 비용 0
- Google, 네이버 모두 ~30페이지 제한. 사용자 기대치와 일치합니다
- 최신 게시글 목록: 30페이지(620건) 이후는 검색으로 유도합니다
- 검색: Lucene이 relevance 순으로 정렬하므로 30페이지 이후는 관련성이 낮습니다
참고: 커서 기반 페이지네이션 (무한 스크롤 전환 시)
현재는 페이지 번호 UI이므로 OFFSET + 페이지 제한이 적합합니다.
무한 스크롤 UI로 전환 시 Keyset Pagination을 재검토할 예정입니다.
-- 커서 방식: 항상 O(LIMIT)만 읽음, 페이지 깊이 무관SELECT * FROM postsWHERE created_at < :lastCreatedAtORDER BY created_at DESCLIMIT 20;| 방식 | 장점 | 단점 | 사용 사례 |
|---|---|---|---|
| OFFSET (페이지 번호) | 특정 페이지 바로 이동 | 깊은 페이지에서 느려짐 | Google, 위키 검색 |
| 커서 (무한 스크롤) | 일관된 성능 | 순차 접근만 가능 | Twitter, Instagram |
5. 해결 3: COUNT(*) 제거
문제
“총 N개 결과” 표시를 위해 매 최신 게시글 목록 조회마다 COUNT(*) 쿼리가 실행되고 있었습니다.
현재 PostRepository.findAllWithDeferredJoin의 countQuery:
countQuery = "SELECT COUNT(*) FROM posts"Spring Data의 Page<T> 반환 시 이 countQuery가 매 요청마다 자동 실행됩니다.
1,215만 건 테이블에서 COUNT(*)는 InnoDB가 가장 작은 세컨더리 인덱스를 풀 스캔해야 하므로 비용이 높습니다.
Lucene 검색(
GET /api/v1.0/posts/search)도 동일하게Slice<T>로 전환했습니다.
Lucene의totalHits는 추정치이고, 총 건수 표시를 제거한 이상 Page를 유지할 이유가 없습니다.
트레이드오프 분석: “총 N개” 표시가 정말 필요한가?
COUNT(*)를 제거하려면 “총 N개 결과” 표시를 포기해야 합니다.
이 트레이드오프를 판단하기 위해, 실제 서비스들이 어떻게 하고 있는지 조사했습니다.
현업 사례 조사
1) Google: 2024년에 결과 수 표시를 아예 제거
Google은 검색 초기부터 “약 45,700,000개 결과”를 표시해왔습니다.
하지만 2024년, 검색 결과 페이지에서 이 숫자를 완전히 제거했습니다.
제거 이유:
- 이 숫자는 추정치였고, 페이지를 넘기면 값이 바뀌는 현상이 일상적이었습니다
- 사용자에게 유용하지 않다고 판단했습니다. “4,570만 개 결과”를 보고 의사결정하는 사용자는 없습니다
- 계산 비용 대비 가치가 없습니다
Before (2024년 이전): "약 45,700,000개 결과 (0.52초)" ← 화면 상단에 표시
After (2024년~): 결과 수 표시 없음. 도구(Tools) 메뉴 안에 숨겨짐출처: Google Drops Result Count From Search Results Page — Search Engine Roundtable
2) Slack: offset+page에서 cursor로 전환, total_count 제거
Slack은 초기에 count + page 파라미터로 OFFSET 페이지네이션을 제공했습니다.
이후 cursor 기반으로 전환하면서 total_count를 제거했습니다.
전환 이유:
- OFFSET이 커질수록 DB가 이전 행을 모두 읽어야 해서 느려집니다
- 아이템이 추가/삭제되면 페이지 윈도우가 밀려서 중복/누락 발생
total_count계산 = COUNT(*) = 대규모 테이블에서 풀 스캔
Slack의 현재 API: next_cursor가 빈 문자열이면 마지막 페이지. 총 건수 없음.
내부적으로
limit + 1개를 조회하여 다음 페이지 존재 여부를 판별합니다.
이것이 Spring Data의Slice<T>와 동일한 패턴입니다.
3) 네이버: 섹션별 분리 + 최대 ~30페이지 제한, 전체 건수 미노출
네이버는 Google과 달리 통합 검색 결과를 섹션별로 분리합니다 (블로그, 뉴스, 카페, 웹문서 등).
각 섹션은 최초 5건 정도만 보여주고 “더보기”로 해당 섹션 전용 페이지로 이동시킵니다.
- 전체 검색 결과 건수를 통합 검색 페이지에 표시하지 않습니다
- 섹션 전용 페이지(블로그 탭, 뉴스 탭)에서도 최대 ~30페이지까지만 제공
(SerpApi — Naver Search API) - 페이지네이션은
start파라미터 기반 OFFSET 방식이며, 웹 검색은 페이지당 10건, 쇼핑은 40건
네이버의 접근법은 Google과 다르지만 결론은 같습니다:
“총 N건” 같은 전체 건수를 사용자에게 보여주지 않으며, 깊은 페이지 접근을 구조적으로 차단합니다.
네이버는 2024년 이후 AI 기반 검색(Cue:)으로 전환을 진행 중이며,
전통적인 10-blue-links 페이지네이션 자체가 줄어드는 추세입니다.
4) Twitter(X), Instagram: 무한 스크롤, 총 건수 없음
피드 기반 서비스는 총 건수 자체가 의미 없습니다.
커서 기반 + hasNext만으로 동작합니다.
5) Stack Overflow, Reddit: 페이지 번호 UI + 총 건수 표시
전통적인 게시판 UI를 유지하는 서비스는 여전히 총 건수를 표시합니다.
다만 이 서비스들은 데이터 규모가 상대적으로 작거나, 캐싱으로 COUNT 비용을 흡수하고 있습니다.
정리: 총 건수 표시 방식 스펙트럼
| 방식 | 대표 서비스 | 장점 | 단점 |
|---|---|---|---|
| 정확한 COUNT | Stack Overflow, 전통 게시판 | 정확한 총 페이지 표시 | 대규모 테이블에서 매 요청 풀 스캔 |
| 추정치 표시 | Google (2024년 이전) | 규모감 제공, COUNT 비용 절감 | 추정치가 부정확 (페이지 넘기면 변동) |
| 총 건수 없음 (hasNext만) | Google (현재), Slack, Twitter | COUNT 쿼리 0, 최고 성능 | ”총 N페이지” 표시 불가 |
| 섹션별 분리 + 페이지 제한 | 네이버 | 섹션별 최적화, 깊은 페이지 차단 | 통합 건수 없음, 최대 ~30페이지 |
UX 관점: 총 페이지 수가 100 이상이면 무의미합니다
NN/g(Nielsen Norman Group) 연구와 UX 디자인 가이드에 따르면:
- 페이지 수가 수십~수백 개 이상이면 총 페이지 수 표시가 사용자에게 도움이 되지 않습니다
- 사용자는 “71,250페이지 중 3페이지”를 보고 아무런 의사결정을 하지 않습니다
- 반면 30페이지 이하라면 총 페이지 수가 “끝이 보인다”는 심리적 효과를 줍니다
이 프로젝트: 1,215만 건 / 20건 페이지 = 60만 페이지. 총 건수 표시는 완전히 무의미합니다.
결론: Google 현재 방식을 따른다 (hasNext만, 총 건수 없음)
| 판단 기준 | 이 프로젝트의 상황 | 결론 |
|---|---|---|
| 데이터 규모 | 1,215만 건 (60만 페이지) | 총 건수 무의미 |
| COUNT(*) 비용 | InnoDB 풀 스캔 (1,215만 행) | 매 요청 비용 높음 |
| UI 타입 | 페이지 번호 | hasNext + 현재 주변 페이지로 충분 |
| 사용자 행동 | 90%가 1~3페이지 | 뒷페이지 네비게이션 거의 없음 |
| 최대 페이지 제한 | 30페이지 | 유한한 범위 → 총 건수 불필요 |
Page<T> → Slice<T> 전환. COUNT(*) 완전 제거. 추정치도 불필요.
페이지 번호 UI는 hasNext로 충분히 구현 가능합니다:

현재 주변 페이지 + [이전]/[다음] 버튼만 표시하면 됩니다.
Google 검색도 2024년 이후 이 방식을 사용하고 있습니다.
만약 나중에 “약 N개 결과”가 필요해지면?
information_schema.tables.table_rows로 추정치를 즉시 조회할 수 있습니다 (±10% 오차).
별도 API로 제공하면 최신 게시글 목록 조회 성능에 영향 없이 추가 가능합니다.
하지만 Google이 이것마저 제거한 이유를 생각하면, 필요해질 가능성은 낮습니다.
구현 계획
주의: Slice + nativeQuery + Deferred Join 조합의 함정
현재 findAllWithDeferredJoin은 서브쿼리 안에 명시적 LIMIT/OFFSET이 있는 nativeQuery입니다.
이 구조에서 Slice<T>를 반환 타입으로 단순 교체하면 문제가 발생할 수 있습니다.
왜 충돌하는가? Spring Data의 페이지네이션 내부 동작
Spring Data JPA가 Pageable 파라미터를 처리하는 과정:

JPQL에서는 Hibernate가 쿼리 구조를 파싱하여 깨끗하게 LIMIT/OFFSET을 추가합니다.
nativeQuery에서는 Hibernate가 SQL을 파싱하지 못합니다.
대신 쿼리 문자열 끝에 LIMIT/OFFSET을 기계적으로 덧붙이거나,
일부 DB 방언에서는 전체 쿼리를 서브쿼리로 감싸서 외부에 페이지네이션을 적용합니다.
Deferred Join 쿼리의 경우, 이 자동 처리가 두 가지 방식으로 충돌합니다:
-- 우리가 작성한 Deferred Join 쿼리 (서브쿼리에 명시적 LIMIT/OFFSET)SELECT p.* FROM posts pINNER JOIN ( SELECT id FROM posts ORDER BY created_at DESC LIMIT 20 OFFSET 0 ← ① 우리가 명시한 LIMIT) AS tmp ON p.id = tmp.idORDER BY p.created_at DESCLIMIT 21 ← ② Hibernate가 자동 추가한 LIMIT (Slice +1)충돌 시나리오:
| # | 현상 | 원인 |
|---|---|---|
| ① | 서브쿼리 LIMIT과 외부 LIMIT 이중 적용 | Hibernate가 nativeQuery 끝에 LIMIT을 기계적으로 추가. 서브쿼리의 LIMIT과 의도가 다름 |
| ② | Slice인데 COUNT 쿼리 실행 | nativeQuery + Slice 조합에서 Spring Data가 PageImpl을 반환하는 버그 (DATAJPA-1464) |
| ③ | 정렬(ORDER BY) 유실 | Spring Data가 nativeQuery에 동적 정렬을 적용하려다 기존 ORDER BY를 덮어쓸 수 있음 (#2260) |
핵심: Spring Data의 자동 페이지네이션은 “쿼리의 최종 결과에 LIMIT/OFFSET을 건다”는 가정으로 동작합니다.
Deferred Join처럼 서브쿼리 안에 이미 LIMIT/OFFSET이 있는 구조에서는 이 가정이 깨집니다.
Spring Data는 nativeQuery의 내부 구조를 파싱하지 못하므로, 서브쿼리의 LIMIT과 외부의 자동 LIMIT이 의도와 다르게 중첩됩니다.
출처: Vlad Mihalcea — Query Pagination with JPA and Hibernate,
Spring Data JPA #2260,
Spring Data JPA #1782 (DATAJPA-1464)
안전한 방법: List<Post> 반환 + 서비스에서 수동 SliceImpl 구성
이 패턴은 현업에서 널리 검증된 방식입니다:
- Slack Engineering:
limit + 1개를 조회하여has_more를 판별하는 것이 Slack의 cursor 기반 페이지네이션의 핵심 메커니즘
(Evolving API Pagination at Slack) - Baeldung: Hibernate
query.setMaxResults(pageSize + 1)+ 수동SliceImpl구성을 “extra row” 패턴으로 소개
(Hibernate Pagination — Baeldung) - Vlad Mihalcea (Hibernate 핵심 기여자): nativeQuery에서
setFirstResult/setMaxResults를 직접 제어할 것을 권장
(Query Pagination with JPA and Hibernate) - Spring Data JPA GitHub Gist:
List<T>반환 +new SliceImpl<>(content, pageable, hasNext)패턴이 Specification 기반 쿼리에서도 사용됨
(GitHub Gist — Limit results without count query)
Spring Data의 자동 처리에 의존하지 않으므로 nativeQuery 호환성 문제가 없습니다.
이 패턴이 Deferred Join + nativeQuery에서 가장 안전하고 확실한 방법입니다.
Step 1: Repository에서 List<Post> 반환, LIMIT/OFFSET 명시적 파라미터
// Before: Page<T> — countQuery 자동 실행 (매 요청 COUNT(*) 풀 스캔)@Query(value = """ SELECT p.* FROM posts p INNER JOIN ( SELECT id FROM posts ORDER BY created_at DESC LIMIT :#{#pageable.pageSize} OFFSET :#{#pageable.offset} ) AS tmp ON p.id = tmp.id ORDER BY p.created_at DESC """, countQuery = "SELECT COUNT(*) FROM posts", nativeQuery = true)Page<Post> findAllWithDeferredJoin(Pageable pageable);
// After: List<T> — COUNT 없음, LIMIT+1은 서비스에서 처리@Query(value = """ SELECT p.* FROM posts p INNER JOIN ( SELECT id FROM posts ORDER BY created_at DESC LIMIT :limit OFFSET :offset ) AS tmp ON p.id = tmp.id ORDER BY p.created_at DESC """, nativeQuery = true)List<Post> findAllWithDeferredJoin(@Param("limit") int limit, @Param("offset") long offset);Step 2: Service에서 수동 Slice 구성 (LIMIT+1 패턴)
public Slice<Post> getPosts(Pageable pageable) { if (pageable.getPageNumber() > MAX_LIST_PAGE) { throw new BusinessException(ErrorCode.PAGE_LIMIT_EXCEEDED); }
int pageSize = pageable.getPageSize(); long offset = pageable.getOffset();
// 핵심: pageSize + 1개를 조회하여 다음 페이지 존재 여부 판별 List<Post> results = postRepository.findAllWithDeferredJoin(pageSize + 1, offset);
boolean hasNext = results.size() > pageSize; if (hasNext) { results = results.subList(0, pageSize); // 실제 표시할 20개만 }
return new SliceImpl<>(results, pageable, hasNext);}
SliceImpl은 Spring Data의Slice<T>구현체입니다.
new SliceImpl<>(content, pageable, hasNext)로 생성하며,
hasNext(),hasPrevious(),getContent(),getNumber()등을 모두 지원합니다.
Step 3: Controller 반환 타입 변경
@GetMappingpublic Slice<PostSummaryResponse> getPosts( @RequestParam(required = false) Long categoryId, @PageableDefault(size = 20) Pageable pageable) {
Slice<Post> posts = (categoryId != null) ? postService.getPostsByCategory(categoryId, pageable) : postService.getPosts(pageable);
return posts.map(PostSummaryResponse::from);}카테고리별 목록(
getPostsByCategory)도 동일한 패턴 적용 필요.
현재findByCategoryIdOrderByCreatedAtDesc는 Spring Data 파생 쿼리이므로
반환 타입을Slice<Post>로 변경하면 자동으로 COUNT가 제거됩니다.
nativeQuery가 아니므로 함정 없음.
검색도 Slice로 전환:
LuceneSearchService.search()도Slice<T>로 전환했습니다. Lucene의totalHits는 추정치이고 총 건수 표시를 제거했으므로,limit + 1패턴으로hasNext()만 판단합니다. 추가로 content(LONGTEXT) 대신 snippet(150자)만 반환하여 응답 크기를 ~99% 절감했습니다.
Spring Data: Page vs Slice 비교
| 항목 | Page<T> | Slice<T> |
|---|---|---|
| COUNT 쿼리 | 매 요청 실행 | 실행 안 함 |
getTotalElements() | O | X |
getTotalPages() | O | X |
hasNext() | O | O |
getContent() | O | O |
getNumber() (현재 페이지) | O | O |
| DB 쿼리 수 | 2개 (데이터 + COUNT) | 1개 (데이터만, LIMIT+1) |
출처: Spring Data JPA — Slice vs Page, JHipster — Boost Infinite Scroll Performance with Slice
성과 (예상)
| 지표 | Before (Page) | After (Slice) | 개선 |
|---|---|---|---|
| DB 쿼리 수/요청 | 2개 (데이터 + COUNT) | 1개 (데이터만) | 50% 감소 |
| COUNT(*) 시간 | 2,038ms (1,477만 건 스캔) | 0ms (제거) | 100% 제거 |
| 총 건수 정확도 | 100% | 표시 안 함 | - |
| 사용자 체감 | 동일 | 동일 (Google도 제거함) | - |
6. Before/After 측정
변경 전 캡처
코드 변경 전에 아래 항목을 캡처했습니다. After와 동일 조건 비교를 위한 증거입니다.
| # | 캡처 항목 | 방법 | 용도 |
|---|---|---|---|
| 1 | COUNT(*) 단건 실행 비용 | EXPLAIN ANALYZE SELECT COUNT(*) FROM posts; | COUNT 제거 효과의 기준점 |
| 2 | 현재 API 응답 JSON (Page 구조) | GET /api/v1.0/posts?page=0&size=20 | totalElements, totalPages 필드가 Slice 전환 후 사라지는 것 확인 |
| 3 | k6 smoke (5 VU, 2분) | k6 run --env PROFILE=smoke baseline-load-test.js | 성능 baseline |
| 4 | Grafana 대시보드 (smoke 중) | QPS, CPU, Slow Query, 스레드 수 패널 캡처 | 인프라 baseline |
| 5 | MySQL 상태 스냅샷 | SHOW GLOBAL STATUS LIKE 'Slow_queries'; | Slow Query 누적 건수 |
| 6 | (선택) deep OFFSET 실행시간 비교 | EXPLAIN ANALYZE page 200 vs page 1000 | 페이지 제한이 왜 필요한지 근거 |
캡처 결과
1. COUNT(*) 실행 비용:
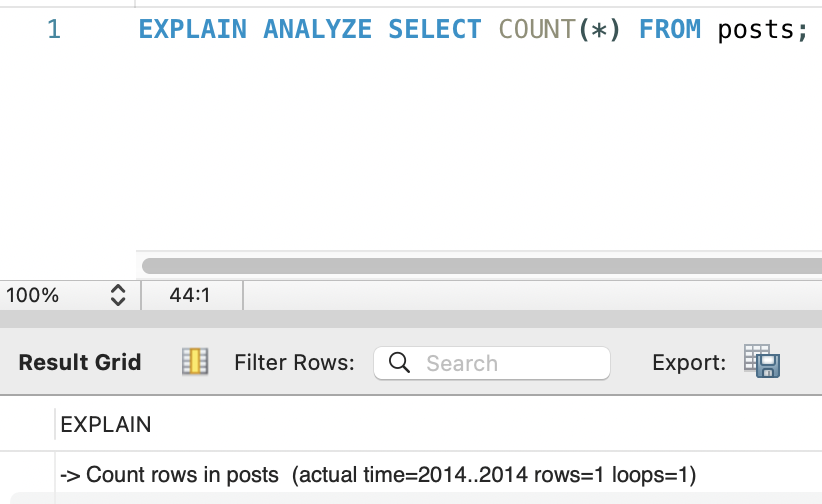

-> Count rows in posts (actual time=2014..2014 rows=1 loops=1)매 최신 게시글 목록 조회마다 약 2초가 COUNT(*)에 소비되고 있었습니다. Duration: 2.038 sec.
2. API 응답 JSON (Page 구조):
GET /api/v1.0/posts?page=0&size=20 응답 (페이지네이션 메타데이터 부분):
{ "totalElements": 14769132, "totalPages": 738457, "number": 0, "size": 20, "first": true, "last": false, "numberOfElements": 20}totalElements: 14,769,132 (약 1,477만 건), totalPages: 738,457 (약 74만 페이지).
Slice 전환 후 totalElements와 totalPages 필드가 사라지고, hasNext: true/false만 남습니다.
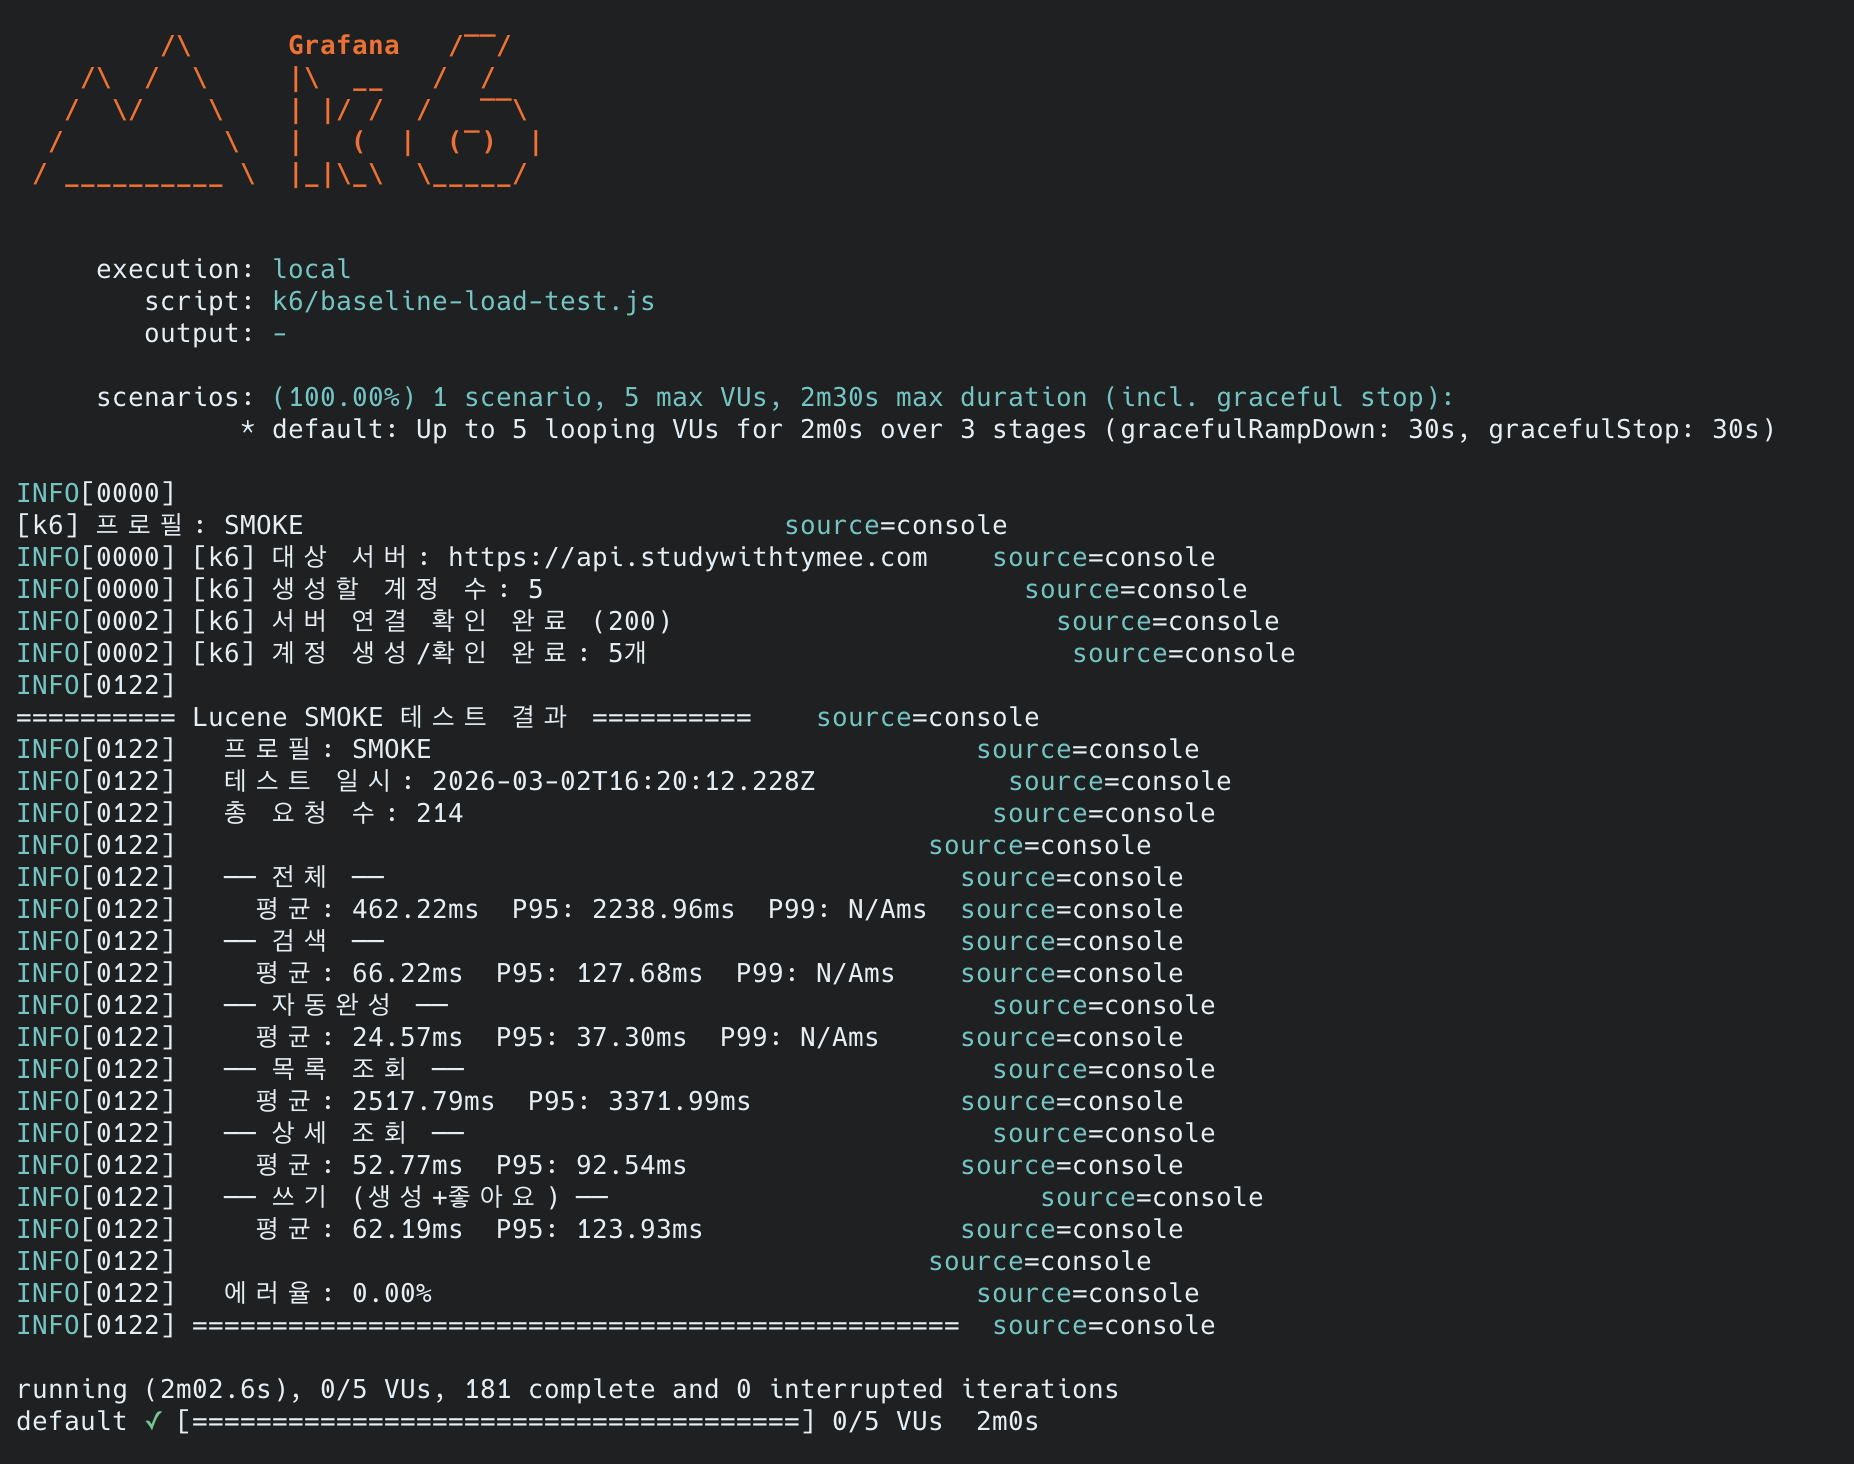
3. k6 smoke Before:
이전 글(Lucene 전환) 직후 측정한 smoke 결과를 baseline으로 사용합니다.
(lucene-decision — k6-smoke-result.png)
| 메트릭 | 검색 | 자동완성 | 최신 게시글 목록 | 상세 조회 | 쓰기 |
|---|---|---|---|---|---|
| 평균 | 66ms | 25ms | 2,518ms | 53ms | 62ms |
| P95 | 128ms | 37ms | 3,372ms | 93ms | 124ms |
| 전체 | 값 |
|---|---|
| 총 요청 수 | 214건 |
| 에러율 | 0.00% |
| 전체 P95 | 2,239ms |
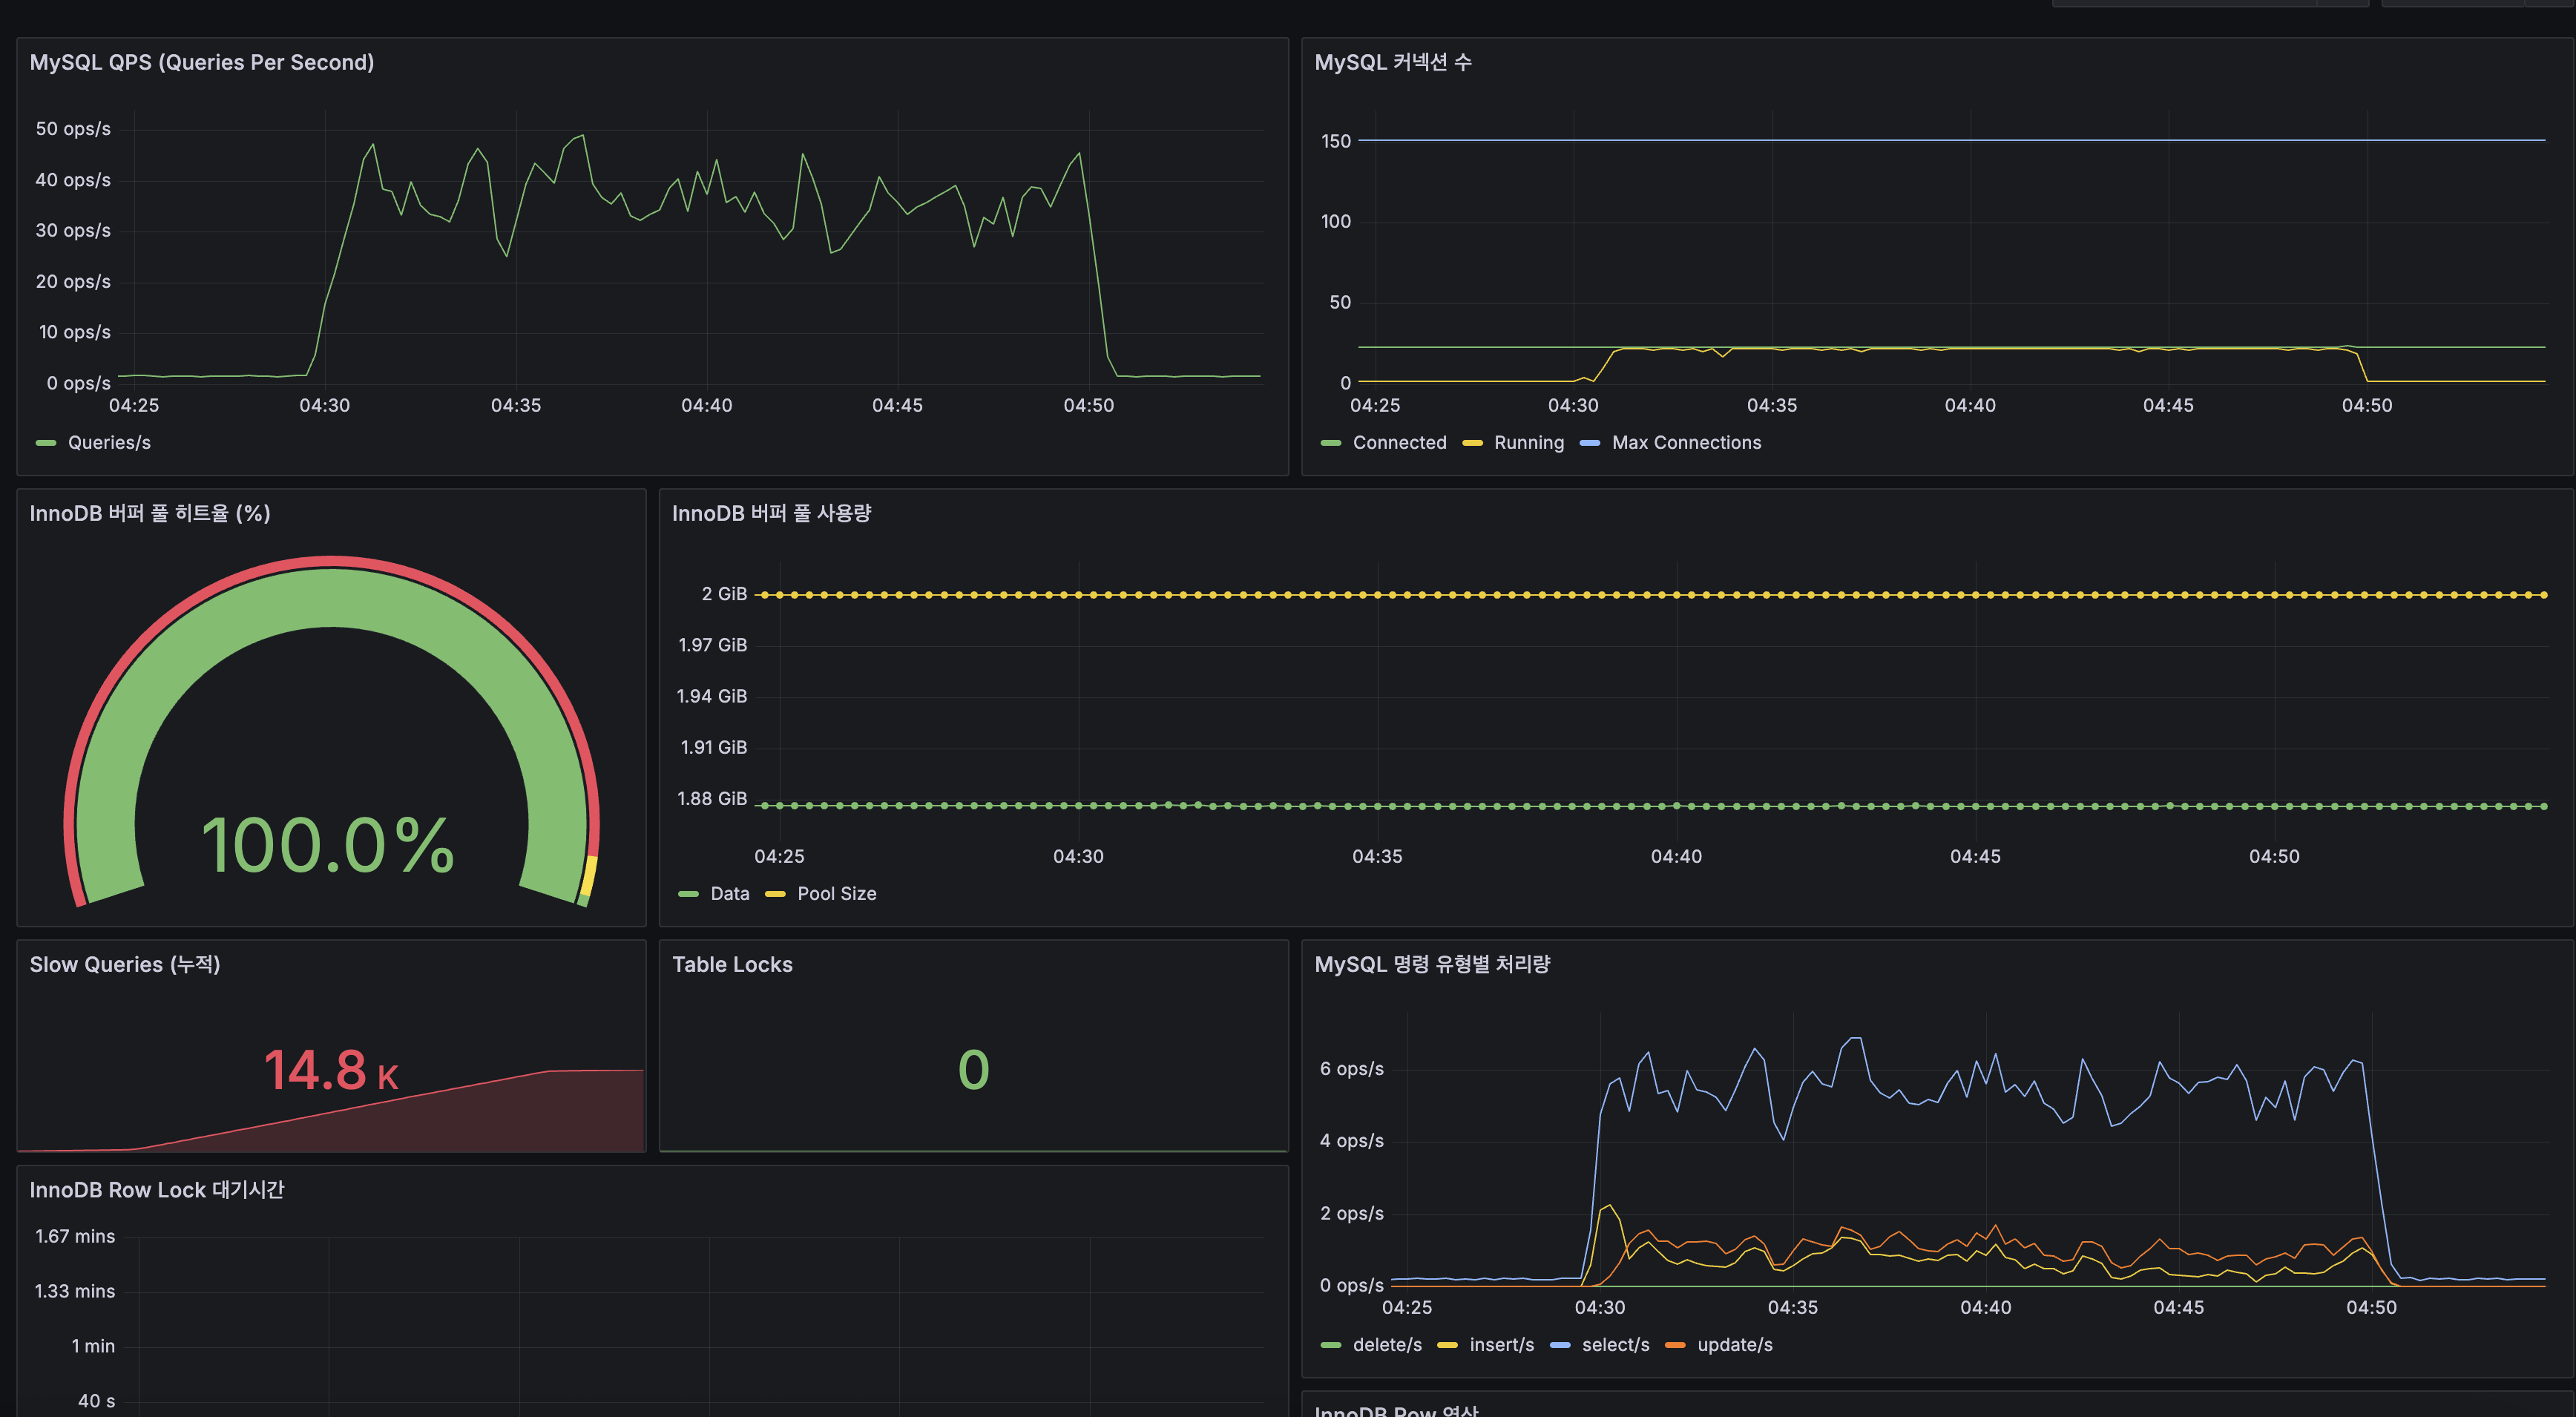
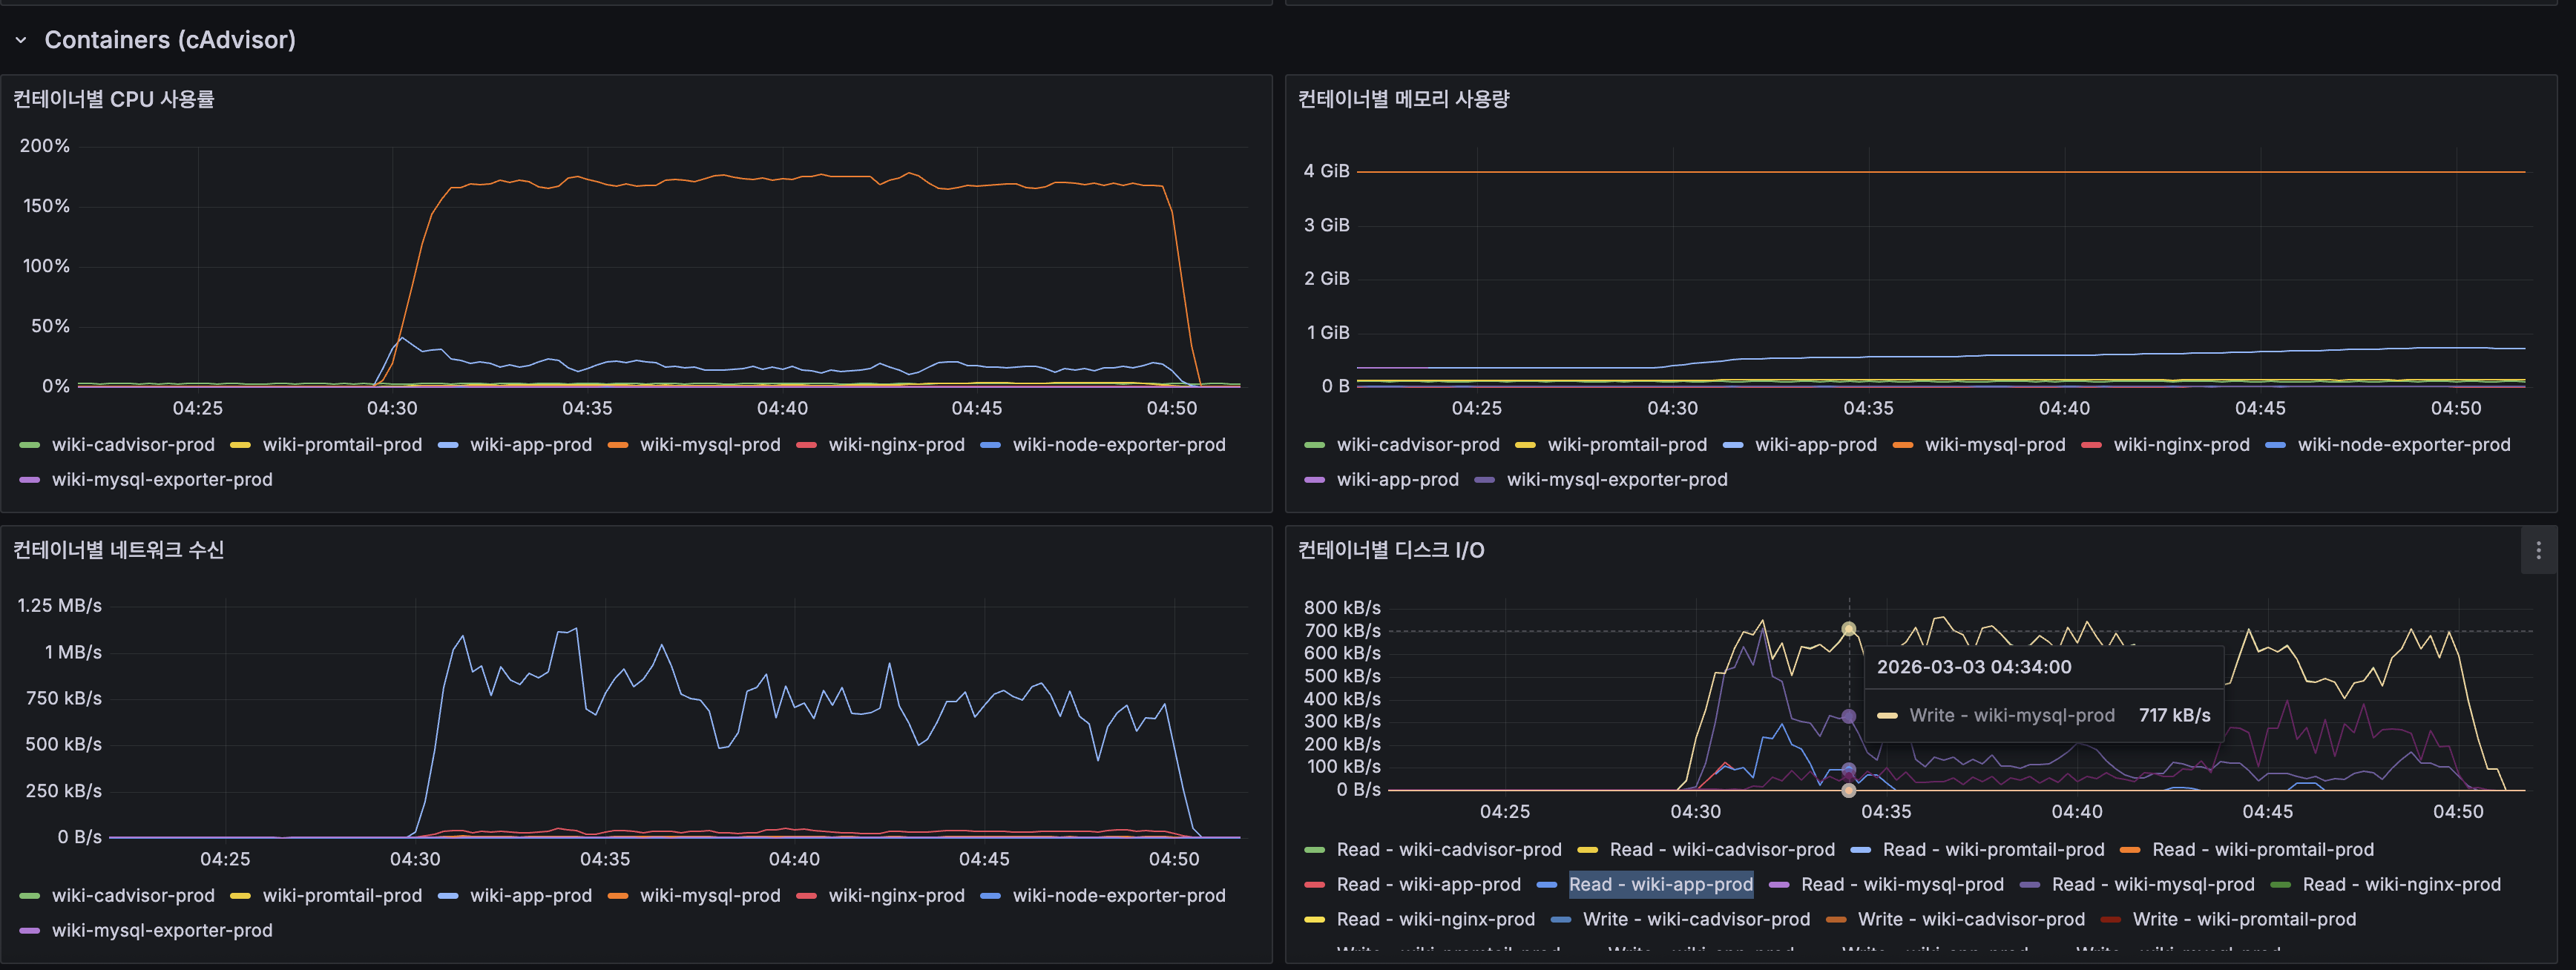
4. Grafana 스크린샷 (k6 load 중):
이전 글의 load 프로필(100 VU, 20분) 측정 시 Grafana 캡처를 baseline으로 사용합니다:
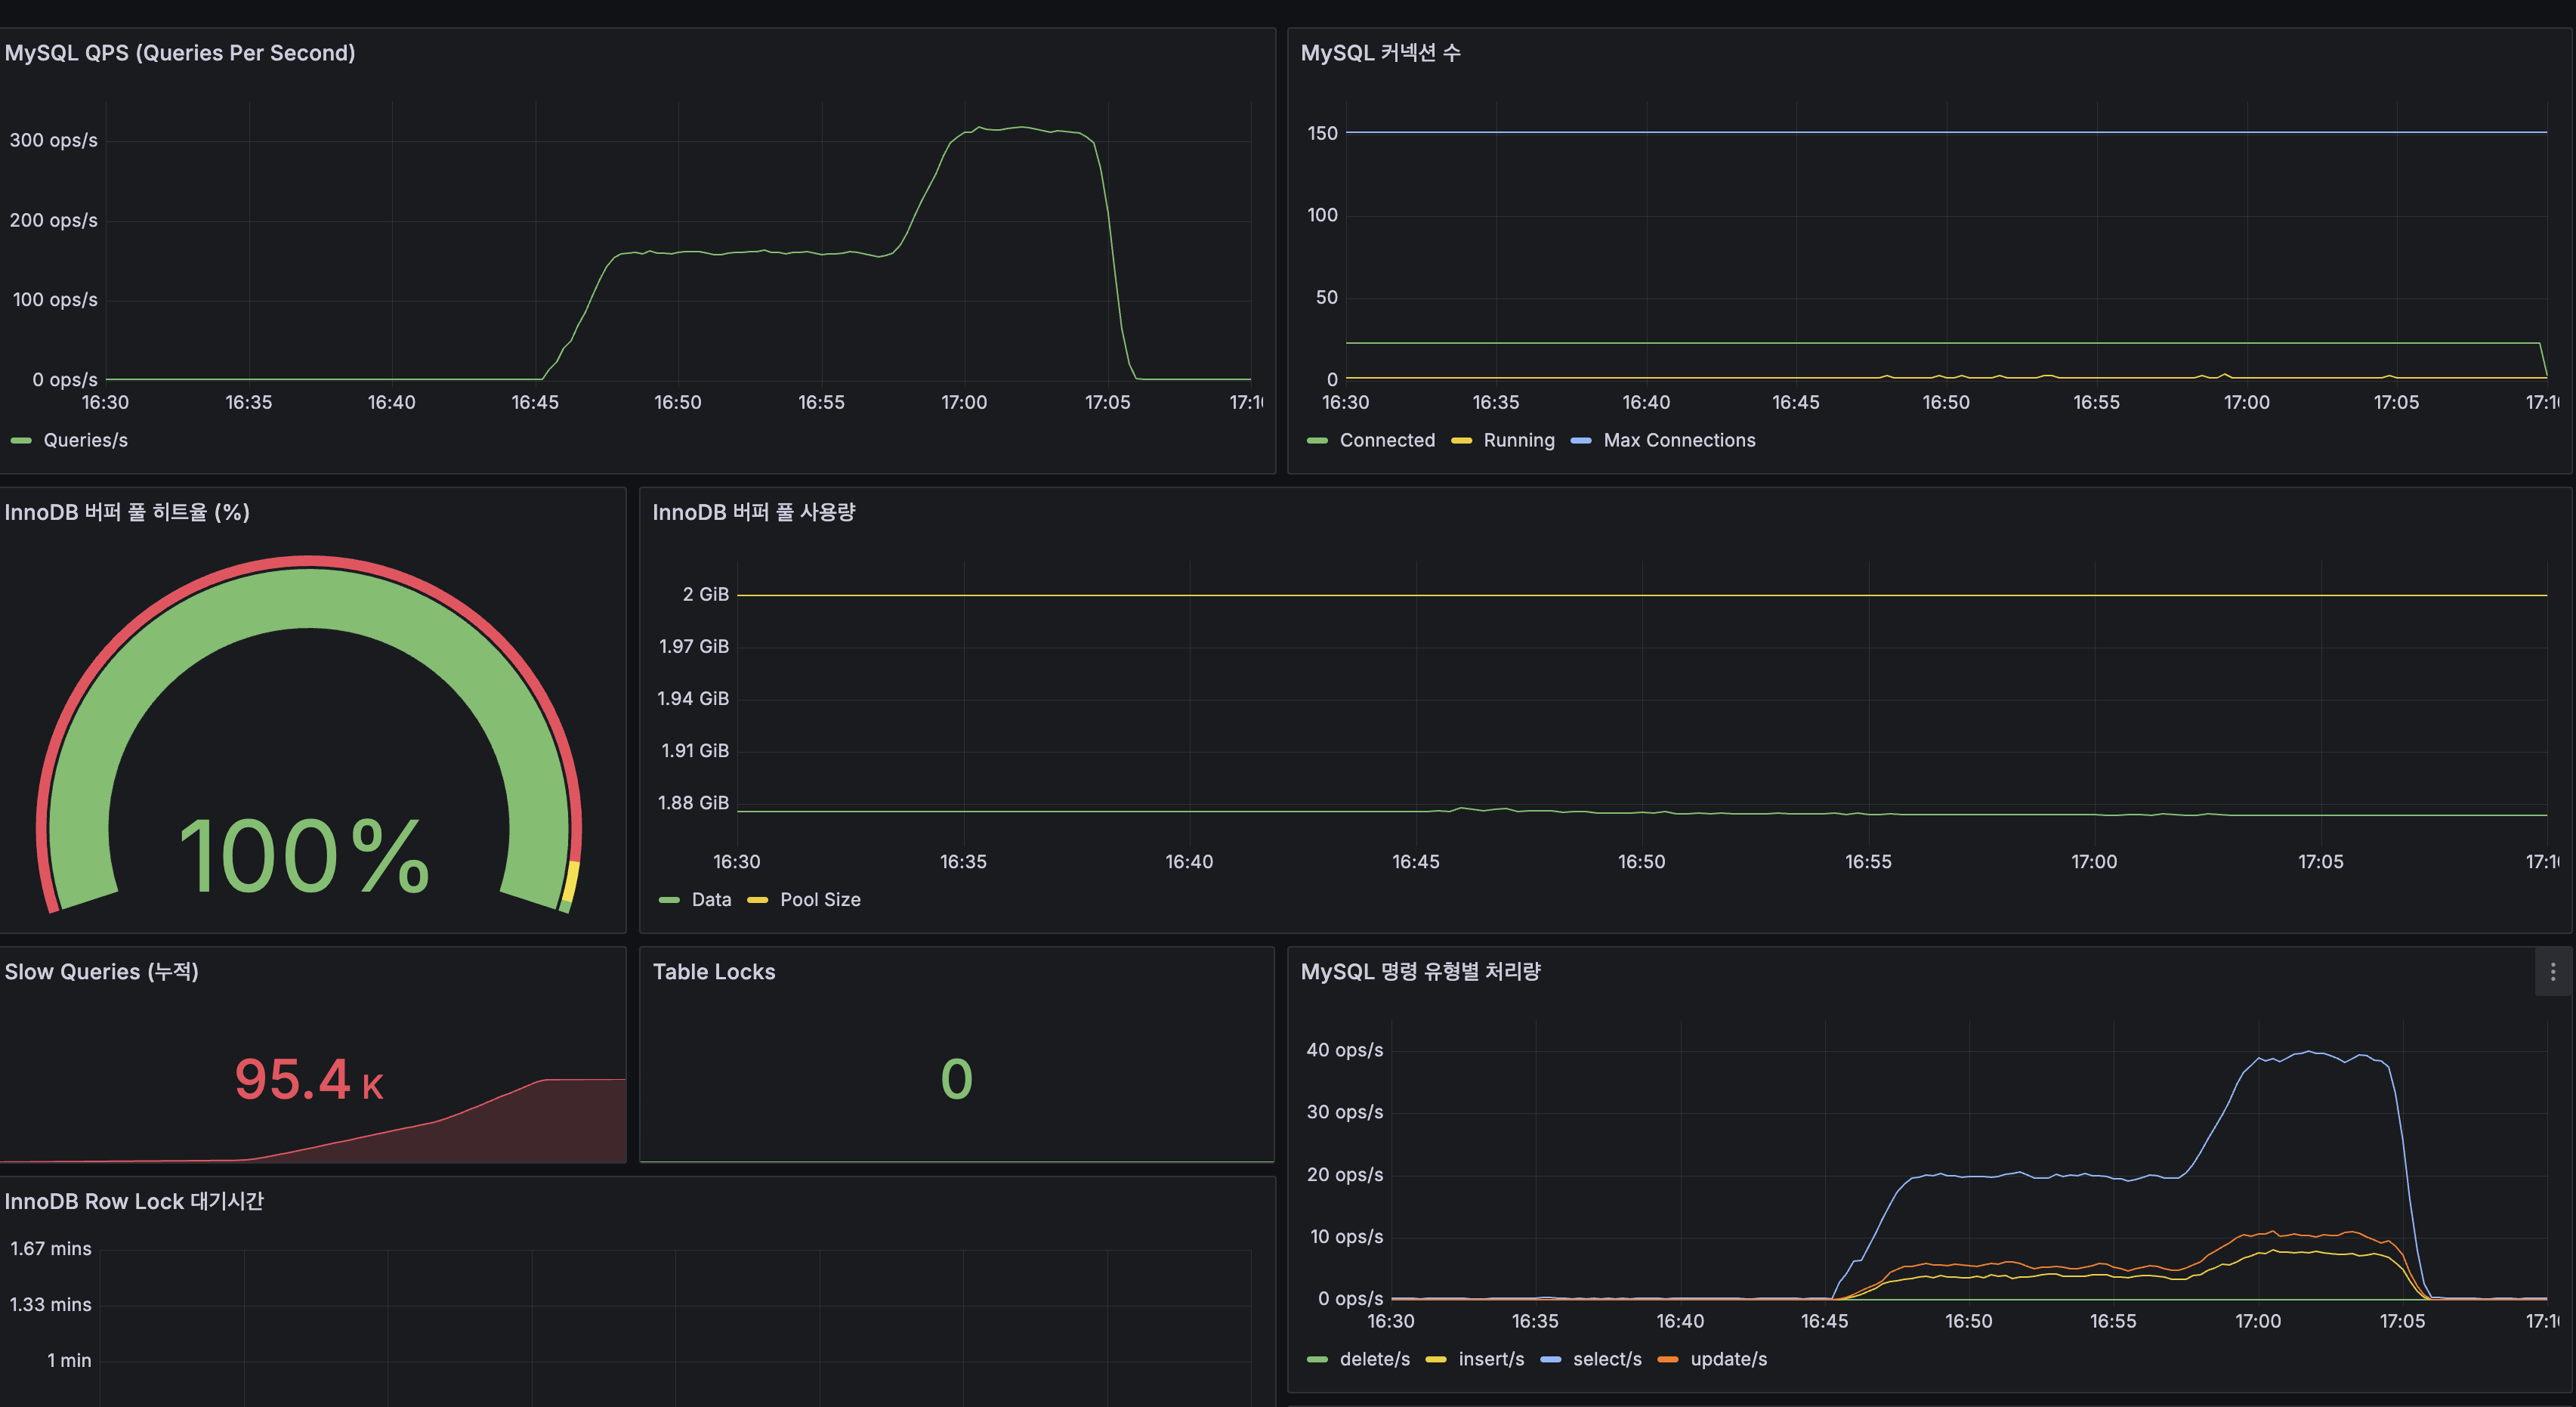
- MySQL 지표: Buffer Pool 히트율 100%, Slow Query 14.8K건, QPS 30~50
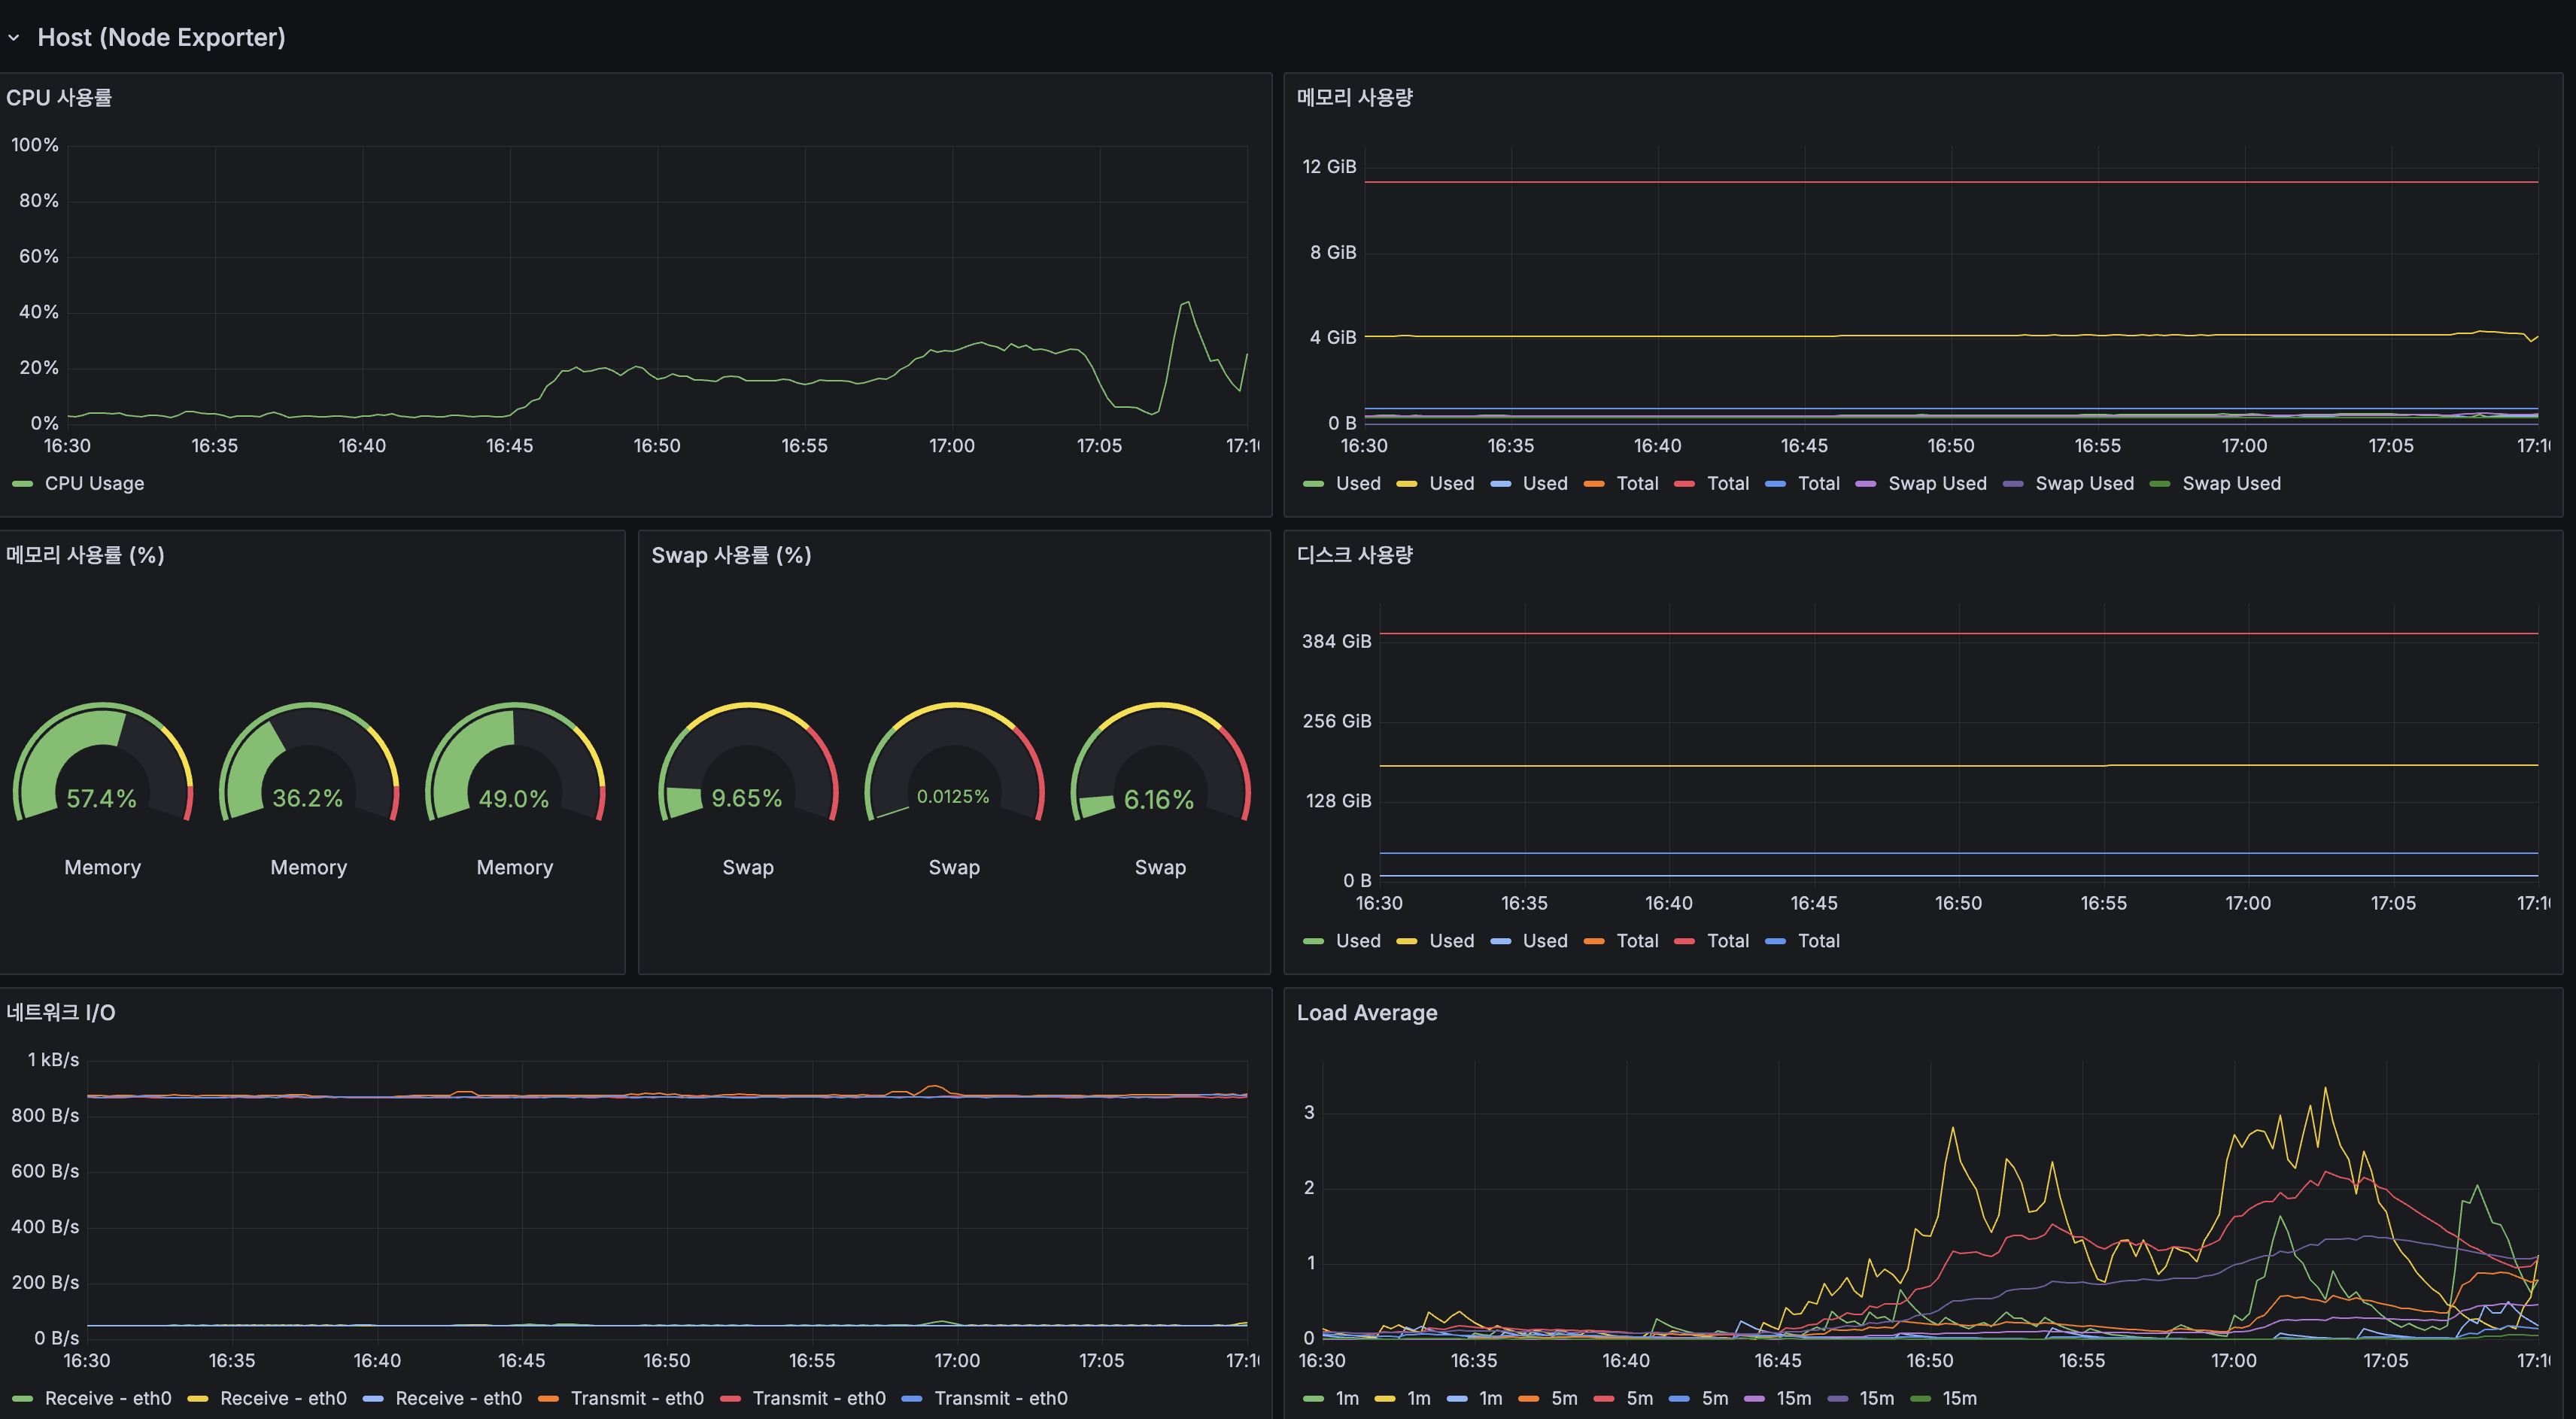
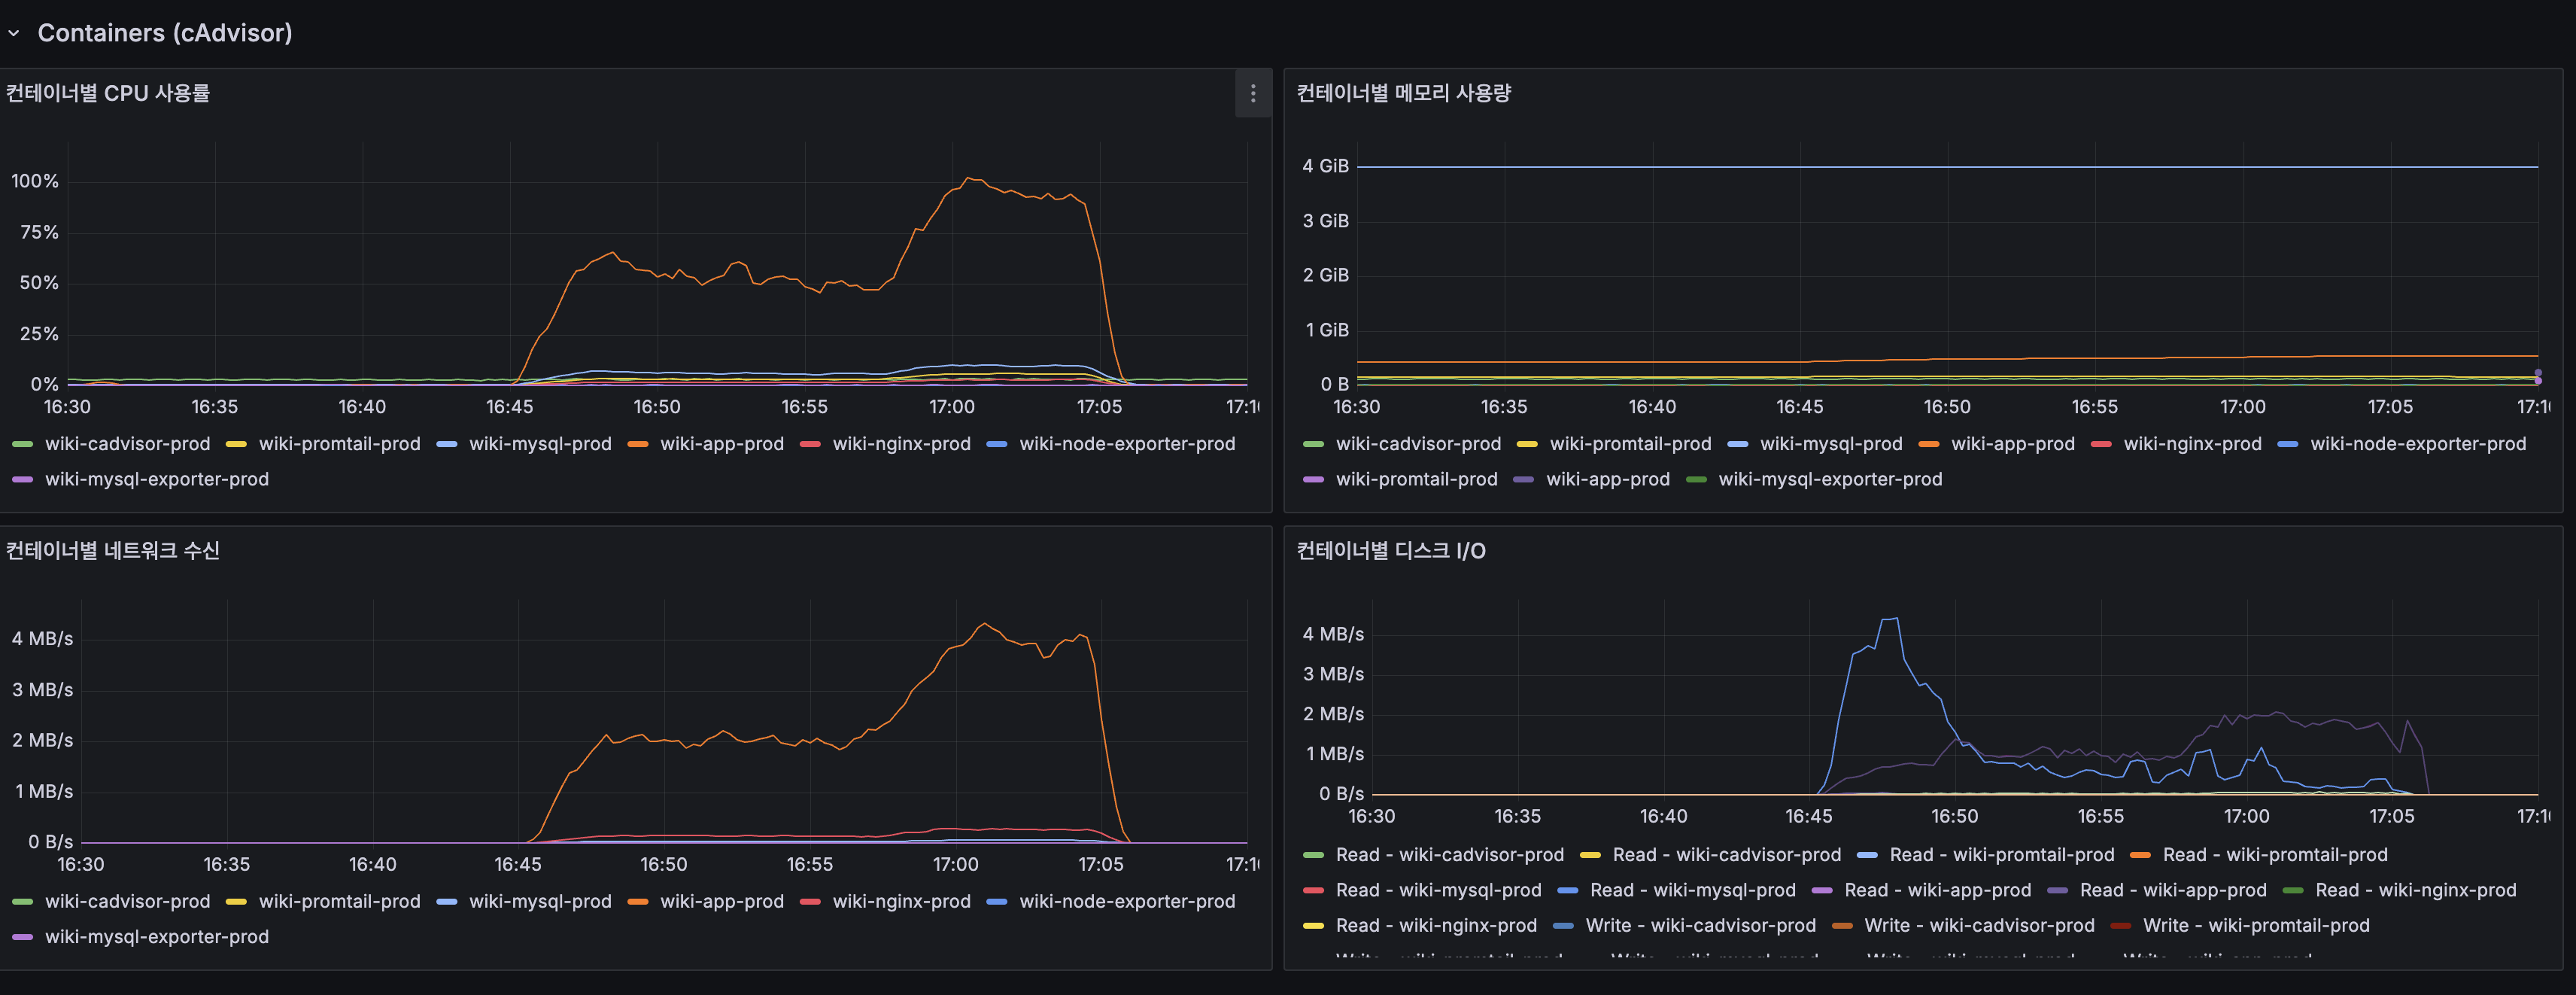
(lucene-decision — k6-load-mysql.png) - 컨테이너 리소스: System CPU 100% 포화, Load Average 20+
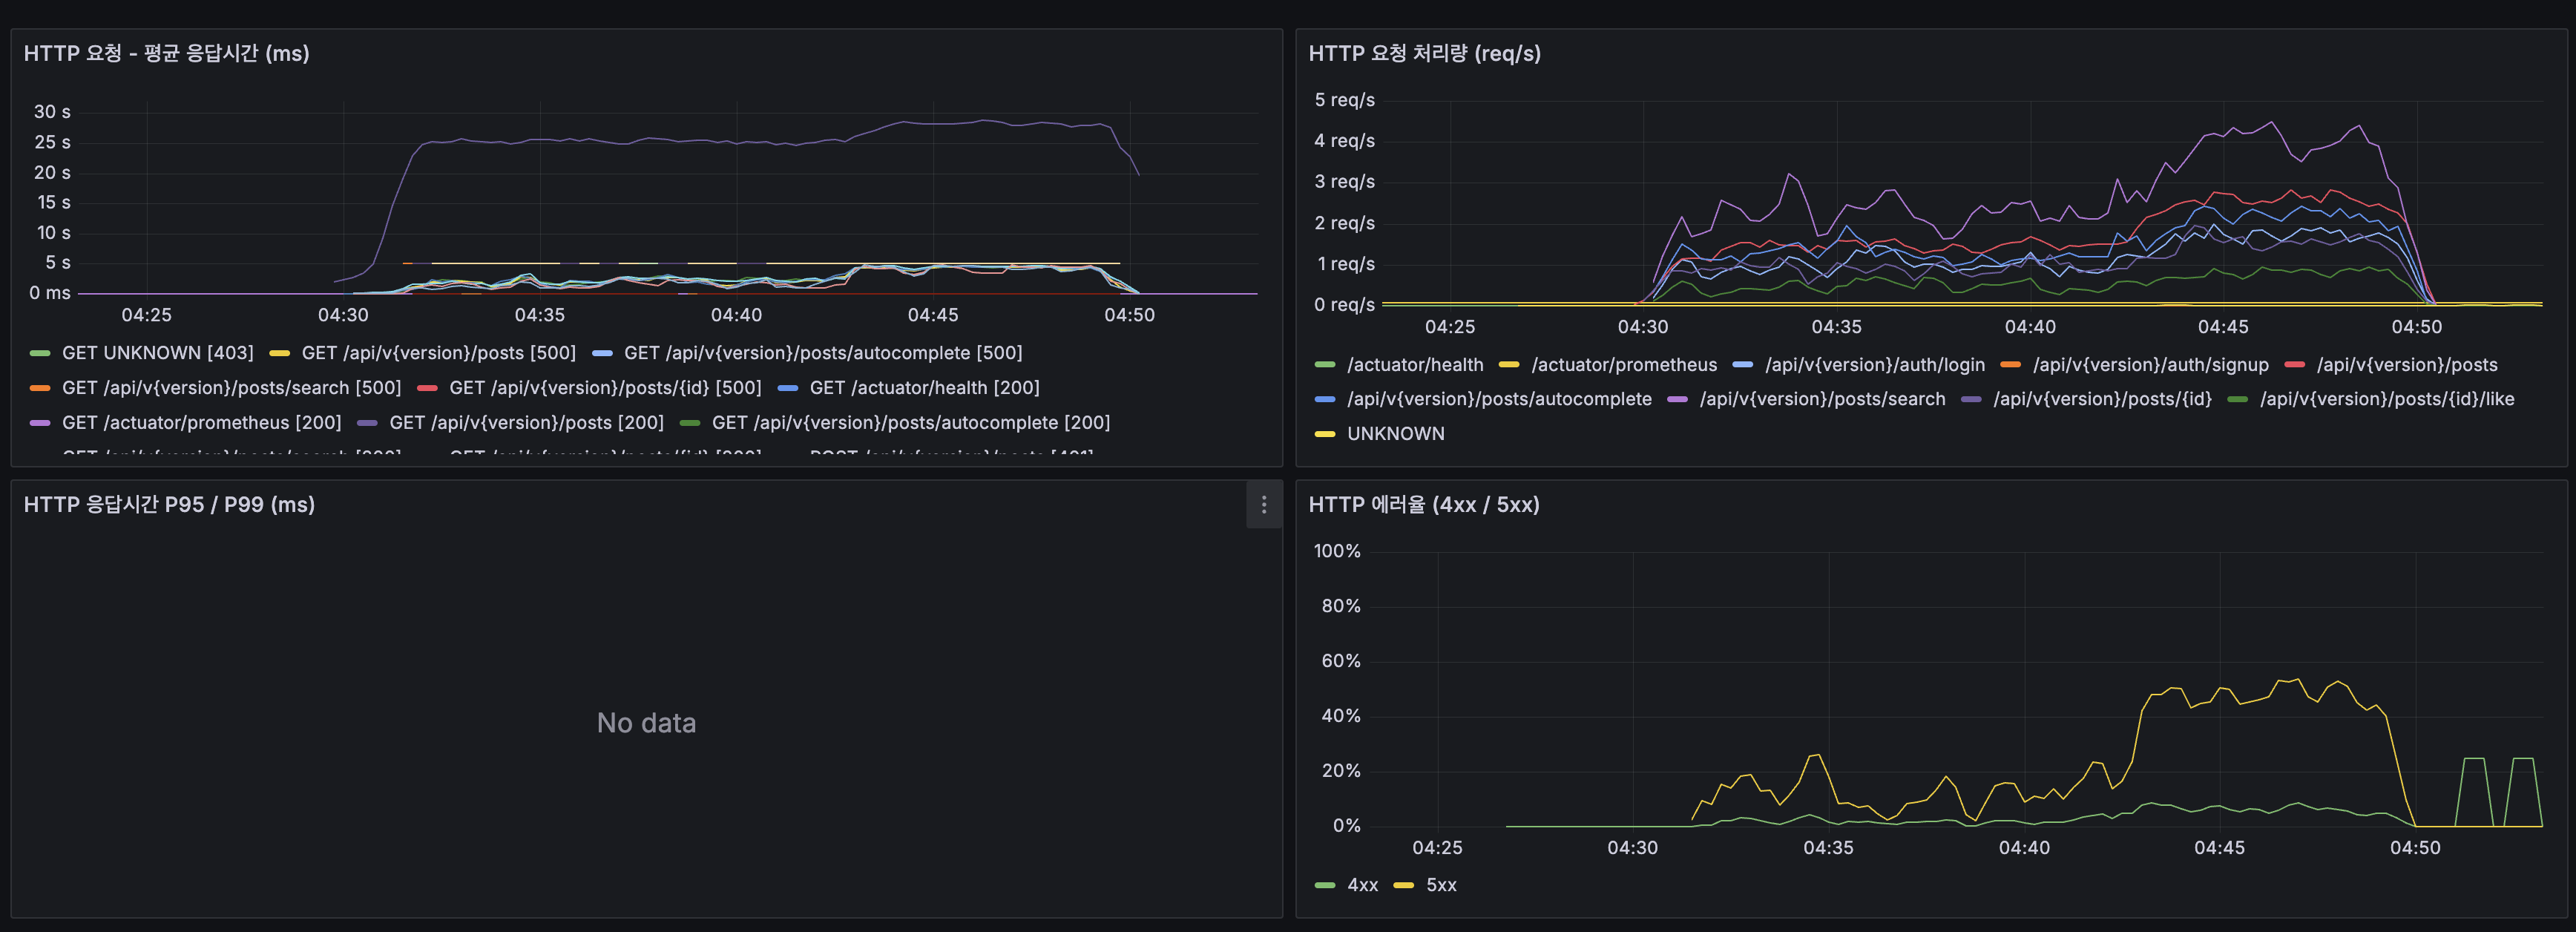
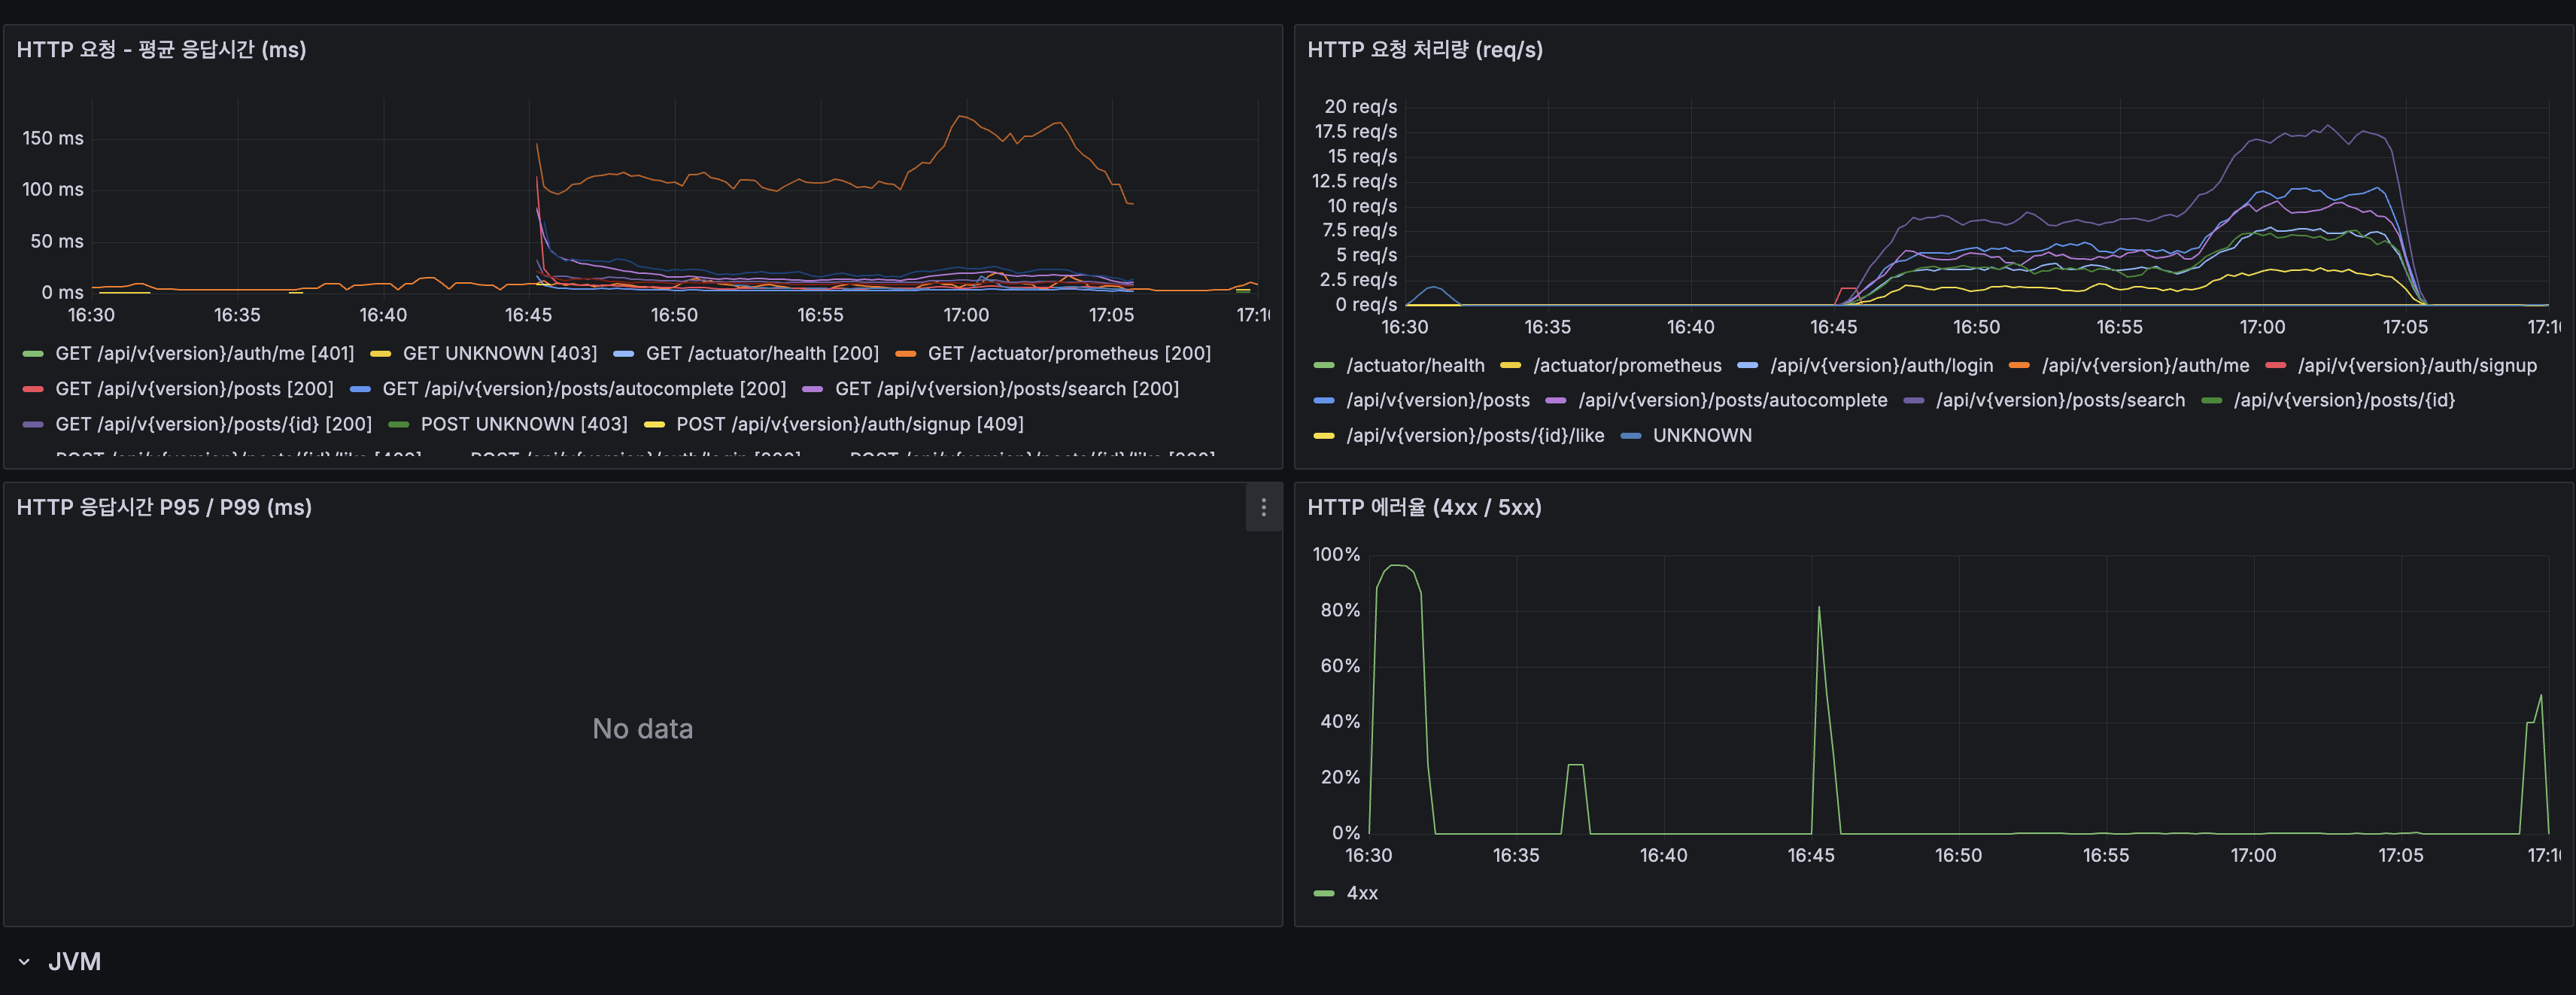
(lucene-decision — k6-load-containers.png) - Spring Boot HTTP: 스레드 20→120 폭증, 5xx 에러율 최대 40%
(lucene-decision — k6-load-springboot-http.png)
5. MySQL 상태:
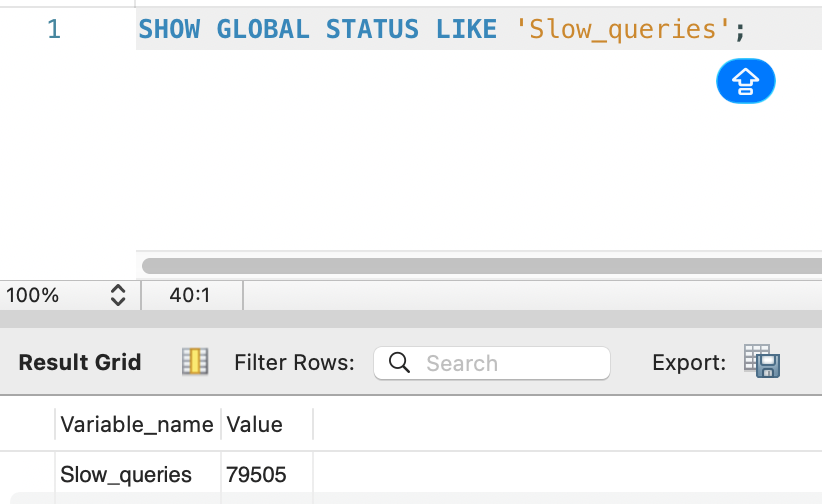
Slow_queries: 79505누적 Slow Query: 79,505건 (서버 시작 이후 전체 누적).
6. Deep OFFSET 실행 비용 (page 1000, Deferred Join 적용 상태):
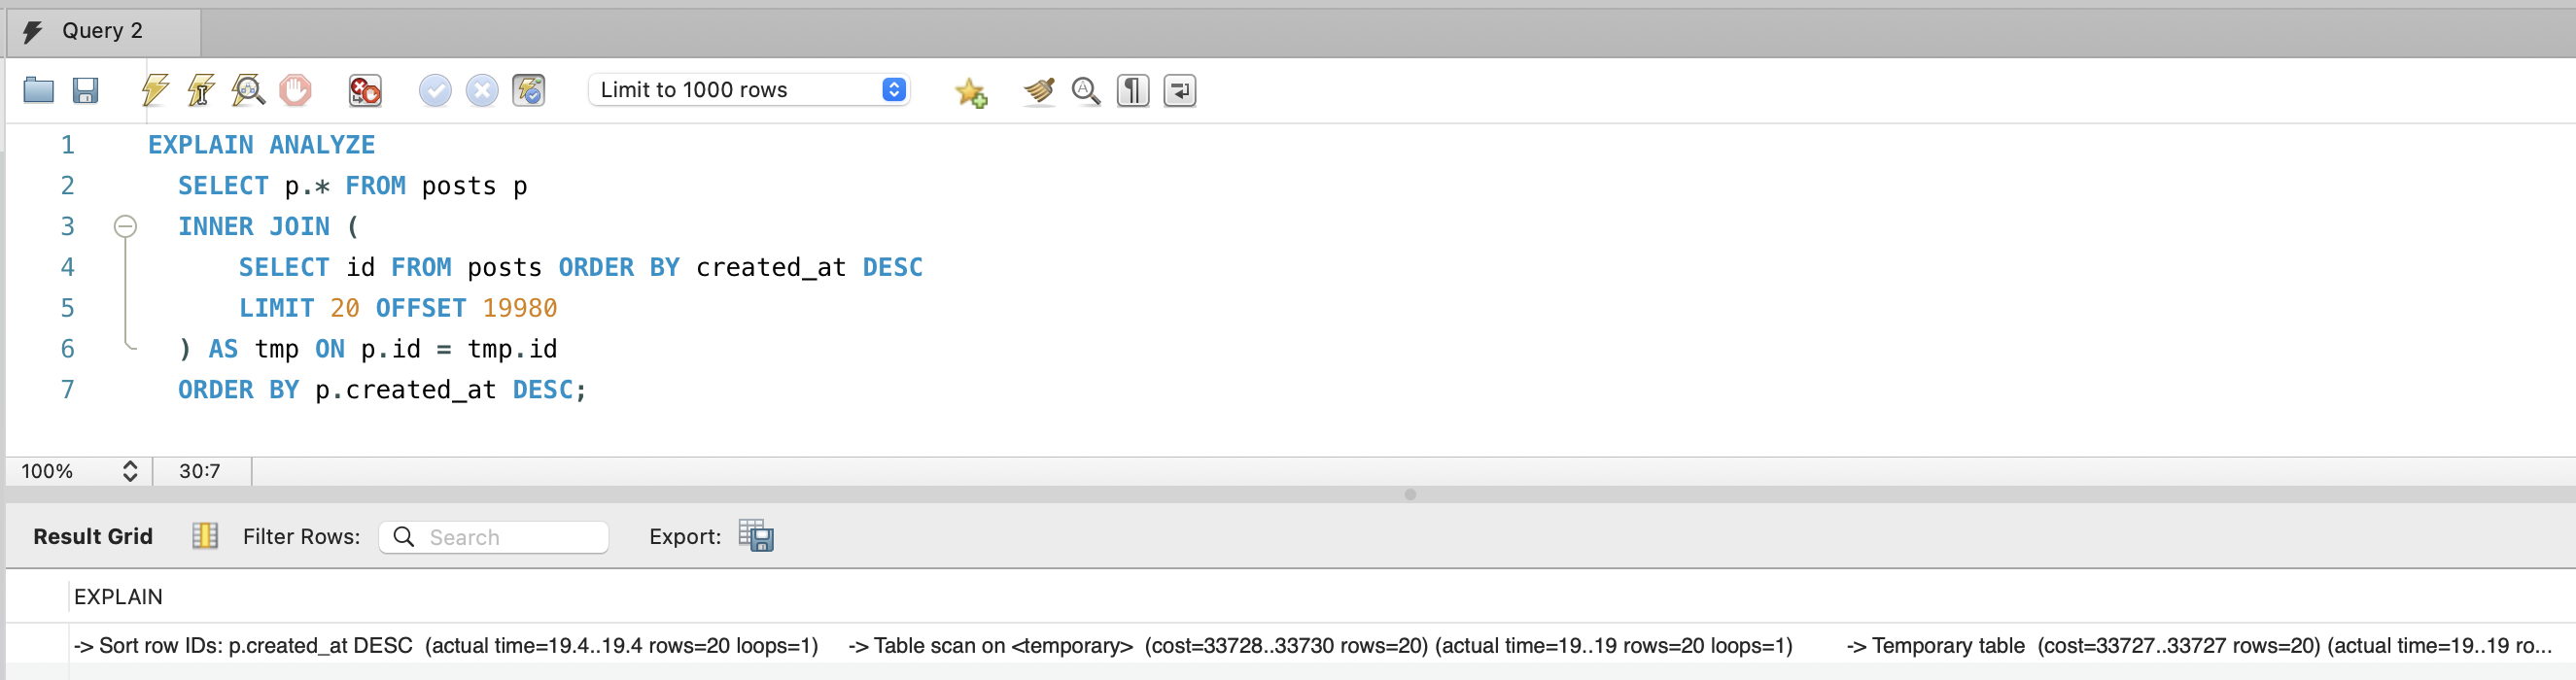
EXPLAIN ANALYZESELECT p.* FROM posts pINNER JOIN ( SELECT id FROM posts ORDER BY created_at DESC LIMIT 20 OFFSET 19980) AS tmp ON p.id = tmp.idORDER BY p.created_at DESC;-> Sort row IDs: p.created_at DESC (actual time=19.4..19.4 rows=20 loops=1) -> Nested loop inner join (actual time=11.2..18.5 rows=20 loops=1) -> Table scan on tmp (actual time=6.62..6.63 rows=20 loops=1) -> Materialize (actual time=6.62..6.62 rows=20 loops=1) -> Limit/Offset: 20/19980 row(s) (actual time=6.61..6.61 rows=20 loops=1) -> Covering index scan on posts using idx_posts_created_at (cost=13774 rows=20000) (actual time=2.48..5.75 rows=20000 loops=1) -> Single-row index lookup on p using PRIMARY (id=tmp.id) (cost=0.997 rows=1) (actual time=0.586..0.586 rows=1 loops=20)핵심: Deferred Join 덕분에 page 1000(OFFSET 19,980)도 19.4ms에 완료됩니다.
Covering Index(idx_posts_created_at)만 스캔하여 20,000행을 읽고(5.75ms), PK로 20건만 클러스터 조회(0.586ms×20).
page 30(OFFSET 580)이면 600행만 스캔하므로 사실상 무시할 수준입니다. 페이지 제한은 성능보다 UX 관점의 결정입니다.
변경 후 API 응답 검증
1. Slice 응답 확인 (GET /api/v1.0/posts?page=0&size=20):
{ "empty": false, "first": true, "last": false, "number": 0, "numberOfElements": 20, "size": 20, "pageable": { "offset": 0, "pageNumber": 0, "pageSize": 20, "paged": true }}totalElements, totalPages 필드 완전 제거됨. COUNT(*) 쿼리가 더 이상 실행되지 않습니다.
2. 페이지 제한 확인 (GET /api/v1.0/posts?page=11&size=20):
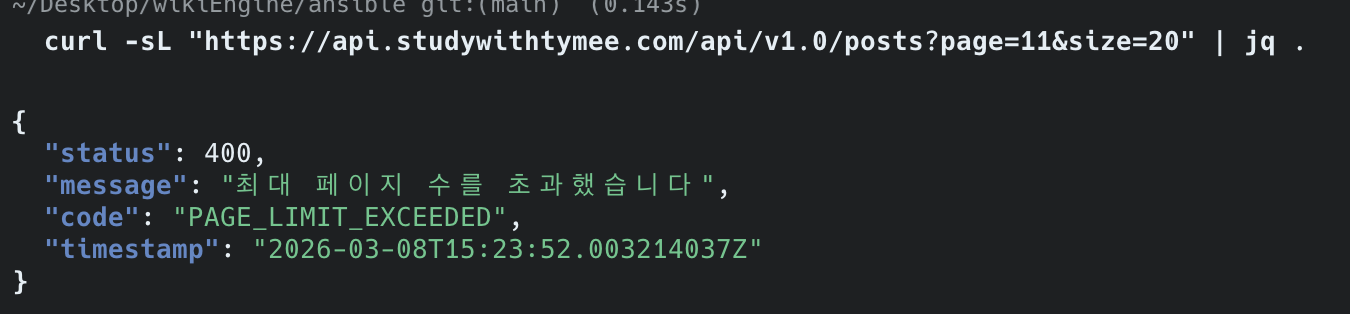
{ "status": 400, "message": "최대 페이지 수를 초과했습니다", "code": "PAGE_LIMIT_EXCEEDED", "timestamp": "2026-03-08T15:23:52.003214037Z"}page=31(0-indexed, 즉 32번째 페이지) 요청 시 MAX_LIST_PAGE = 30을 초과하여 400 에러 반환합니다. 정상 동작 확인.
(스크린샷은 초기 테스트 시 MAX_LIST_PAGE=10일 때 page=11로 캡처)
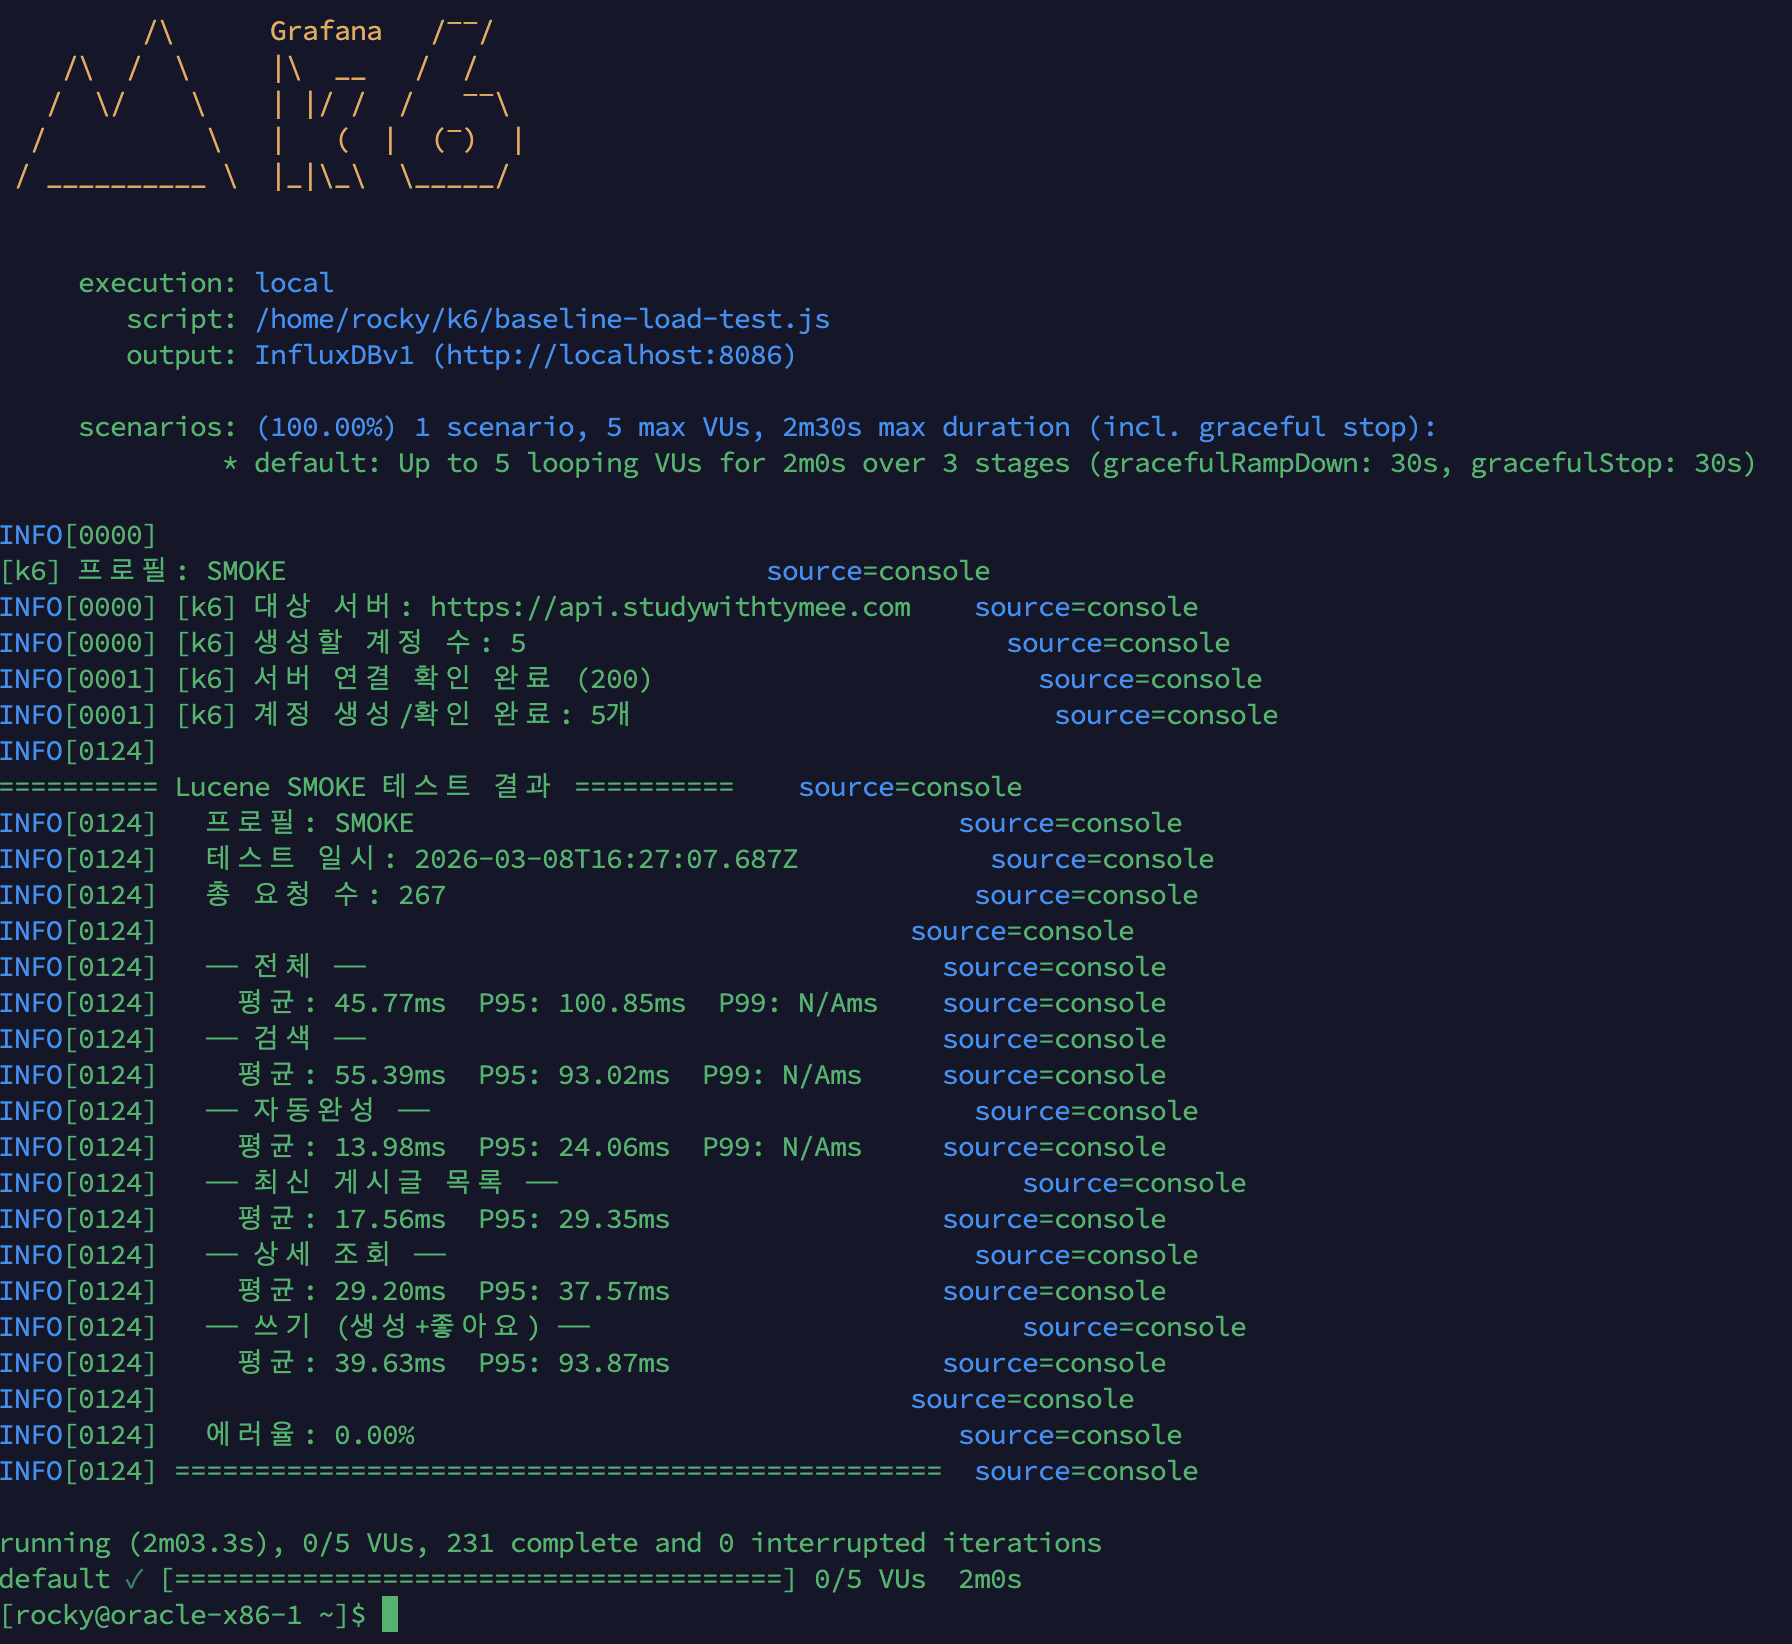
k6 smoke (5 VU, 2분) 변경 전후 비교
ARM 2코어, Spring Boot JVM 1GB, MySQL InnoDB BP 2GB
| 시나리오 | Before (Deferred Join만) | After (+ 페이지 30 제한 + COUNT 제거) | 개선율 |
|---|---|---|---|
| 검색 | 66ms | 55.39ms | -16% |
| 자동완성 | 25ms | 13.98ms | -44% |
| 최신 게시글 목록 | 2,518ms | 17.56ms | -99.3% |
| 상세 조회 | 53ms | 29.20ms | -45% |
| 쓰기 | 62ms | 39.63ms | -36% |
| 에러율 | 0.00% | 0.00% | - |
참고: 테스트 경로 차이
Before는http://내부IP:8080(앱서버 직접), After는https://api.studywithtymee.com(nginx + SSL 경유).
After가 네트워크 홉이 더 많은데도 빠르므로, 실제 백엔드 개선은 수치보다 더 큽니다.
검색·자동완성·상세 조회 등 변경하지 않은 시나리오도 빨라진 이유는,
COUNT(*) + deep OFFSET이 사라지면서 MySQL 커넥션/CPU 경합이 해소된 연쇄 효과입니다.
왜 최신 게시글 목록이 99.3% 감소했는가?
Before(2,518ms)에는 세 가지 병목이 겹쳐 있었습니다:
-
COUNT(*) 제거 (→ -2,038ms): 매 요청마다 1,477만 행 Full Table Scan으로
totalElements를 구했습니다.Page<T>→Slice<T>전환으로 이 쿼리가 완전히 사라졌습니다. 단일 요청 기준으로 2,518ms 중 ~2,038ms가 COUNT(*)였으므로 80%는 이것만으로 제거. -
Deep OFFSET 제거 (→ 최대 page 30): Before k6는 30% 확률로 page 100~1000(OFFSET 2,000~20,000)을 요청했습니다. OFFSET이 클수록 세컨더리 인덱스 → 클러스터 인덱스 랜덤 I/O가 비례 증가합니다. page 30 제한으로 최대 OFFSET이 580으로 줄었습니다.
-
Deferred Join 효과 극대화: page 0~30 범위에서는 서브쿼리가 Covering Index(
idx_posts_created_at)만 스캔하여 PK 20개를 추출하고, 외부 쿼리가 클러스터 인덱스에서 정확히 20행만 읽습니다. OFFSET이 작을수록 Deferred Join의 효율이 극대화됩니다.
| 병목 | Before 기여분 | After |
|---|---|---|
| COUNT(*) | ~2,038ms | 0ms (Slice) |
| Deep OFFSET (page 100~1000) | ~300~500ms (30% 확률) | 0ms (page 30 제한) |
| Deferred Join (page 0~30) | ~50ms | ~18ms |
| 합계 | ~2,518ms | ~18ms |
k6 load (100 VU, 20분) 변경 전후 비교
ARM 2코어, Spring Boot JVM 1GB, MySQL InnoDB BP 2GB
| 시나리오 | Before | After | 개선율 |
|---|---|---|---|
| 검색 평균 / P95 | 3,328ms / 5,010ms | 20.51ms / 54.95ms | -99.4% |
| 자동완성 평균 / P95 | 3,339ms / 5,008ms | 5.91ms / 14.33ms | -99.8% |
| 최신 게시글 목록 평균 / P95 | 19,424ms / 28,987ms | 8.33ms / 19.01ms | -99.96% |
| 상세 조회 평균 / P95 | 3,345ms / — | 15.06ms / 28.80ms | -99.6% |
| 쓰기 평균 / P95 | — | 19.05ms / 48.84ms | — |
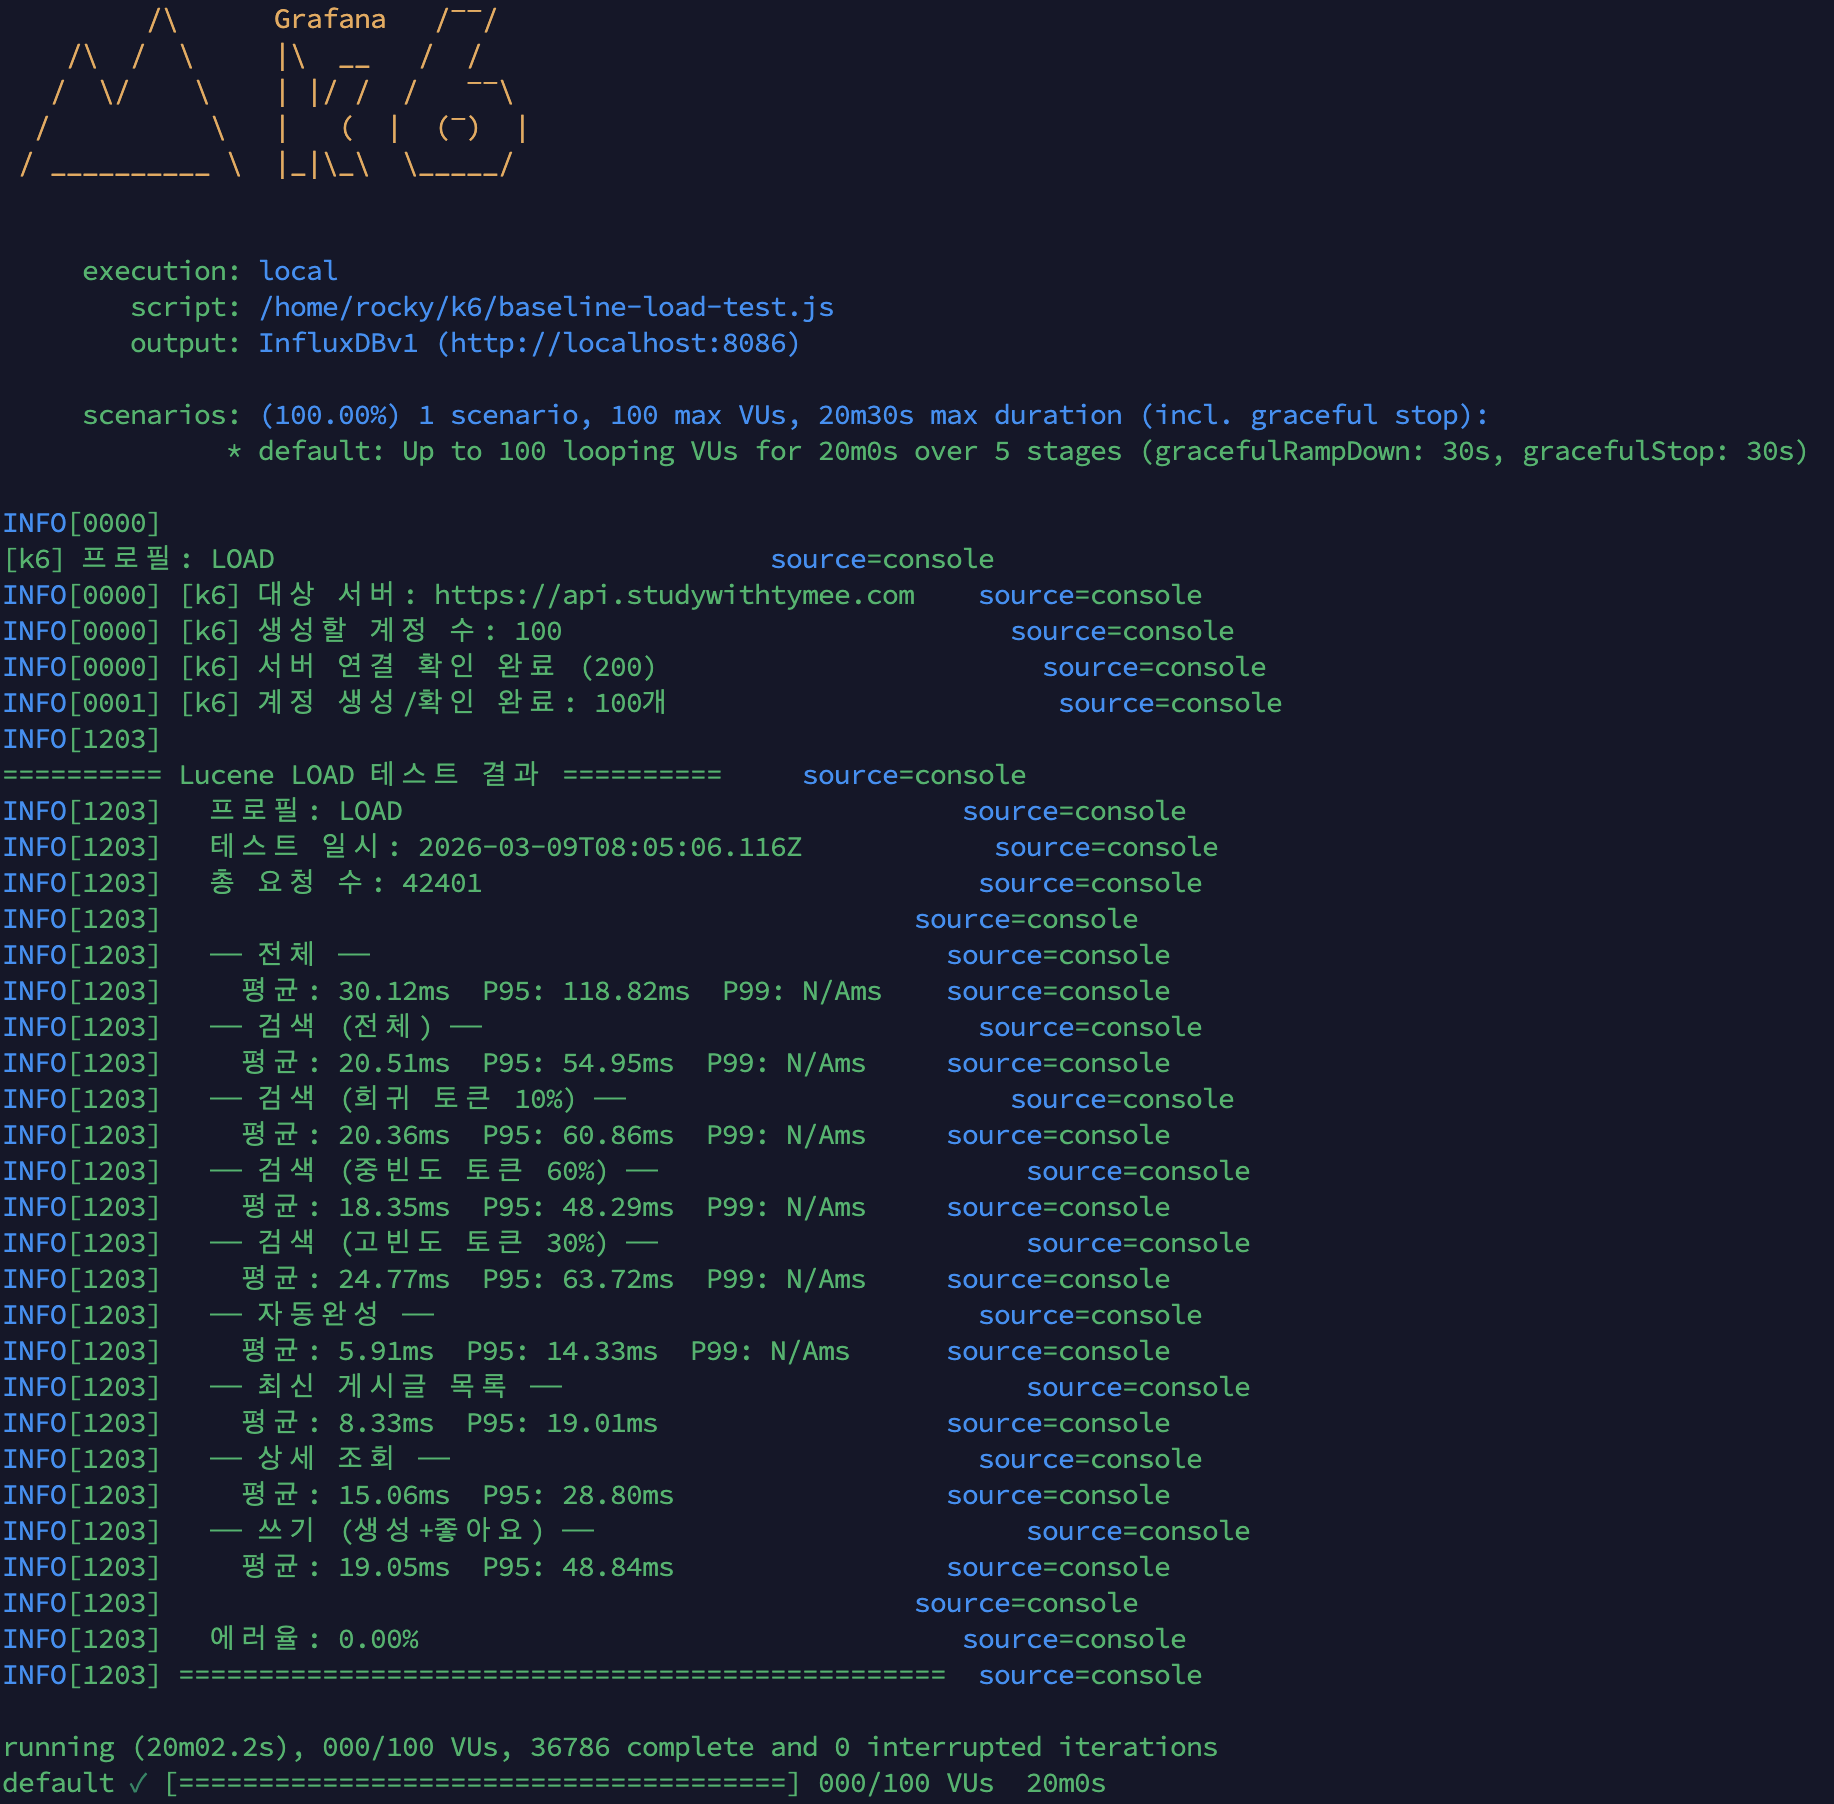
| 전체 평균 / P95 / P99 | — | 30.12ms / 118.82ms / 228ms | — |
| 총 요청 수 | — | 42,401건 | — |
| 에러율 | 32.53% | 0.00% | 에러 완전 해소 |
왜 페이징만 고쳤는데 검색·자동완성·상세 조회도 99% 개선인가?
Before의 검색 3,328ms는 검색 자체가 느린 게 아닙니다. smoke(5 VU)에서 검색은 66ms, 자동완성은 25ms였습니다. load(100 VU)에서 최신 게시글 목록의 deep OFFSET(OFFSET 20,000)이 2코어 CPU를 100% 포화시키면서, 같은 서버의 모든 요청이 CPU 대기열에 갇힌 것입니다. 즉 Before 3,328ms = 검색 본연의 비용(~20ms) + CPU 포화 대기 시간(~3,300ms)입니다.페이징 쿼리를 고쳐 CPU 포화가 해소되자, 나머지 API는 원래 속도로 복귀했습니다. 이것이 단일 병목이 전체 시스템을 무너뜨리는 연쇄 장애(cascade failure) 패턴이며, 병목 하나를 제거하면 전체가 살아나는 이유입니다.
검색 빈도별 성능 비교 (load 테스트)
k6 스크립트에서 검색어를 빈도별로 분류하여 Lucene posting list 길이에 따른 성능 차이를 측정했습니다:
| 빈도 | 비율 | 평균 | P95 | 특성 |
|---|---|---|---|---|
| 희귀 토큰 | 10% | 20.36ms | 60.86ms | posting list 짧음, 캐시 miss 위주 |
| 중빈도 토큰 | 60% | 18.35ms | 48.29ms | 일반 사용자 검색 패턴 |
| 고빈도 토큰 | 30% | 24.77ms | 63.72ms | posting list 길음, 스트레스 |
고빈도 토큰(대한민국, 역사 등)이 중빈도 대비 평균 35% 느립니다.
posting list가 길수록 더 많은 문서를 스코어링해야 하므로 Lucene의 구조적 특성입니다.
다만 고빈도에서도 P95 63.72ms로 충분히 빠르며, 부하 테스트 기준 SLA(P95 < 300ms)를 여유있게 충족합니다.
Grafana 대시보드: k6
- 평균 응답시간 30.1ms, P95 119ms, P99 228ms
- 처리량: 평균 17.6 req/s, 피크 58.8 req/s (100 VU 구간)
- 동시 사용자: 최대 100 VU
- 에러율: 0%
MySQL 지표 비교
| MySQL 지표 | Before | After | 변화 |
|---|---|---|---|
| QPS (피크) | 30~50 | ~300 | 6배 증가 (CPU 여유로 더 많은 쿼리 처리) |
| InnoDB Buffer Pool 히트율 | 100% | 100% | 동일 (디스크 I/O 없음) |
| Slow Queries (누적) | 79,505건 | 95,400건 | +15,895건 (smoke+load 합산) |
| Table Locks | — | 0 | 락 경합 없음 |
QPS 6배 증가: Before에서는 CPU 포화로 30~50 QPS가 한계였지만, After에서는 CPU 여유가 생기면서 동일 100 VU에서 ~300 QPS를 처리합니다.
인프라 지표 비교
| 인프라 지표 | Before | After | 변화 |
|---|---|---|---|
| Host CPU (피크) | 100% (포화) | ~35% | CPU 포화 해소 |
| Load Average (1m) | 20+ | ~3 | 85% 감소 |
| App Container CPU | 100% | ~90% (피크) | 여유 확보 |
| JVM 스레드 수 | 20→120 | 28→34 | 스레드 폭증 해소 |
Spring Boot 지표
| Spring Boot 지표 | Before | After | 변화 |
|---|---|---|---|
| JVM Heap | OldGen 증가 추세 | 안정 (1 GiB 내) | 메모리 압박 해소 |
| GC Pause | — | ~1ms | 정상 |
| HikariCP Active | 20 (풀 고갈) | 20 (정상 사용) | Pending 0 |
| HikariCP Acquire Time | — | 0.03~0.05ms | 커넥션 즉시 획득 |
| App CPU | 100% | ~60% | 40% 여유 |
| System CPU | 100% | ~70% (피크) | 30% 여유 |
7. 검색 API도 Slice로 전환 + Snippet 반환
배경
위의 섹션까지는 최신 게시글 목록 조회(GET /posts) 최적화였습니다.
검색 API(GET /posts/search)는 “Lucene totalHits라 COUNT 문제 없음”으로 Page<T>를 유지했습니다.
하지만 이후 총 건수 표시를 제거하고 totalPages를 15로 cap하면서, Page를 유지할 이유가 사라졌습니다:
totalHits는 추정치 (정확하지 않음)- 총 건수를 UI에 표시하지 않음
- totalPages cap 로직이 추가로 필요 (불필요한 복잡도)
변경 사항
1) 검색 API: Page<Post> → Slice<PostSearchResponse>
// Beforepublic Page<Post> search(String keyword, Pageable pageable) { Page<Post> result = luceneSearchService.search(keyword, pageable); long maxAccessible = (long) MAX_SEARCH_PAGE * pageable.getPageSize(); if (result.getTotalElements() > maxAccessible) { return new PageImpl<>(result.getContent(), pageable, maxAccessible); } return result;}
// After — totalHits 계산 제거, cap 로직 제거, snippet 변환public Slice<PostSearchResponse> search(String keyword, Pageable pageable) { Slice<Post> result = luceneSearchService.search(keyword, pageable); List<PostSearchResponse> responses = result.getContent().stream() .map(PostSearchResponse::from) .toList(); return new SliceImpl<>(responses, pageable, result.hasNext());}LuceneSearchService도 limit + 1 패턴으로 hasNext만 판단:
// limit + 1 조회하여 hasNext 판단 (Slice 패턴)TopDocs topDocs = searcher.search(query, offset + limit + 1);boolean hasNext = topDocs.scoreDocs.length > offset + limit;return new SliceImpl<>(posts, pageable, hasNext);2) Snippet: content(LONGTEXT) 대신 150자 요약 반환
기존에는 검색 결과 20건에 content(LONGTEXT, 평균 ~13KB)를 통째로 전송했습니다.
프론트에서는 제목만 표시하고 content는 버리고 있었으므로 20건 × 13KB = ~260KB가 낭비였습니다.
public record PostSearchResponse( Long id, String title, String snippet, Long viewCount, Long likeCount, Instant createdAt) { public static PostSearchResponse from(Post post) { String plain = post.getContent().replaceAll("<[^>]*>", "").strip(); String snippet = plain.substring(0, Math.min(plain.length(), 150)); return new PostSearchResponse( post.getId(), post.getTitle(), snippet, post.getViewCount(), post.getLikeCount(), post.getCreatedAt()); }}| Before (Post 전체) | After (PostSearchResponse) | |
|---|---|---|
| content 전송 | ~13KB (LONGTEXT) | 0 |
| snippet 전송 | 없음 | ~150B |
| 20건 기준 | ~260KB | ~3KB |
| 절감률 | ~99% |
3) 페이지네이션: 슬라이딩 윈도우 + 최대 15페이지
1페이지: 이전 [1] 2 3 4 5 6 7 8 9 10 다음10페이지: 이전 6 7 8 9 [10] 11 12 13 14 15 다음15페이지: 이전 6 7 8 9 10 11 12 13 14 [15] 다음(비활성)- Google 방식 슬라이딩 윈도우: 현재 페이지 기준 앞뒤 10개 표시
- 최대 15페이지 제한: 백엔드
MAX_SEARCH_PAGE=15와 동기화 hasNext=false면 그 페이지에서 번호가 끝남 (저빈도 검색어)
향후 개선: Lucene UnifiedHighlighter
현재 snippet은 본문 앞 150자를 단순 truncate합니다. 향후 Lucene UnifiedHighlighter를 적용하면:
- 검색 키워드가 등장하는 위치 주변 텍스트를 추출 (KWIC: Key Word In Context)
- 검색 키워드를
<b>볼드</b>로 하이라이트 - 구글/네이버와 동일한 snippet 품질
출처
OFFSET 페이지네이션:
- Use The Index, Luke — No Offset
- Percona — Efficient Pagination Using Deferred Joins
- High Performance MySQL, 4th Edition — Optimizing LIMIT and OFFSET
COUNT(*) 제거 / 페이지네이션 트레이드오프:
- Google Drops Result Count From Search Results Page — Search Engine Roundtable (2024)
- Evolving API Pagination at Slack — Slack Engineering
- Percona — COUNT(*) for InnoDB Tables
- Spring Data JPA — Slice vs Page
- JHipster — Boost Infinite Scroll Performance with Slice
- Estimated Counts for Faster Django Admin — SquadStack Engineering
네이버 검색 페이지네이션:
Spring Data JPA Slice + nativeQuery 이슈:
- Spring Data JPA #2260 — NativeQuery with Pagination
- Spring Data JPA #1782 — Slice returns PageImpl and executes COUNT with nativeQuery (DATAJPA-1464)
- Pagination in Spring Data JPA: Issues, Solutions, and 2026 Best Practices
- Vlad Mihalcea — Query Pagination with JPA and Hibernate
- GitHub Gist — Limit results using Specifications without count query
페이지네이션 UX:
- Nielsen Norman Group — Users’ Pagination Preferences and “View All”
- Design Better Pagination — Andrew Coyle
- UX Patterns for Developers — Pagination Pattern
API 페이지네이션 설계:
- REST API Pagination Best Practices — Speakeasy
- API Pagination Explained: Techniques & Best Practices — QuarkAndCode
- Slack Developer Docs — Pagination
스레드풀 튜닝:
k6 부하 테스트:
Previous Post
In the Deferred Join post, we applied Deferred Join to OFFSET pagination on 14.75 million rows and analyzed why the improvement fell short of expectations.
Previous Post Summary
In the Lucene migration post, we switched the search engine to Lucene with the Nori morphological analyzer.
We completed full-text search on 14.25 million rows, resolved high-frequency token timeouts, and eliminated false positives.
When we first ran k6 load tests, the latest post listing — not search — turned out to be the biggest bottleneck.
Test environment: ARM 2-core / 12 GB RAM — Spring Boot 2 GB (JVM heap 1 GB) + MySQL 4 GB (InnoDB BP 2 GB) + monitoring agents ~1 GB. The remaining ~5 GB serves as OS page cache (Lucene MMap).
| Scenario | smoke (5 VU) | load (100 VU) |
|---|---|---|
| Search (Lucene) | 66 ms | 3,328 ms |
| Autocomplete (Lucene) | 25 ms | 3,339 ms |
| Latest post listing (MySQL OFFSET) | 2,518 ms | 19,424 ms |
| Detail view (MySQL) | 53 ms | 3,345 ms |
| Error rate | 0% | 32.53% |
In smoke, the latest post listing (2,518 ms) was 38x slower than search (66 ms).
Under load, the heavy OFFSET of the post listing saturated the CPU, causing every scenario to collapse in a chain reaction.
1. Discovery — The Latest Post Listing Was the Bottleneck, Not Search
This problem pertains to the latest post listing (
GET /api/v1.0/posts).
Lucene search (GET /api/v1.0/posts/search) returns results directly from an inverted index, so it has no OFFSET problem.
The k6 script requested pages 100–1000 with 30% probability.
Page 1000 = OFFSET 20,000, meaning MySQL had to read 20,020 rows and discard 20,000.
-- Latest post listing: sorted by created_at DESCSELECT * FROM postsORDER BY created_at DESCLIMIT 20 OFFSET 20000; -- page 10012. Root Cause — The Structural Inefficiency of SELECT * + OFFSET
MySQL’s SELECT * + OFFSET goes through the following steps:
1. Sequentially retrieve PKs from the secondary index (idx_posts_created_at)2. Random I/O to the clustered index for each PK to fetch the full row (including LONGTEXT)3. Read and discard OFFSET 20,000 rows → ~260 MB read and thrown away (20,000 × ~13 KB avg wiki body)4. Return only the remaining 20 rowsPostSummaryResponse does not use content. We were reading unnecessary LONGTEXT data.
CPU saturation causal chain (k6 load results):
Deep OFFSET on latest post listing (OFFSET 20,000) → CPU-bound index scan→ 2-core CPU saturation (System CPU 100%, Load Average 20)→ Cascading delays across MySQL + App sharing the same CPU (14.8K Slow Queries)→ Search, autocomplete, detail views all delayed (66 ms → 3,300 ms)→ Spring Boot thread explosion (20 → 120), request timeouts→ HTTP 500 errors → k6 error rate 32.53%Key evidence: InnoDB Buffer Pool hit rate was 100% (zero disk I/O), yet 14.8K Slow Queries occurred. The bottleneck was CPU, not memory.
3. Solution 1: Deferred Join
Principle
The inner subquery performs SELECT id only, handled via Covering Index Scan.
The outer query then looks up the clustered index for only the final 20 PKs.
-- Before: Random I/O for 20,020 full rows (including LONGTEXT)SELECT * FROM postsORDER BY created_at DESCLIMIT 20 OFFSET 20000;
-- After: Extract PKs via Covering Index, then cluster I/O for only 20 rowsSELECT p.* FROM posts pINNER JOIN ( SELECT id FROM posts ORDER BY created_at DESC LIMIT 20 OFFSET 20000) AS tmp ON p.id = tmp.idORDER BY p.created_at DESC;
idx_posts_created_atcontains both(created_at, id), so
SELECT id ... ORDER BY created_at DESCcompletes using only this index (Covering Index).
Current Implementation
PostRepository.java:
@Query(value = """ SELECT p.* FROM posts p INNER JOIN ( SELECT id FROM posts ORDER BY created_at DESC LIMIT :#{#pageable.pageSize} OFFSET :#{#pageable.offset} ) AS tmp ON p.id = tmp.id ORDER BY p.created_at DESC """, countQuery = "SELECT COUNT(*) FROM posts", nativeQuery = true)Page<Post> findAllWithDeferredJoin(Pageable pageable);PostService.java:
public Page<Post> getPosts(Pageable pageable) { return postRepository.findAllWithDeferredJoin(pageable);}EXPLAIN Results
| id | select_type | table | type | key | rows | Extra |
|---|---|---|---|---|---|---|
| 2 | DERIVED | posts | index | idx_posts_created_at | 20,020 | Using index (Covering) |
| 1 | PRIMARY | <derived2> | ALL | NULL | 20,020 | Using temporary; Using filesort |
| 1 | PRIMARY | p | eq_ref | PRIMARY | 1 |
Clustered index random I/O: 20,020 → 20 (1,000x reduction)
Measurement Results (k6 smoke, 5 VU, 2 min)
| Metric | Before | After | Improvement |
|---|---|---|---|
| Avg response time | 2,518 ms | 2,199 ms | -13% |
| P95 | 3,372 ms | 2,741 ms | -19% |
Why the Improvement Was Low (13%) Compared to Expectations (40x)
EXPLAIN analysis results:
- ~85% of the total cost is the sequential scan of 20,020 index entries (which Deferred Join cannot eliminate)
- LONGTEXT I/O accounted for only ~15% → removing just this yielded 13%
- Additionally, the overhead from temporary table creation (Using temporary; Using filesort) partially offset the gains
| OFFSET Size | Deferred Join Improvement | Reason |
|---|---|---|
| OFFSET 200 (page 10) | ~60% | Clustered I/O is a larger proportion |
| OFFSET 2,000 (page 100) | ~40% | |
| OFFSET 10,000 (page 500) | ~20% | |
| OFFSET 20,000 (page 1000) | ~13% | Index scan dominates |
Since ~90% of user traffic is pages 1–10, the average perceived improvement is higher than the k6 measurement (13%).
4. Solution 2: Maximum Page Limit
OFFSET’s fundamental limitation (O(N) scan) is mitigated by Deferred Join, but unlimited pages are still risky.
Google limits to ~30 pages, Naver also ~30 pages. We cap the maximum page count to control worst-case scenarios.
Industry Page Limit Comparison
| Service | Results per page | Max pages | Max results |
|---|---|---|---|
| 10 | ~30 pages | ~300 | |
| Naver | 15 | ~30 pages | ~450 |
| wikiEngine | 20 | 31 pages (0–30) | 620 |
Implementation
Step 1: Add ErrorCode
Added PAGE_LIMIT_EXCEEDED to ErrorCode.java:
// 400 Bad RequestPAGE_LIMIT_EXCEEDED(HttpStatus.BAD_REQUEST, "최대 페이지 수를 초과했습니다"),Step 2: Add page limit logic to PostService
private static final int MAX_LIST_PAGE = 30; // Latest post listingprivate static final int MAX_SEARCH_PAGE = 30; // Lucene search
private void validatePageLimit(Pageable pageable, int maxPage) { if (pageable.getPageNumber() > maxPage) { throw new BusinessException(ErrorCode.PAGE_LIMIT_EXCEEDED); }}Why 30 pages:
| Max pages | Max OFFSET | Deferred Join measured |
|---|---|---|
| 1,000 (no limit) | 19,980 | 19.4 ms (Covering Index scan) |
| 30 (Google/Naver level) | 580 | ~1 ms |
- Thanks to Deferred Join, page 1000 still completes in 19.4 ms, but at 30 pages the OFFSET is 580 — effectively zero cost
- Both Google and Naver cap at ~30 pages. This matches user expectations
- Latest post listing: beyond 30 pages (620 items), users are directed to search
- Search: Lucene sorts by relevance, so results beyond 30 pages have low relevance
Note: Cursor-Based Pagination (For Infinite Scroll Migration)
The current UI uses page numbers, so OFFSET + page limit is a good fit.
When migrating to an infinite scroll UI, we plan to revisit Keyset Pagination.
-- Cursor approach: always reads only O(LIMIT), regardless of page depthSELECT * FROM postsWHERE created_at < :lastCreatedAtORDER BY created_at DESCLIMIT 20;| Approach | Pros | Cons | Use cases |
|---|---|---|---|
| OFFSET (page numbers) | Jump to any specific page | Slows down at deep pages | Google, wiki search |
| Cursor (infinite scroll) | Consistent performance | Sequential access only | Twitter, Instagram |
5. Solution 3: Eliminating COUNT(*)
Problem
A COUNT(*) query was executed with every latest post listing request to display “Total N results”.
Current PostRepository.findAllWithDeferredJoin countQuery:
countQuery = "SELECT COUNT(*) FROM posts"This countQuery runs automatically with every request when Spring Data returns Page<T>.
On a 14.25-million-row table, COUNT(*) is expensive because InnoDB must full-scan the smallest secondary index.
Lucene search (
GET /api/v1.0/posts/search) was also converted toSlice<T>.
Lucene’stotalHitsis an estimate, and since we removed the total count display, there’s no reason to keep Page.
Trade-off Analysis — Do We Really Need “Total N” Display?
To remove COUNT(*), we must give up the “Total N results” display.
To evaluate this trade-off, we researched how real-world services handle it.
Industry Case Studies
1) Google — Removed result count display entirely in 2024
Google had displayed “About 45,700,000 results” since the early days of search.
However, in 2024, they completely removed this number from search result pages.
Reasons for removal:
- The number was an estimate — it routinely changed when navigating between pages
- Deemed not useful to users — no one makes decisions based on “45.7 million results”
- Not worth the computation cost
Before (pre-2024): "About 45,700,000 results (0.52 seconds)" ← displayed at top of page
After (2024–): No result count displayed. Hidden inside the Tools menuSource: Google Drops Result Count From Search Results Page — Search Engine Roundtable
2) Slack — Switched from offset+page to cursor, removed total_count
Slack initially provided OFFSET pagination with count + page parameters.
They later switched to cursor-based pagination and removed total_count.
Reasons for the switch:
- As OFFSET grows, the DB must read through all previous rows, becoming slower
- When items are added/deleted, the page window shifts, causing duplicates/missing items
total_countcalculation = COUNT(*) = full scan on large tables
Slack’s current API: if next_cursor is an empty string, it’s the last page. No total count.
Internally, they query
limit + 1items to determine if a next page exists.
This is the same pattern as Spring Data’sSlice<T>.
Source: Evolving API Pagination at Slack — Slack Engineering
3) Naver — Section-based separation + ~30 page max, no total count shown
Unlike Google, Naver splits integrated search results into sections (blog, news, cafe, web documents, etc.).
Each section shows only about 5 results initially and directs users to a dedicated section page via “More”.
- Does not display total result count on the integrated search page
- Dedicated section pages (Blog tab, News tab) provide only up to ~30 pages
(SerpApi — Naver Search API) - Pagination uses a
startparameter-based OFFSET approach: 10 results per page for web search, 40 for shopping
Naver’s approach differs from Google’s, but the conclusion is the same:
They don’t show total counts like “N results” to users, and structurally block deep page access.
Naver has been transitioning to AI-based search (Cue:) since 2024,
and traditional 10-blue-links pagination itself is declining.
4) Twitter (X), Instagram — Infinite scroll, no total count
For feed-based services, total count is inherently meaningless.
They operate with cursor-based + hasNext only.
5) Stack Overflow, Reddit — Page number UI + total count display
Services that maintain a traditional board UI still display total counts.
However, these services have relatively small data volumes or absorb COUNT costs through caching.
Summary: Total Count Display Spectrum
| Approach | Representative Services | Pros | Cons |
|---|---|---|---|
| Exact COUNT | Stack Overflow, traditional boards | Accurate total page display | Full scan every request on large tables |
| Estimated count | Google (pre-2024) | Conveys scale, reduces COUNT cost | Estimates are inaccurate (change when paging) |
| No total count (hasNext only) | Google (current), Slack, Twitter | Zero COUNT queries, best performance | Cannot display “Total N pages” |
| Section-based + page limit | Naver | Section-level optimization, blocks deep pages | No aggregate count, max ~30 pages |
UX Perspective — Total Page Count Is Meaningless Beyond 100 Pages
According to NN/g (Nielsen Norman Group) research and UX design guides:
- When the page count is in the tens to hundreds or more, displaying total page count does not help users
- Users don’t make any decisions based on “Page 3 of 71,250”
- On the other hand, 30 pages or fewer gives users the psychological effect of “seeing the end”
This project: 14.25 million rows / 20 per page = 710,000 pages. Displaying total count is completely meaningless.
Conclusion: Follow Google’s Current Approach — hasNext Only, No Total Count
| Criterion | This project’s situation | Decision |
|---|---|---|
| Data scale | 14.25 million rows (710K pages) | Total count meaningless |
| COUNT(*) cost | InnoDB full scan (14.25M rows) | High cost per request |
| UI type | Page numbers | hasNext + surrounding pages is sufficient |
| User behavior | 90% visit pages 1–3 | Almost no deep page navigation |
| Max page limit | 30 pages | Finite range → total count unnecessary |
Page<T> → Slice<T> conversion. COUNT(*) completely eliminated. No estimates needed either.
Page number UI can be fully implemented with hasNext:
Display only surrounding pages + [Previous]/[Next] buttons.
Google Search has been using this approach since 2024.
What if “About N results” becomes needed later?
information_schema.tables.table_rowscan provide an estimate instantly (±10% margin).
Serving it through a separate API would add it without impacting latest post listing performance.
But considering why Google removed even this, the likelihood of needing it is low.
Implementation Plan
Caution: The Pitfall of Slice + nativeQuery + Deferred Join Combination
The current findAllWithDeferredJoin is a nativeQuery with explicit LIMIT/OFFSET inside a subquery.
Simply swapping the return type to Slice<T> in this structure can cause problems.
Why does it conflict? — Spring Data’s internal pagination behavior
How Spring Data JPA processes Pageable parameters:
In JPQL, Hibernate parses the query structure and cleanly adds LIMIT/OFFSET.
In nativeQuery, Hibernate cannot parse the SQL.
Instead, it mechanically appends LIMIT/OFFSET to the end of the query string,
or in some DB dialects, wraps the entire query as a subquery and applies pagination externally.
For Deferred Join queries, this automatic handling conflicts in two ways:
-- Our Deferred Join query (with explicit LIMIT/OFFSET in the subquery)SELECT p.* FROM posts pINNER JOIN ( SELECT id FROM posts ORDER BY created_at DESC LIMIT 20 OFFSET 0 ← ① Our explicit LIMIT) AS tmp ON p.id = tmp.idORDER BY p.created_at DESCLIMIT 21 ← ② Hibernate's auto-added LIMIT (Slice +1)Conflict scenarios:
| # | Symptom | Cause |
|---|---|---|
| ① | Double LIMIT applied (subquery + outer) | Hibernate mechanically appends LIMIT to the end of nativeQuery. Its intent differs from the subquery’s LIMIT |
| ② | COUNT query executes despite Slice | Bug in nativeQuery + Slice combination where Spring Data returns PageImpl (DATAJPA-1464) |
| ③ | ORDER BY lost | Spring Data may overwrite existing ORDER BY when trying to apply dynamic sorting to nativeQuery (#2260) |
Key point: Spring Data’s automatic pagination operates on the assumption that “LIMIT/OFFSET applies to the final result of the query”.
In structures like Deferred Join where LIMIT/OFFSET already exists inside a subquery, this assumption breaks.
Since Spring Data cannot parse the internal structure of nativeQuery, the subquery’s LIMIT and the outer auto-LIMIT overlap unintentionally.
Sources: Vlad Mihalcea — Query Pagination with JPA and Hibernate,
Spring Data JPA #2260,
Spring Data JPA #1782 (DATAJPA-1464)
Safe approach: Return List<Post> + manually construct SliceImpl in the service
This pattern is widely proven in industry:
- Slack Engineering — Querying
limit + 1items to determinehas_moreis the core mechanism of Slack’s cursor-based pagination
(Evolving API Pagination at Slack) - Baeldung — Introduces Hibernate
query.setMaxResults(pageSize + 1)+ manualSliceImplconstruction as the “extra row” pattern
(Hibernate Pagination — Baeldung) - Vlad Mihalcea (Hibernate core contributor) — Recommends directly controlling
setFirstResult/setMaxResultsin nativeQuery
(Query Pagination with JPA and Hibernate) - Spring Data JPA GitHub Gist — The
List<T>return +new SliceImpl<>(content, pageable, hasNext)pattern is also used in Specification-based queries
(GitHub Gist — Limit results without count query)
Since it does not rely on Spring Data’s automatic processing, there are no nativeQuery compatibility issues.
This pattern is the safest and most reliable approach for Deferred Join + nativeQuery.
Step 1: Repository — Return List<Post>, explicit LIMIT/OFFSET parameters
// Before: Page<T> — countQuery auto-executed (COUNT(*) full scan every request)@Query(value = """ SELECT p.* FROM posts p INNER JOIN ( SELECT id FROM posts ORDER BY created_at DESC LIMIT :#{#pageable.pageSize} OFFSET :#{#pageable.offset} ) AS tmp ON p.id = tmp.id ORDER BY p.created_at DESC """, countQuery = "SELECT COUNT(*) FROM posts", nativeQuery = true)Page<Post> findAllWithDeferredJoin(Pageable pageable);
// After: List<T> — No COUNT, LIMIT+1 handled in service@Query(value = """ SELECT p.* FROM posts p INNER JOIN ( SELECT id FROM posts ORDER BY created_at DESC LIMIT :limit OFFSET :offset ) AS tmp ON p.id = tmp.id ORDER BY p.created_at DESC """, nativeQuery = true)List<Post> findAllWithDeferredJoin(@Param("limit") int limit, @Param("offset") long offset);Step 2: Service — Manual Slice construction (LIMIT+1 pattern)
public Slice<Post> getPosts(Pageable pageable) { if (pageable.getPageNumber() > MAX_LIST_PAGE) { throw new BusinessException(ErrorCode.PAGE_LIMIT_EXCEEDED); }
int pageSize = pageable.getPageSize(); long offset = pageable.getOffset();
// Key: Query pageSize + 1 to determine next page existence List<Post> results = postRepository.findAllWithDeferredJoin(pageSize + 1, offset);
boolean hasNext = results.size() > pageSize; if (hasNext) { results = results.subList(0, pageSize); // Only the 20 to actually display }
return new SliceImpl<>(results, pageable, hasNext);}
SliceImplis Spring Data’s implementation ofSlice<T>.
It’s created withnew SliceImpl<>(content, pageable, hasNext),
and supportshasNext(),hasPrevious(),getContent(),getNumber(), etc.
Step 3: Controller — Change return type
@GetMappingpublic Slice<PostSummaryResponse> getPosts( @RequestParam(required = false) Long categoryId, @PageableDefault(size = 20) Pageable pageable) {
Slice<Post> posts = (categoryId != null) ? postService.getPostsByCategory(categoryId, pageable) : postService.getPosts(pageable);
return posts.map(PostSummaryResponse::from);}Category listing (
getPostsByCategory) also needs the same pattern.
CurrentlyfindByCategoryIdOrderByCreatedAtDescis a Spring Data derived query, so
changing the return type toSlice<Post>automatically removes COUNT.
No pitfalls since it’s not a nativeQuery.
Search also converted to Slice:
LuceneSearchService.search()was also converted toSlice<T>. Lucene’stotalHitsis an estimate, and since the total count display was removed, we use thelimit + 1pattern to determine onlyhasNext(). Additionally, by returning snippets (150 chars) instead of content (LONGTEXT), the response size was reduced by ~99%.
Spring Data: Page vs Slice Comparison
| Item | Page<T> | Slice<T> |
|---|---|---|
| COUNT query | Executed every request | Not executed |
getTotalElements() | O | X |
getTotalPages() | O | X |
hasNext() | O | O |
getContent() | O | O |
getNumber() (current page) | O | O |
| DB queries per request | 2 (data + COUNT) | 1 (data only, LIMIT+1) |
Sources: Spring Data JPA — Slice vs Page, JHipster — Boost Infinite Scroll Performance with Slice
Expected Results
| Metric | Before (Page) | After (Slice) | Improvement |
|---|---|---|---|
| DB queries/request | 2 (data + COUNT) | 1 (data only) | 50% reduction |
| COUNT(*) time | 2,038 ms (14.77M row scan) | 0 ms (eliminated) | 100% eliminated |
| Total count accuracy | 100% | Not displayed | - |
| User experience | Same | Same (Google removed it too) | - |
6. Before/After Measurement
Pre-Change Captures
We captured the following items before the code changes. These serve as evidence for equal-condition comparison with After.
| # | Captured Item | Method | Purpose |
|---|---|---|---|
| 1 | COUNT(*) single execution cost | EXPLAIN ANALYZE SELECT COUNT(*) FROM posts; | Baseline for COUNT elimination effect |
| 2 | Current API response JSON (Page structure) | GET /api/v1.0/posts?page=0&size=20 | Confirm totalElements, totalPages fields disappear after Slice conversion |
| 3 | k6 smoke (5 VU, 2 min) | k6 run --env PROFILE=smoke baseline-load-test.js | Performance baseline |
| 4 | Grafana dashboard (during smoke) | QPS, CPU, Slow Query, thread count panel captures | Infrastructure baseline |
| 5 | MySQL status snapshot | SHOW GLOBAL STATUS LIKE 'Slow_queries'; | Cumulative Slow Query count |
| 6 | (Optional) deep OFFSET execution time comparison | EXPLAIN ANALYZE page 200 vs page 1000 | Evidence for why page limits are needed |
Capture Results
1. COUNT(*) execution cost:
-> Count rows in posts (actual time=2014..2014 rows=1 loops=1)Approximately 2 seconds were consumed by COUNT(*) for every latest post listing request. Duration: 2.038 sec.
2. API response JSON (Page structure):
GET /api/v1.0/posts?page=0&size=20 response (pagination metadata portion):
{ "totalElements": 14769132, "totalPages": 738457, "number": 0, "size": 20, "first": true, "last": false, "numberOfElements": 20}totalElements: 14,769,132 (~14.77 million), totalPages: 738,457 (~740K pages).
After Slice conversion, totalElements and totalPages fields disappear, leaving only hasNext: true/false.
3. k6 smoke Before:
We use the smoke results measured right after the previous post (Lucene migration) as the baseline.
(lucene-decision — k6-smoke-result.png)
| Metric | Search | Autocomplete | Latest post listing | Detail view | Write |
|---|---|---|---|---|---|
| Avg | 66 ms | 25 ms | 2,518 ms | 53 ms | 62 ms |
| P95 | 128 ms | 37 ms | 3,372 ms | 93 ms | 124 ms |
| Overall | Value |
|---|---|
| Total requests | 214 |
| Error rate | 0.00% |
| Overall P95 | 2,239 ms |
4. Grafana screenshots (during k6 load):
We use Grafana captures from the previous post’s load profile (100 VU, 20 min) measurement as baseline:
- MySQL metrics: Buffer Pool hit rate 100%, Slow Queries 14.8K, QPS 30–50
(lucene-decision — k6-load-mysql.png) - Container resources: System CPU 100% saturated, Load Average 20+
(lucene-decision — k6-load-containers.png) - Spring Boot HTTP: Threads surged from 20 → 120, 5xx error rate peaked at 40%
(lucene-decision — k6-load-springboot-http.png)
5. MySQL status:
Slow_queries: 79505Cumulative Slow Queries: 79,505 (total since server start).
6. Deep OFFSET execution cost (page 1000, with Deferred Join applied):
EXPLAIN ANALYZESELECT p.* FROM posts pINNER JOIN ( SELECT id FROM posts ORDER BY created_at DESC LIMIT 20 OFFSET 19980) AS tmp ON p.id = tmp.idORDER BY p.created_at DESC;-> Sort row IDs: p.created_at DESC (actual time=19.4..19.4 rows=20 loops=1) -> Nested loop inner join (actual time=11.2..18.5 rows=20 loops=1) -> Table scan on tmp (actual time=6.62..6.63 rows=20 loops=1) -> Materialize (actual time=6.62..6.62 rows=20 loops=1) -> Limit/Offset: 20/19980 row(s) (actual time=6.61..6.61 rows=20 loops=1) -> Covering index scan on posts using idx_posts_created_at (cost=13774 rows=20000) (actual time=2.48..5.75 rows=20000 loops=1) -> Single-row index lookup on p using PRIMARY (id=tmp.id) (cost=0.997 rows=1) (actual time=0.586..0.586 rows=1 loops=20)Key point: Thanks to Deferred Join, page 1000 (OFFSET 19,980) completes in 19.4 ms.
It scans only the Covering Index (idx_posts_created_at) to read 20,000 rows (5.75 ms), then looks up just 20 rows via PK in the clustered index (0.586 ms x 20).
At page 30 (OFFSET 580), only 600 rows are scanned — effectively negligible. The page limit is a UX decision, not a performance one.
Post-Change API Response Verification
1. Slice response check — GET /api/v1.0/posts?page=0&size=20:
{ "empty": false, "first": true, "last": false, "number": 0, "numberOfElements": 20, "size": 20, "pageable": { "offset": 0, "pageNumber": 0, "pageSize": 20, "paged": true }}totalElements and totalPages fields completely removed. COUNT(*) query no longer executes.
2. Page limit check — GET /api/v1.0/posts?page=11&size=20:
{ "status": 400, "message": "최대 페이지 수를 초과했습니다", "code": "PAGE_LIMIT_EXCEEDED", "timestamp": "2026-03-08T15:23:52.003214037Z"}When requesting page=31 (0-indexed, i.e., the 32nd page), it exceeds MAX_LIST_PAGE = 30 and returns a 400 error. Confirmed working correctly.
(Screenshot was captured with MAX_LIST_PAGE=10 during initial testing, hence page=11)
k6 smoke (5 VU, 2 min) — Before/After Comparison
ARM 2-core, Spring Boot JVM 1 GB, MySQL InnoDB BP 2 GB
| Scenario | Before (Deferred Join only) | After (+ page 30 limit + COUNT removal) | Improvement |
|---|---|---|---|
| Search | 66 ms | 55.39 ms | -16% |
| Autocomplete | 25 ms | 13.98 ms | -44% |
| Latest post listing | 2,518 ms | 17.56 ms | -99.3% |
| Detail view | 53 ms | 29.20 ms | -45% |
| Write | 62 ms | 39.63 ms | -36% |
| Error rate | 0.00% | 0.00% | - |
Note: Test path difference
Before usedhttp://internal-IP:8080(direct to app server), After usedhttps://api.studywithtymee.com(via nginx + SSL).
Since After is faster despite additional network hops, the actual backend improvement is greater than the numbers suggest.
The reason unchanged scenarios (search, autocomplete, detail view) also got faster is
the cascading effect of MySQL connection/CPU contention being resolved after COUNT(*) + deep OFFSET were eliminated.
Why did the latest post listing decrease by 99.3%?
The Before (2,518 ms) had three overlapping bottlenecks:
-
COUNT(*) elimination (→ -2,038 ms): Every request performed a Full Table Scan on 14.77 million rows to compute
totalElements. ThePage<T>→Slice<T>conversion completely eliminated this query. On a per-request basis, ~2,038 ms out of 2,518 ms was COUNT(*), so 80% was removed by this alone. -
Deep OFFSET elimination (→ max page 30): The Before k6 script requested pages 100–1000 (OFFSET 2,000–20,000) with 30% probability. Larger OFFSETs proportionally increase secondary index → clustered index random I/O. The page 30 limit reduced max OFFSET to 580.
-
Deferred Join effectiveness maximized: In the page 0–30 range, the subquery scans only the Covering Index (
idx_posts_created_at) to extract 20 PKs, and the outer query reads exactly 20 rows from the clustered index. The smaller the OFFSET, the more efficient Deferred Join becomes.
| Bottleneck | Before contribution | After |
|---|---|---|
| COUNT(*) | ~2,038 ms | 0 ms (Slice) |
| Deep OFFSET (page 100–1000) | ~300–500 ms (30% probability) | 0 ms (page 30 limit) |
| Deferred Join (page 0–30) | ~50 ms | ~18 ms |
| Total | ~2,518 ms | ~18 ms |
k6 load (100 VU, 20 min) — Before/After Comparison
ARM 2-core, Spring Boot JVM 1 GB, MySQL InnoDB BP 2 GB
| Scenario | Before | After | Improvement |
|---|---|---|---|
| Search avg / P95 | 3,328 ms / 5,010 ms | 20.51 ms / 54.95 ms | -99.4% |
| Autocomplete avg / P95 | 3,339 ms / 5,008 ms | 5.91 ms / 14.33 ms | -99.8% |
| Latest post listing avg / P95 | 19,424 ms / 28,987 ms | 8.33 ms / 19.01 ms | -99.96% |
| Detail view avg / P95 | 3,345 ms / — | 15.06 ms / 28.80 ms | -99.6% |
| Write avg / P95 | — | 19.05 ms / 48.84 ms | — |
| Overall avg / P95 / P99 | — | 30.12 ms / 118.82 ms / 228 ms | — |
| Total requests | — | 42,401 | — |
| Error rate | 32.53% | 0.00% | Errors completely resolved |
Why did fixing only pagination improve search, autocomplete, and detail views by 99%?
The Before search latency of 3,328 ms wasn’t because search itself was slow. In smoke (5 VU), search was 66 ms and autocomplete was 25 ms. Under load (100 VU), the deep OFFSET (OFFSET 20,000) of the latest post listing saturated the 2-core CPU to 100%, trapping every request on the same server in the CPU queue. That is, Before 3,328 ms = search’s inherent cost (~20 ms) + CPU saturation wait time (~3,300 ms).Once the pagination query was fixed and CPU saturation resolved, the other APIs returned to their original speeds. This is the cascade failure pattern where a single bottleneck brings down the entire system, and removing one bottleneck revives everything.
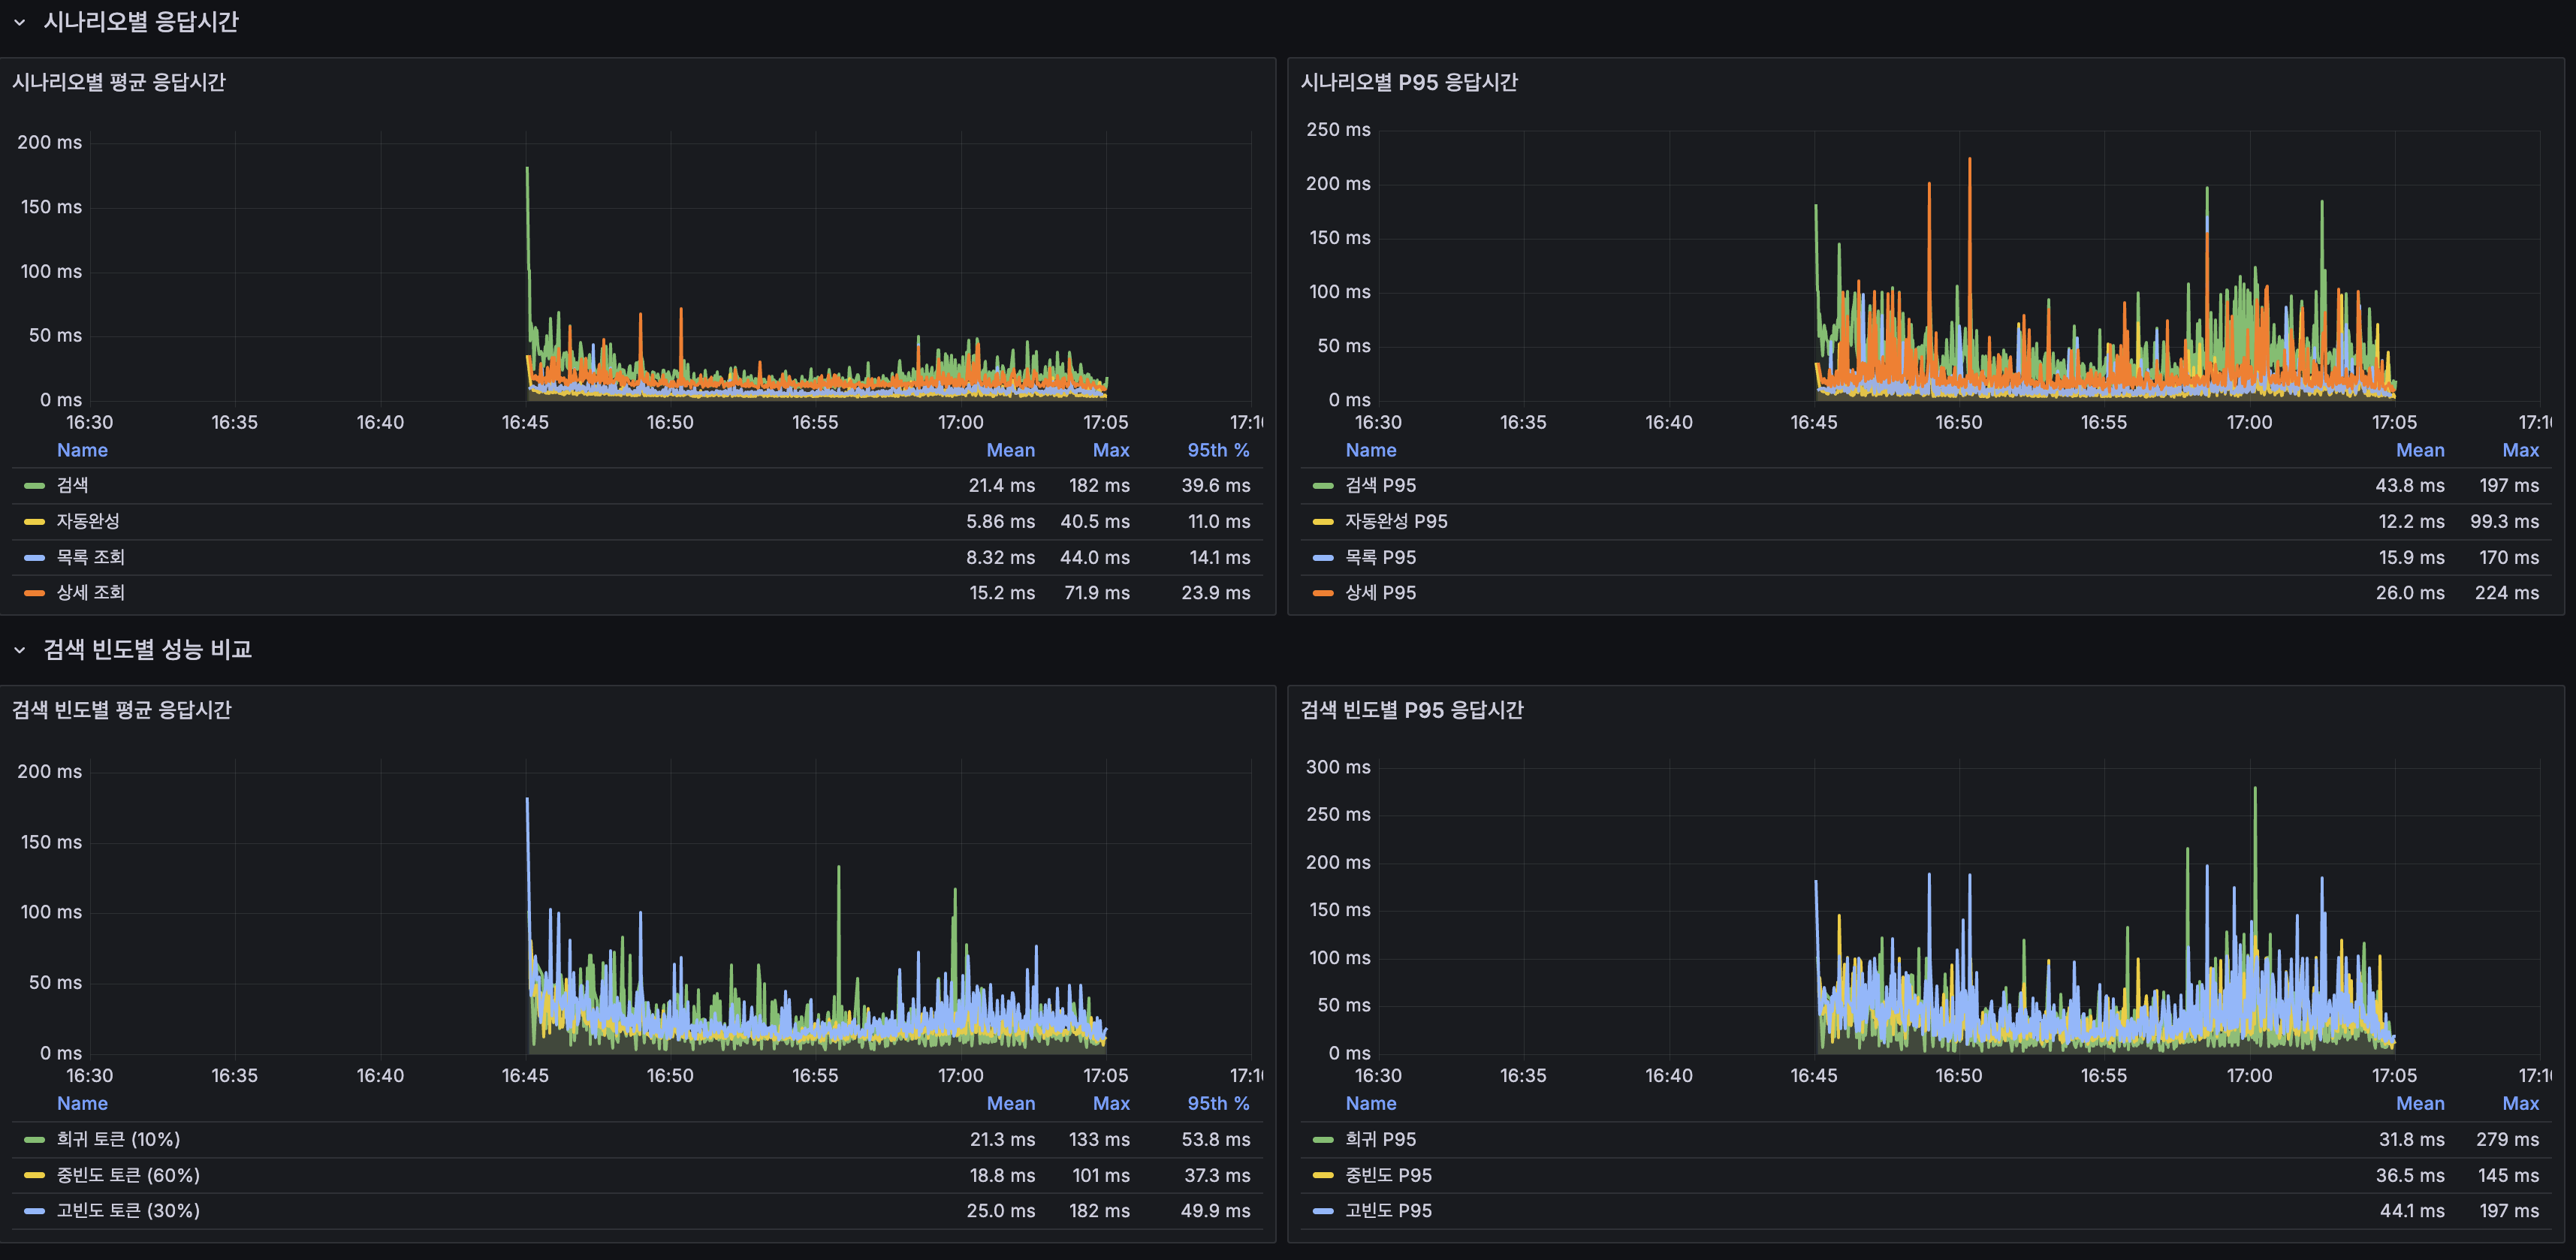
Search Performance by Frequency Category (load test)
The k6 script classified search terms by frequency to measure performance differences based on Lucene posting list length:
| Frequency | Ratio | Avg | P95 | Characteristics |
|---|---|---|---|---|
| Rare tokens | 10% | 20.36 ms | 60.86 ms | Short posting list, mostly cache misses |
| Mid-frequency tokens | 60% | 18.35 ms | 48.29 ms | Typical user search patterns |
| High-frequency tokens | 30% | 24.77 ms | 63.72 ms | Long posting list, stress test |
High-frequency tokens (e.g., “Korea”, “history”) are on average 35% slower than mid-frequency.
The longer the posting list, the more documents Lucene must score — a structural characteristic.
However, even high-frequency tokens at P95 63.72 ms are fast enough, easily meeting the load test SLA (P95 < 300 ms).
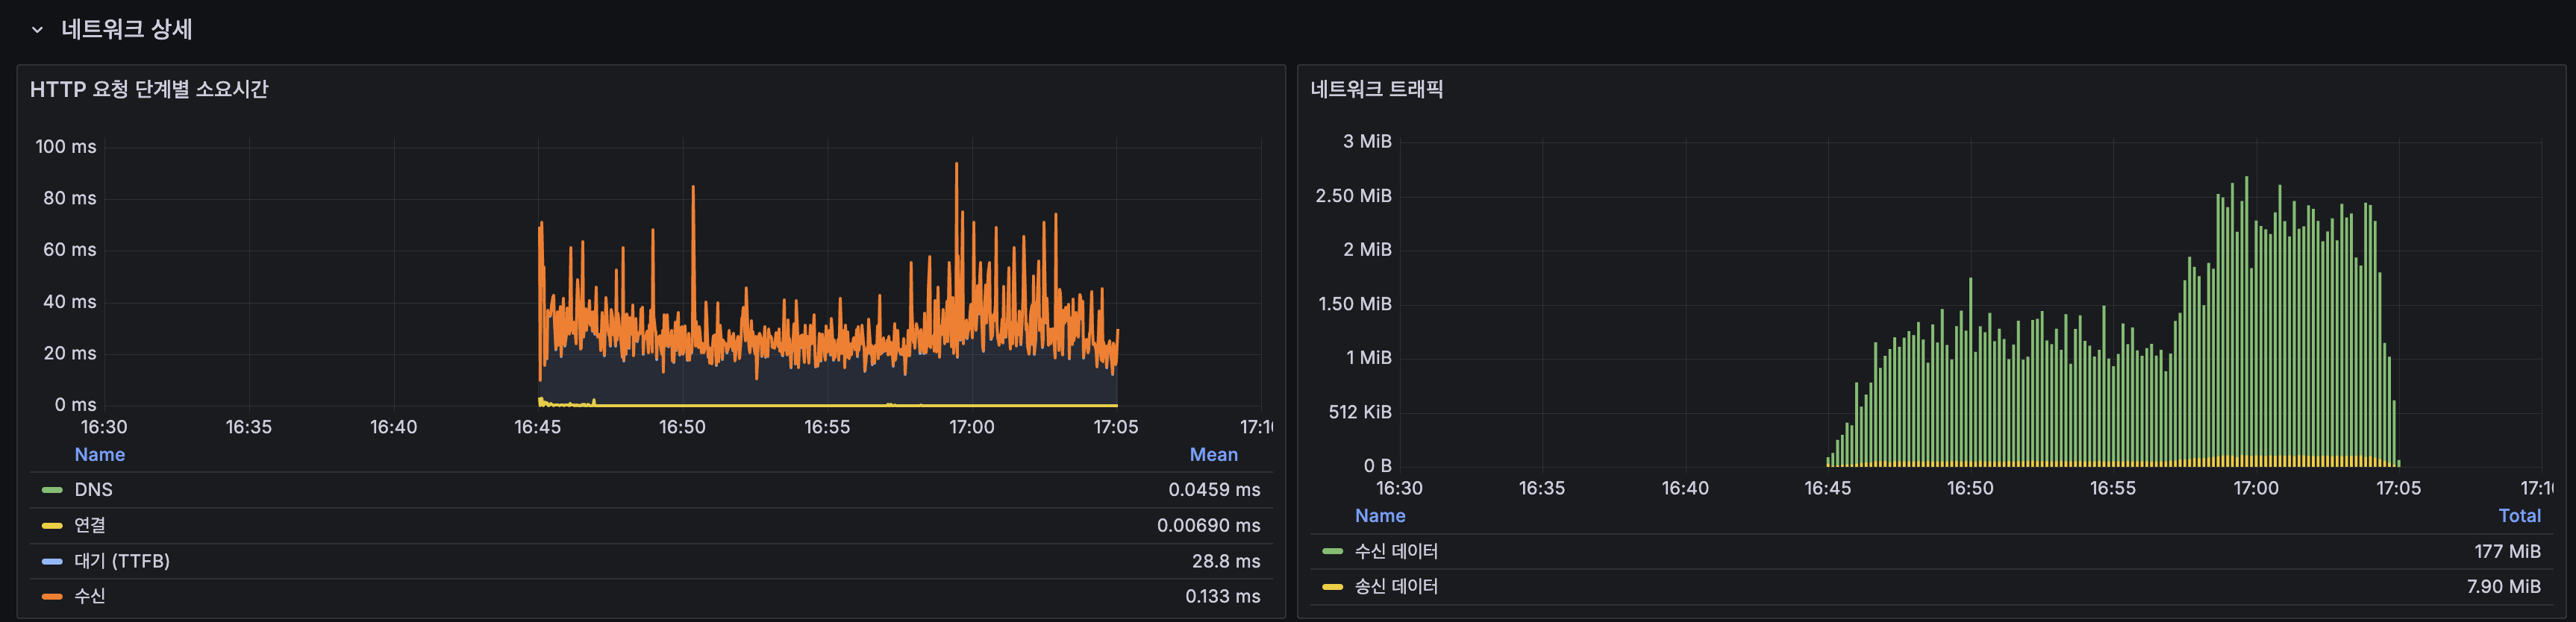
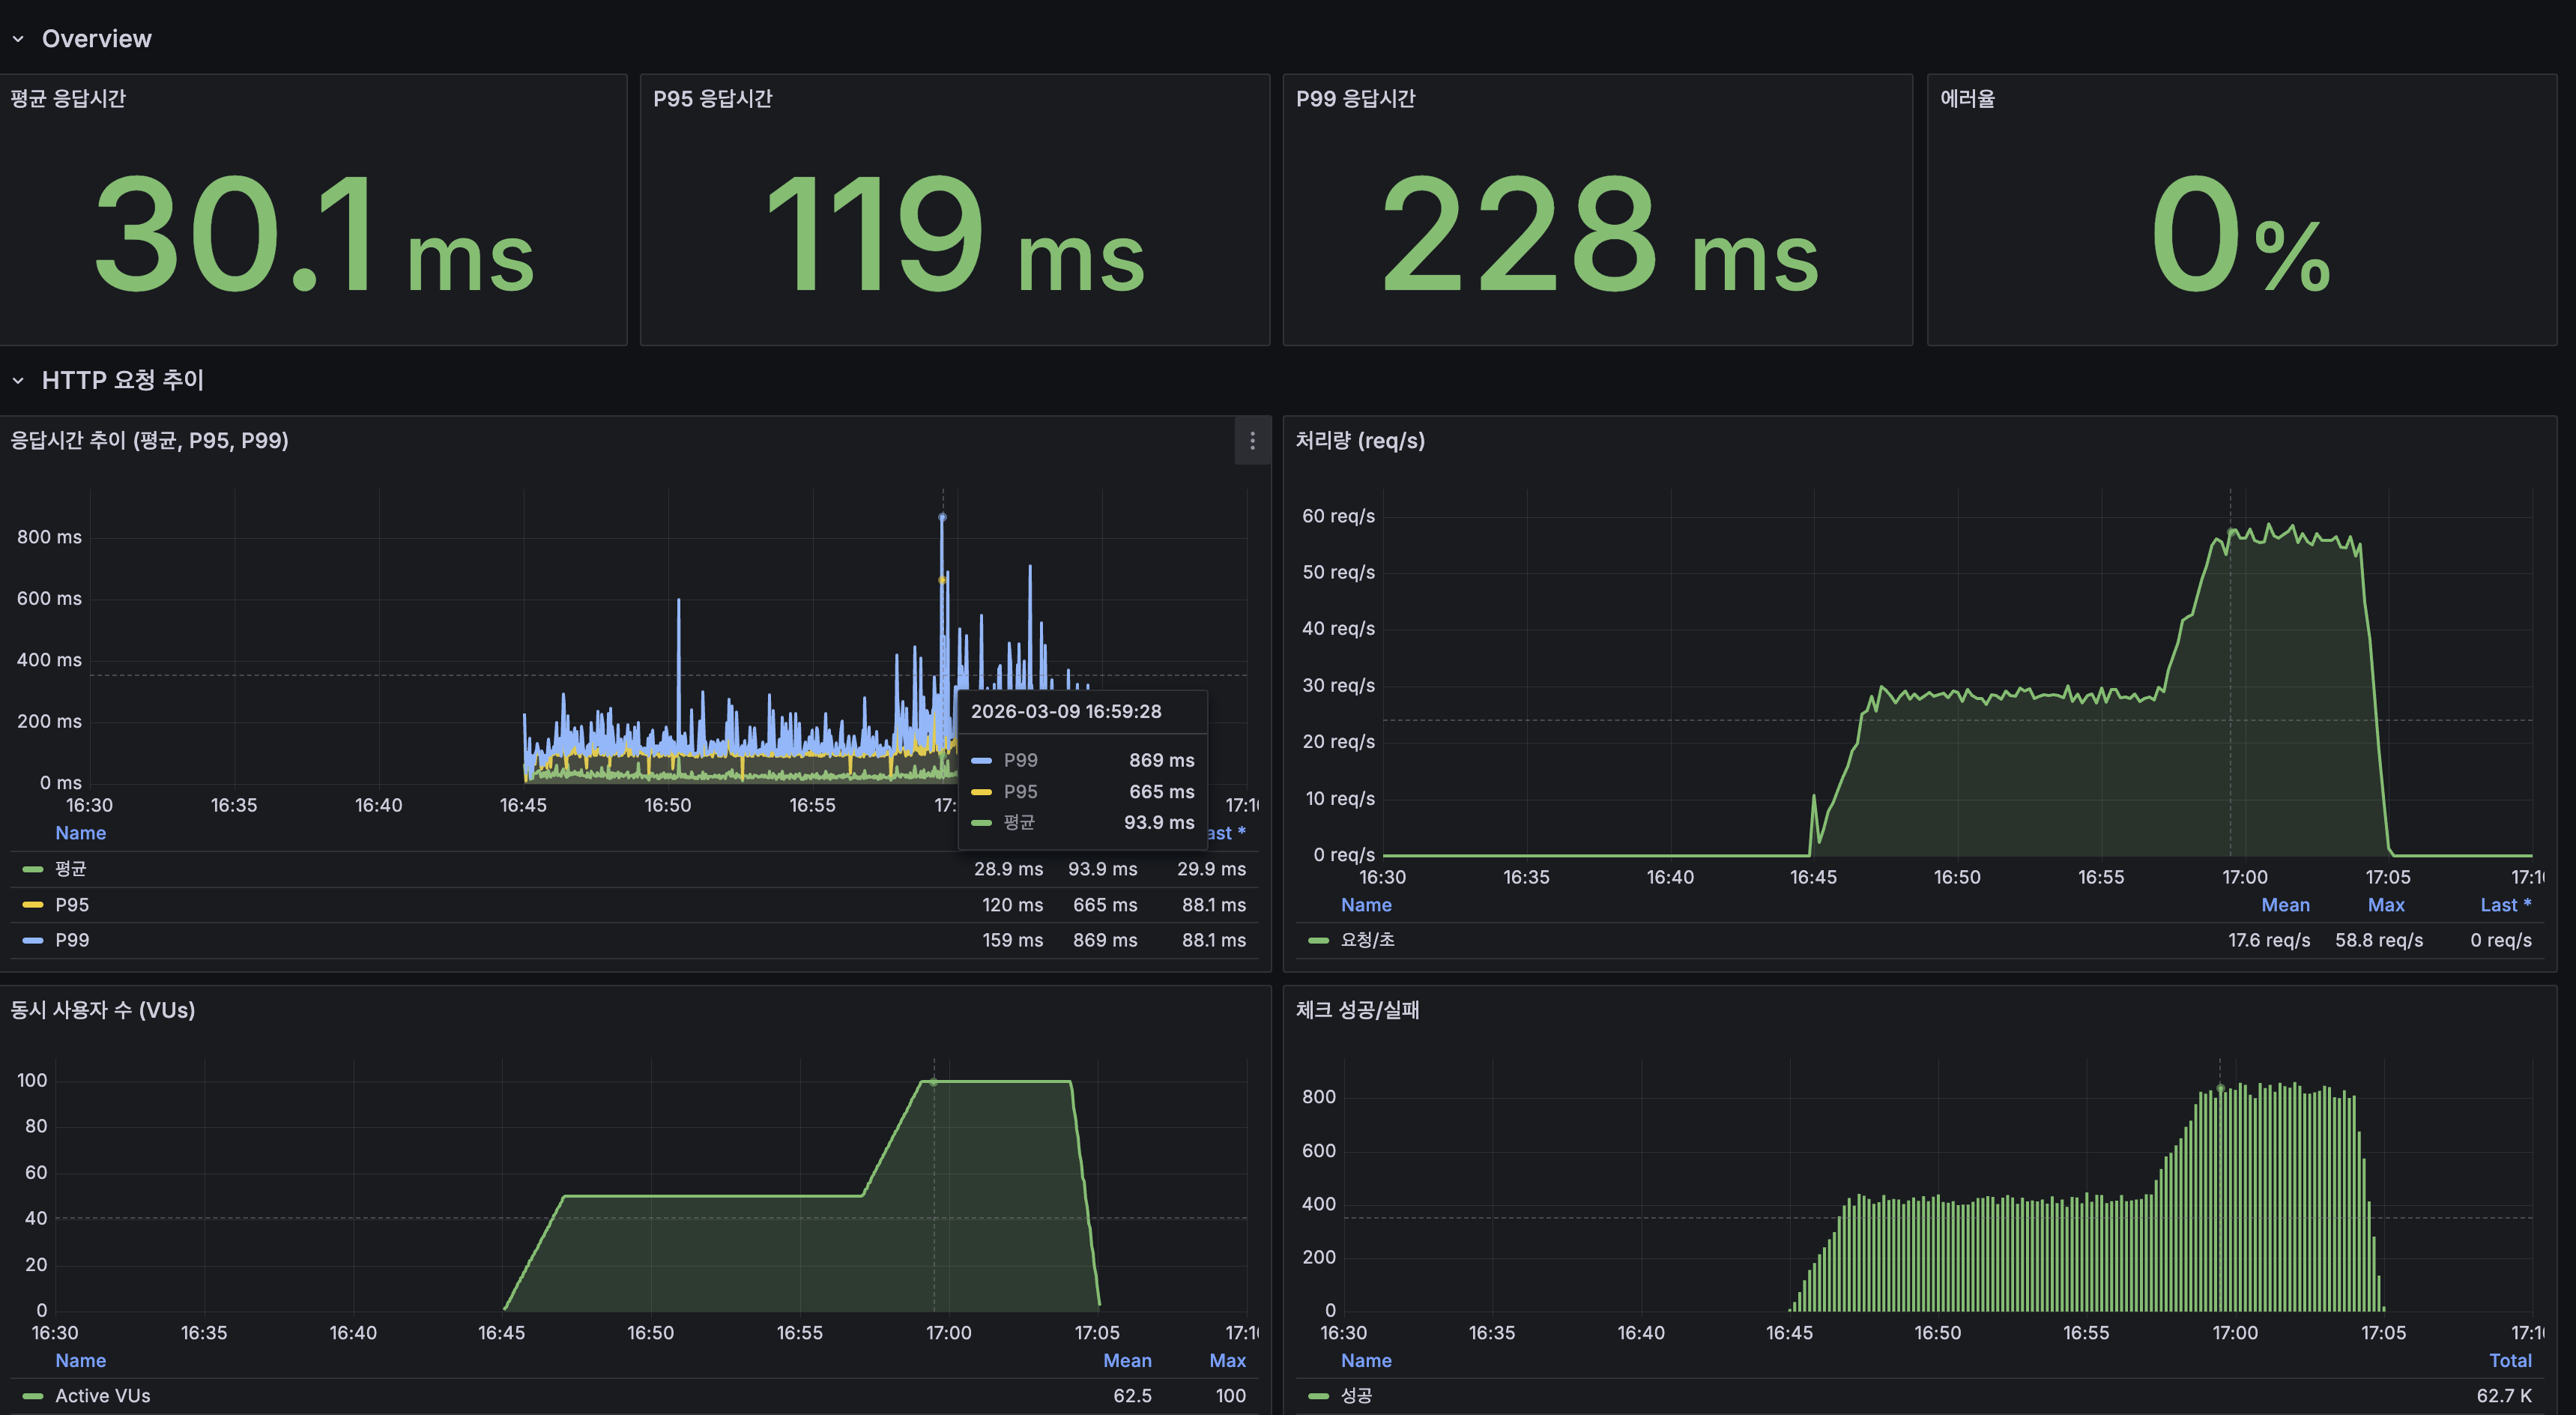
Grafana Dashboard — k6
- Average response time 30.1 ms, P95 119 ms, P99 228 ms
- Throughput: avg 17.6 req/s, peak 58.8 req/s (100 VU segment)
- Concurrent users: max 100 VU
- Error rate: 0%
MySQL Metrics Comparison
| MySQL Metric | Before | After | Change |
|---|---|---|---|
| QPS (peak) | 30–50 | ~300 | 6x increase (CPU headroom enables more queries) |
| InnoDB Buffer Pool hit rate | 100% | 100% | Same (zero disk I/O) |
| Slow Queries (cumulative) | 79,505 | 95,400 | +15,895 (smoke + load combined) |
| Table Locks | — | 0 | No lock contention |
6x QPS increase: Before, CPU saturation limited throughput to 30–50 QPS. After, with CPU headroom, the same 100 VU now processes ~300 QPS.
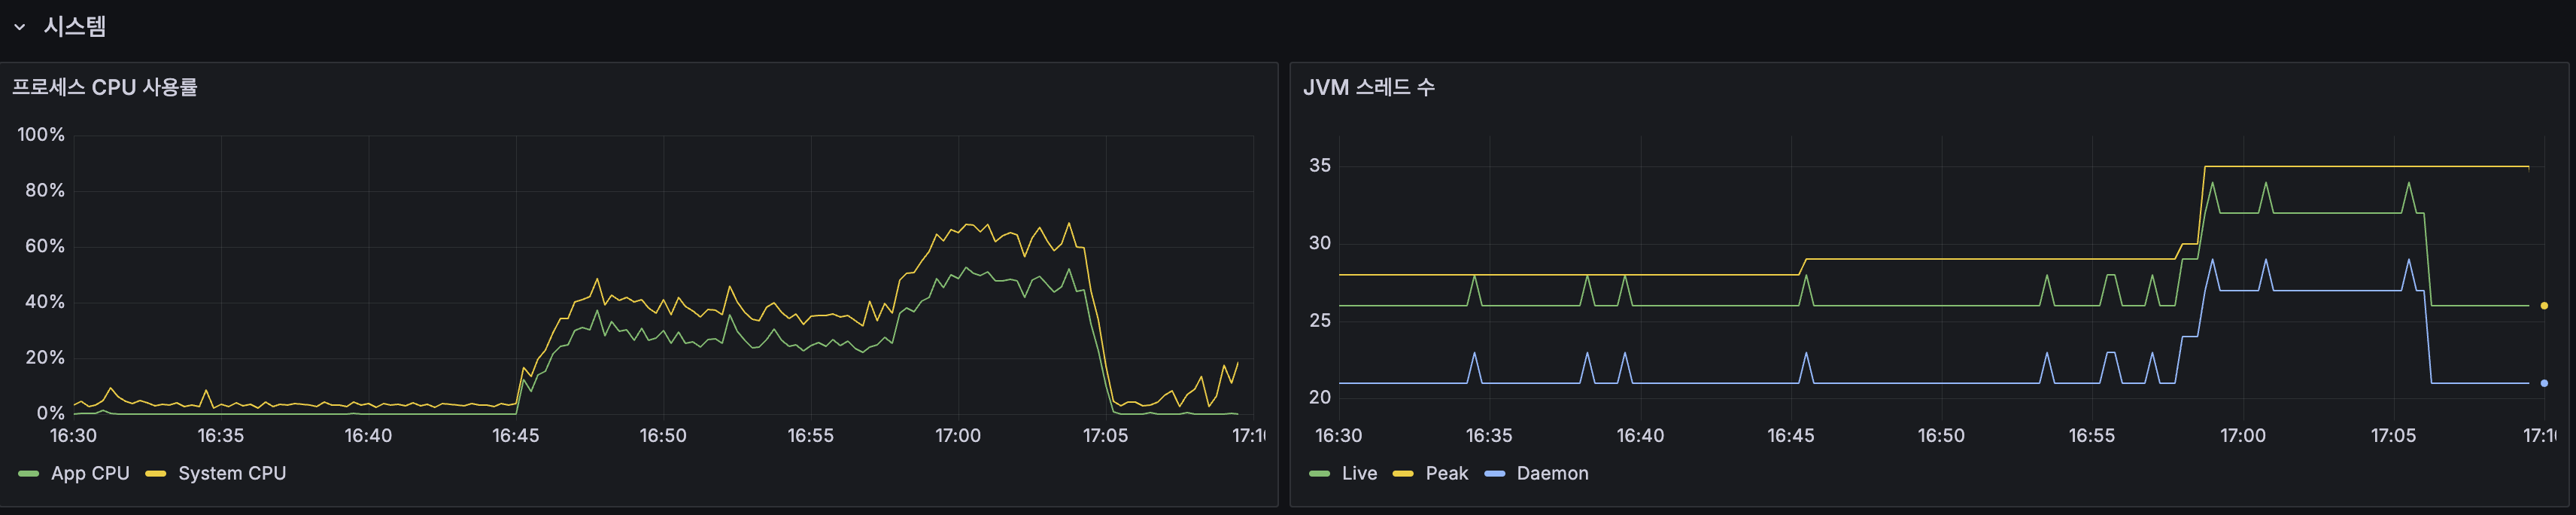
Infrastructure Metrics Comparison
| Infrastructure Metric | Before | After | Change |
|---|---|---|---|
| Host CPU (peak) | 100% (saturated) | ~35% | CPU saturation resolved |
| Load Average (1m) | 20+ | ~3 | 85% decrease |
| App Container CPU | 100% | ~90% (peak) | Headroom gained |
| JVM threads | 20 → 120 | 28 → 34 | Thread explosion resolved |
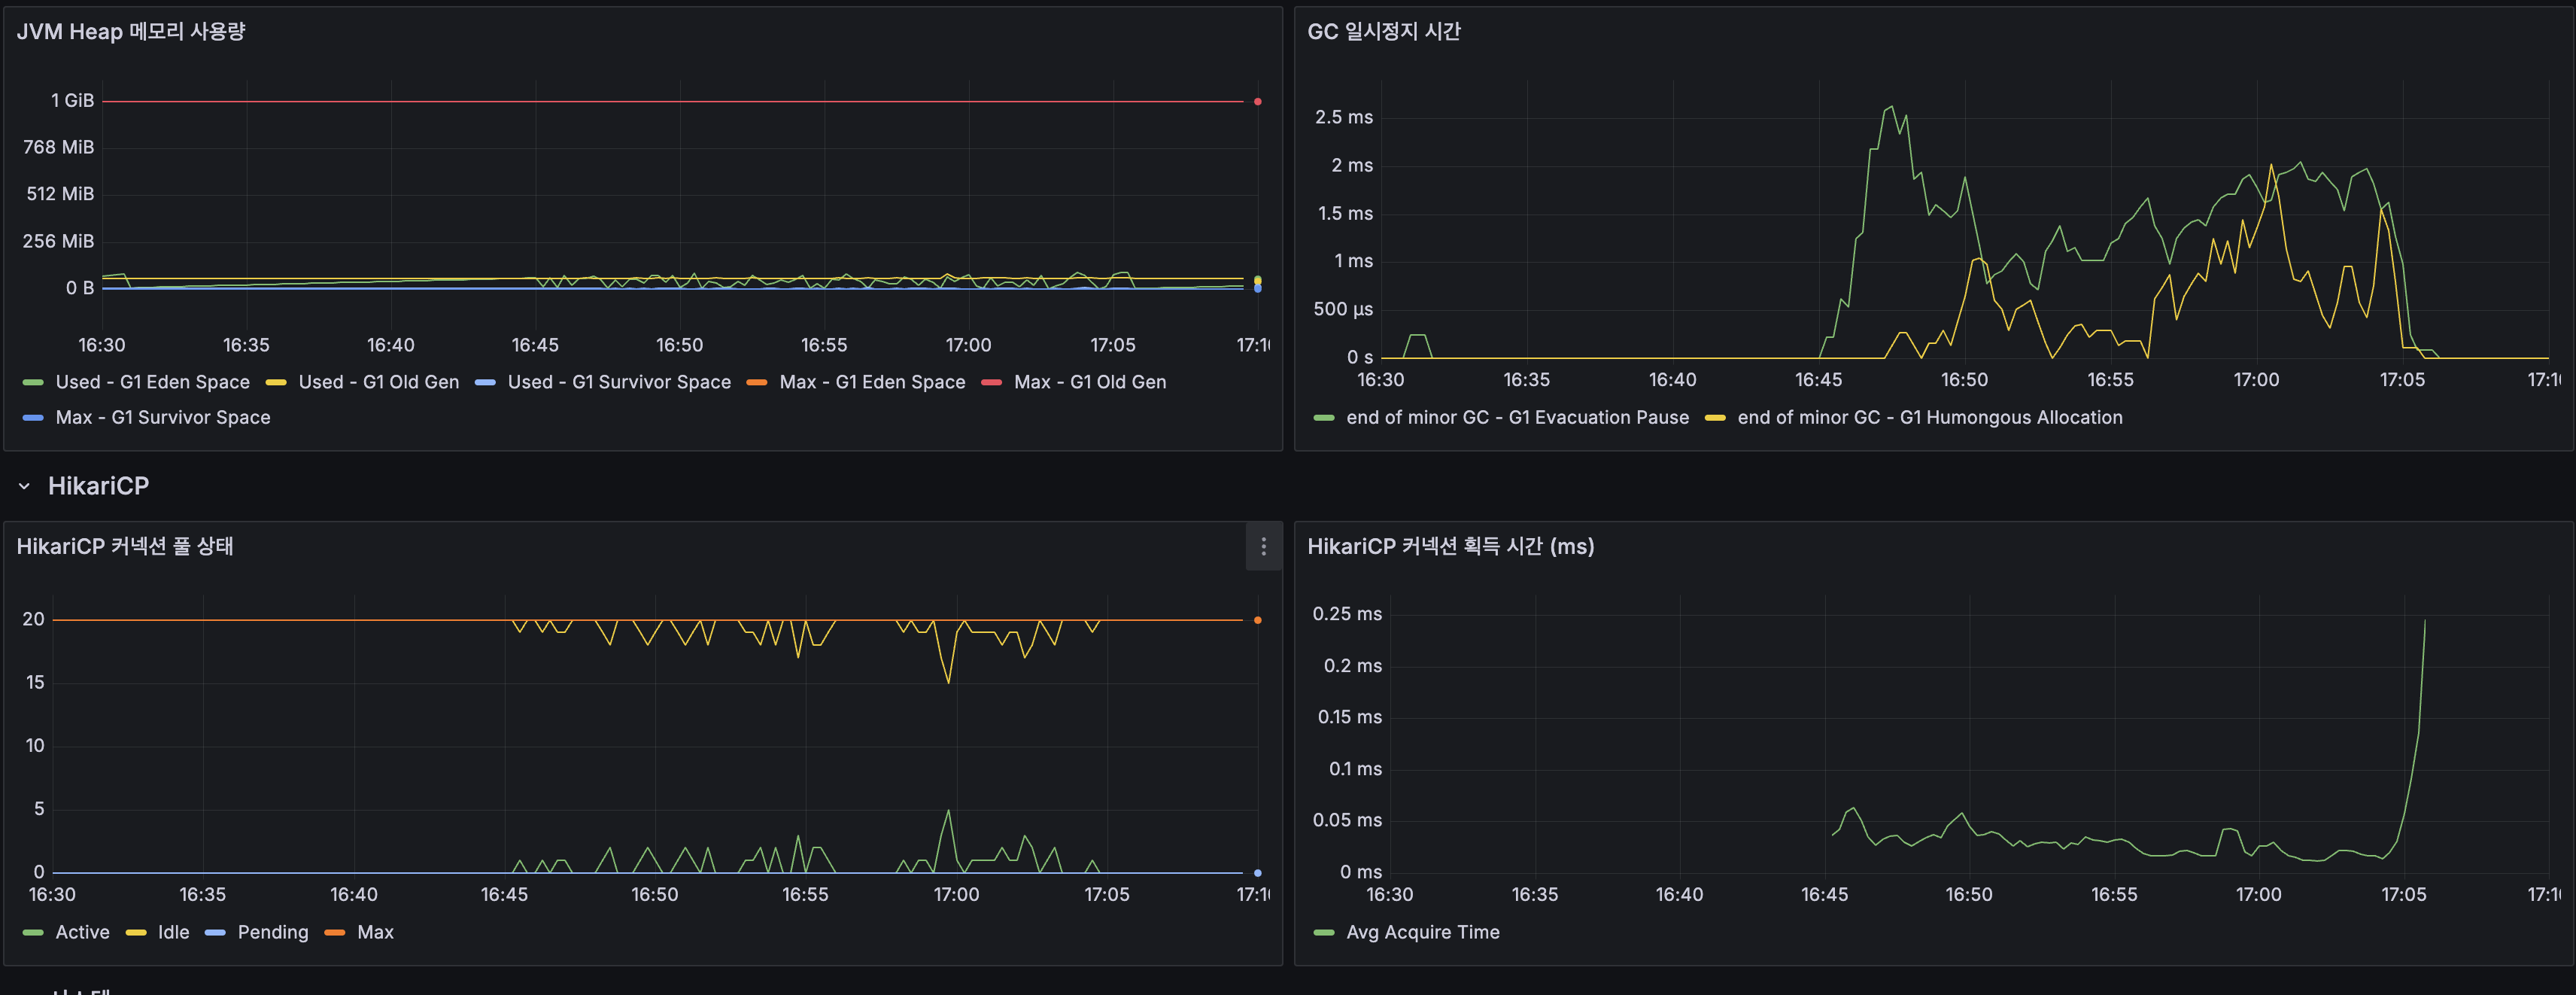
Spring Boot Metrics
| Spring Boot Metric | Before | After | Change |
|---|---|---|---|
| JVM Heap | OldGen increasing | Stable (within 1 GiB) | Memory pressure resolved |
| GC Pause | — | ~1 ms | Normal |
| HikariCP Active | 20 (pool exhausted) | 20 (normal usage) | Pending 0 |
| HikariCP Acquire Time | — | 0.03–0.05 ms | Connections acquired instantly |
| App CPU | 100% | ~60% | 40% headroom |
| System CPU | 100% | ~70% (peak) | 30% headroom |
7. Search API Also Converted to Slice + Snippet Response
Background
The sections above covered optimization of the latest post listing (GET /posts).
The search API (GET /posts/search) kept Page<T>, reasoning that “Lucene’s totalHits has no COUNT problem.”
However, after removing the total count display and capping totalPages at 15, there was no reason to keep Page:
totalHitsis an estimate (not accurate)- Total count is not shown in the UI
- Additional totalPages cap logic was needed (unnecessary complexity)
Changes
1) Search API: Page<Post> → Slice<PostSearchResponse>
// Beforepublic Page<Post> search(String keyword, Pageable pageable) { Page<Post> result = luceneSearchService.search(keyword, pageable); long maxAccessible = (long) MAX_SEARCH_PAGE * pageable.getPageSize(); if (result.getTotalElements() > maxAccessible) { return new PageImpl<>(result.getContent(), pageable, maxAccessible); } return result;}
// After — totalHits calculation removed, cap logic removed, snippet conversionpublic Slice<PostSearchResponse> search(String keyword, Pageable pageable) { Slice<Post> result = luceneSearchService.search(keyword, pageable); List<PostSearchResponse> responses = result.getContent().stream() .map(PostSearchResponse::from) .toList(); return new SliceImpl<>(responses, pageable, result.hasNext());}LuceneSearchService also uses the limit + 1 pattern to determine hasNext:
// Query limit + 1 to determine hasNext (Slice pattern)TopDocs topDocs = searcher.search(query, offset + limit + 1);boolean hasNext = topDocs.scoreDocs.length > offset + limit;return new SliceImpl<>(posts, pageable, hasNext);2) Snippet: Return 150-char summary instead of content (LONGTEXT)
Previously, search results sent content (LONGTEXT, avg ~13 KB) in its entirety for 20 results.
The frontend only displayed titles and discarded content, so 20 x 13 KB = ~260 KB was wasted.
public record PostSearchResponse( Long id, String title, String snippet, Long viewCount, Long likeCount, Instant createdAt) { public static PostSearchResponse from(Post post) { String plain = post.getContent().replaceAll("<[^>]*>", "").strip(); String snippet = plain.substring(0, Math.min(plain.length(), 150)); return new PostSearchResponse( post.getId(), post.getTitle(), snippet, post.getViewCount(), post.getLikeCount(), post.getCreatedAt()); }}| Before (full Post) | After (PostSearchResponse) | |
|---|---|---|
| content sent | ~13 KB (LONGTEXT) | 0 |
| snippet sent | None | ~150 B |
| Per 20 results | ~260 KB | ~3 KB |
| Reduction | ~99% |
3) Pagination: Sliding window + max 15 pages
Page 1: Prev [1] 2 3 4 5 6 7 8 9 10 NextPage 10: Prev 6 7 8 9 [10] 11 12 13 14 15 NextPage 15: Prev 6 7 8 9 10 11 12 13 14 [15] Next(disabled)- Google-style sliding window: show 10 pages around the current page
- Max 15-page limit: synchronized with backend
MAX_SEARCH_PAGE=15 - When
hasNext=false, page numbers end at that page (for low-frequency search terms)
Future Improvement: Lucene UnifiedHighlighter
The current snippet simply truncates the first 150 characters of the body. In the future, applying Lucene UnifiedHighlighter would:
- Extract text around where the search keyword appears (KWIC: Key Word In Context)
- Highlight search keywords with
<b>bold</b> - Achieve snippet quality on par with Google/Naver
Sources
OFFSET Pagination:
- Use The Index, Luke — No Offset
- Percona — Efficient Pagination Using Deferred Joins
- High Performance MySQL, 4th Edition — Optimizing LIMIT and OFFSET
COUNT(*) Elimination / Pagination Trade-offs:
- Google Drops Result Count From Search Results Page — Search Engine Roundtable (2024)
- Evolving API Pagination at Slack — Slack Engineering
- Percona — COUNT(*) for InnoDB Tables
- Spring Data JPA — Slice vs Page
- JHipster — Boost Infinite Scroll Performance with Slice
- Estimated Counts for Faster Django Admin — SquadStack Engineering
Naver Search Pagination:
Spring Data JPA Slice + nativeQuery Issues:
- Spring Data JPA #2260 — NativeQuery with Pagination
- Spring Data JPA #1782 — Slice returns PageImpl and executes COUNT with nativeQuery (DATAJPA-1464)
- Pagination in Spring Data JPA: Issues, Solutions, and 2026 Best Practices
- Vlad Mihalcea — Query Pagination with JPA and Hibernate
- GitHub Gist — Limit results using Specifications without count query
Pagination UX:
- Nielsen Norman Group — Users’ Pagination Preferences and “View All”
- Design Better Pagination — Andrew Coyle
- UX Patterns for Developers — Pagination Pattern
API Pagination Design:
- REST API Pagination Best Practices — Speakeasy
- API Pagination Explained: Techniques & Best Practices — QuarkAndCode
- Slack Developer Docs — Pagination
Thread Pool Tuning:
k6 Load Testing:

댓글
댓글 수정/삭제는 GitHub Discussions에서 가능합니다.