WikiEngine 총정리: 1,215만 건 검색 엔진의 설계부터 RAG까지

목차
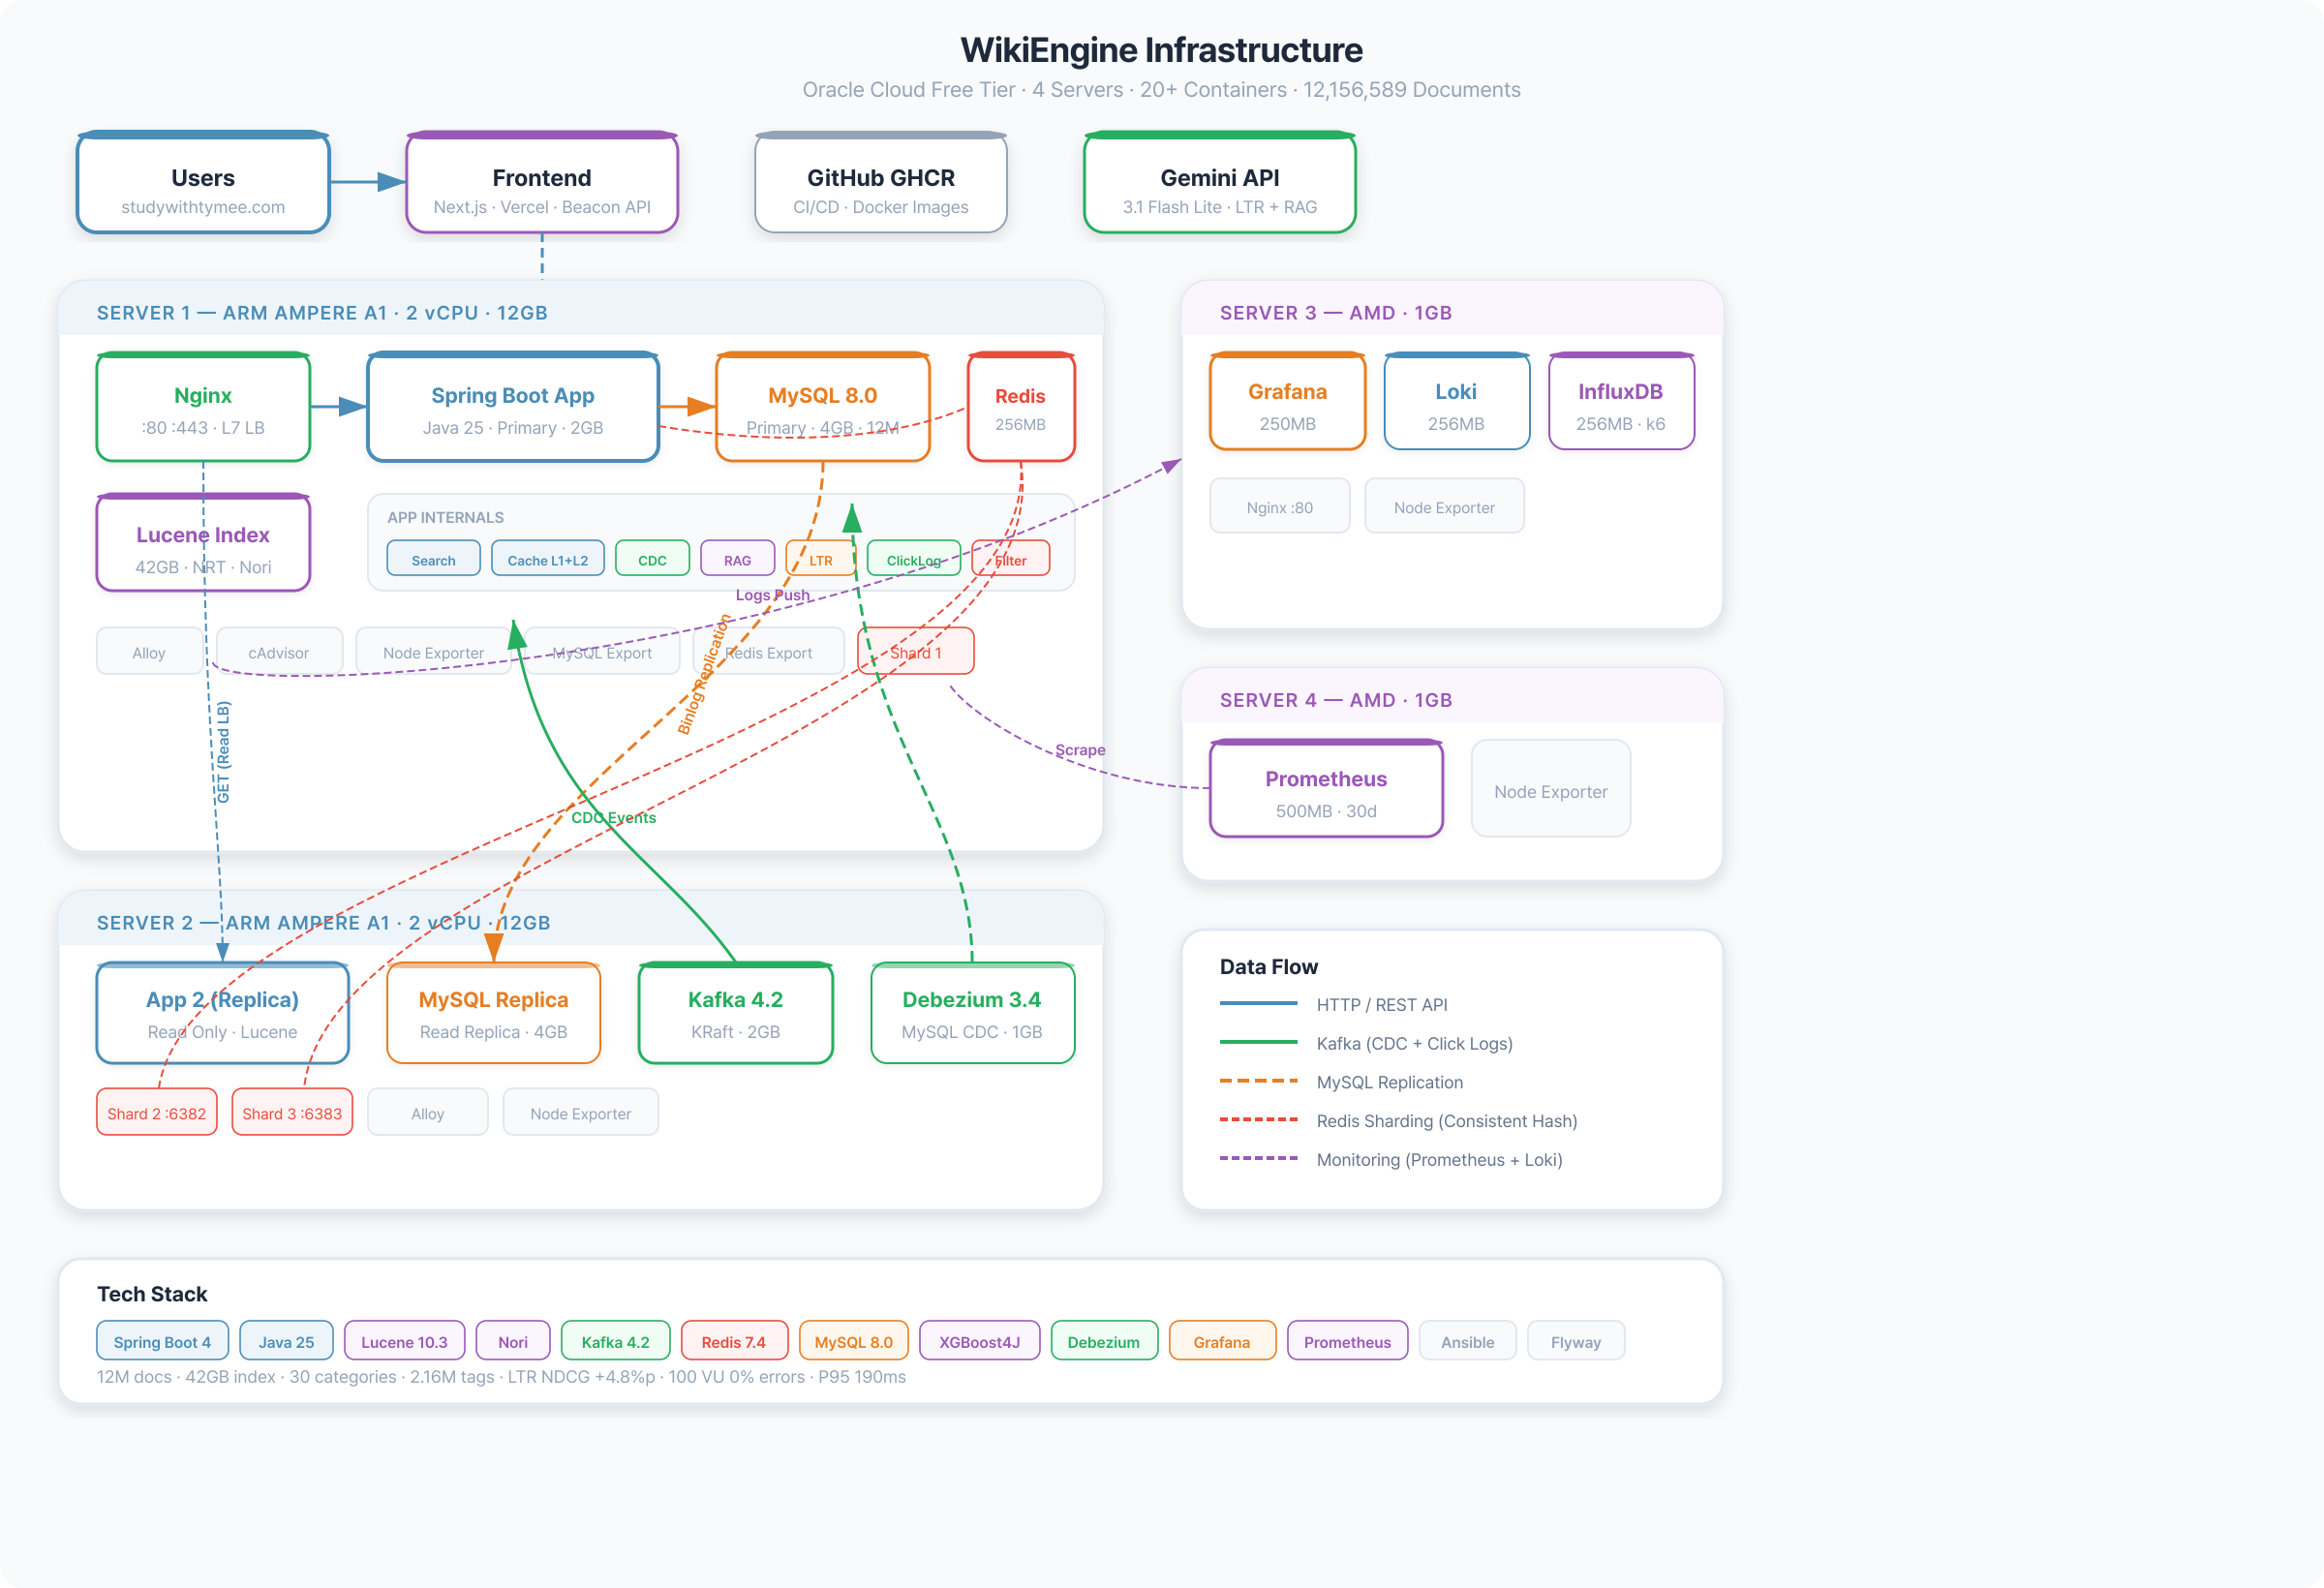
프로젝트 개요
WikiEngine은 나무위키, 한국어/영어 위키백과, 뉴스, 웹텍스트 등 6개 공개 데이터셋 12,156,589건을 커뮤니티 게시판 형태로 변환해 적재한 검색 엔진입니다. 위키 문서를 그대로 쓰지 않고 [[분류:XXX]]는 태그와 카테고리로 바꾸고, 뉴스/웹 콘텐츠는 소스별 고정 카테고리를 부여했으며, author_id는 10만 명의 더미 유저에게 균등 배정하고 created_at도 2020~2025 범위로 분산시켜 실제 서비스에 가까운 읽기 패턴이 나오도록 구성했습니다.
데이터 소스
| 소스 | 포맷 | 문서 수 | 설명 |
|---|---|---|---|
| 나무위키 (2021.03) | JSON | 571,364건 | 나무마크 본문, 한국어 커뮤니티 문서 |
| 한국어 위키백과 (2026.03) | XML | 739,791건 | MediaWiki XML 덤프 (ns=0 일반 문서만) |
| 영어 위키백과 (2026.02) | XML | 7,139,510건 | MediaWiki XML 덤프 (ns=0 일반 문서만) |
| 한국어 뉴스 | JSON | 159,639건 | 뉴스 기사 텍스트 |
| 한국어 웹텍스트 | JSON | 1,284,822건 | 웹 크롤링 텍스트 |
| C4 한국어 클린 | JSON | 2,261,463건 | 한국어 웹 코퍼스 |
| 합계 | 12,156,589건 | 30개 카테고리, 고유 태그 약 216만 개 |
사용한 기술
- Backend: Java, Spring Boot, Spring Batch, Spring Kafka, JPA/Hibernate
- Search/Data: Lucene, Nori, MySQL, Redis, Caffeine
- Messaging/Data Sync: Kafka, CDC
- Infra/DevOps: Docker, Nginx, Ansible, GitHub Actions
- Observability/Test: Prometheus, Grafana, k6
기능적 요구사항 정의
구현에 들어가기 전, 자동완성 시스템이 정확히 무엇을 해야 하는지부터 먼저 정의했습니다.
- 검색어 제안 기준: 최근 24시간 내 사용자가 입력한 검색어 빈도
- 제안 개수: 접두사당 상위 10개
- 지원 범위: 한국어/영어, 최대 60자 입력
- 응답 시간: 평균 입력 속도를 따라갈 수 있도록 240ms 이내
- 최신성: 추천 결과는 최대 1시간 지연 허용
- 일관성: 모든 사용자에게 동시에 같은 추천을 보여줄 필요는 없음
비기능적 요구사항 정의
기능만큼 중요했던 것은, 어느 정도 속도와 규모까지 감당해야 하는지를 먼저 수치로 정하는 일이었습니다.
- 처리 규모: 현재 인프라는 OCI Free Tier 2코어 ARM이므로 k6 부하 테스트 100 VU 기준으로 실측
- 응답 시간: 평균 입력 속도(초당 4자)보다 빨라야 하므로 최대 240ms 이내
- 데이터 최신성: 제안 결과가 최대 1시간 지연되어도 허용
- 일관성 모델: 최종 일관성(Eventual Consistency), 모든 사용자에게 동시에 동일한 제안을 보여줄 필요는 없음
설계 전 핵심 판단
요구사항을 정리한 뒤에는 어떤 기술을 쓸지보다, 어떤 구조가 가장 단순하고 합리적인지를 먼저 판단했습니다.
첫째, 자동완성을 설계할 때 가장 먼저 떠오른 것은 Trie였지만, 대용량 문서와 최대 60자 입력 길이를 기준으로 보면 모든 후보를 메모리에 유지하는 비용이 너무 컸고, 특히 1~2글자 접두사에서는 후보 분기가 급격히 늘어나 결과를 인기순으로 다시 정렬하는 과정까지 포함하면 목표 응답시간 안에 안정적으로 처리하기 어렵다고 봤습니다. 그래서 입력 시마다 후보를 다시 탐색하는 방식 대신, 접두사별 상위 추천 결과를 미리 집계해두고 요청 시 바로 반환하는 방향이 장기적으로 더 적합하다고 판단했습니다.
둘째, 자동완성 조회와 검색어 집계는 겉으로는 같은 기능처럼 보이지만 요구사항이 완전히 달랐습니다. 자동완성은 매우 짧은 응답시간이 중요했고, 검색어 집계는 약간의 지연을 허용하더라도 안정적인 누적이 중요했습니다. 그래서 조회 경로와 집계 경로를 분리해, 빠르게 보여주는 구조와 안정적으로 모으는 구조가 서로를 방해하지 않게 했습니다.
셋째, 추천 결과가 최대 1시간 늦게 반영되어도 괜찮다면 모든 입력을 실시간으로 처리하는 복잡한 구조보다 일정 주기로 모아 집계하는 방식이 더 적합했습니다. 이 판단 덕분에 조회 시점에는 정렬이 끝난 결과를 바로 반환하고, 무거운 계산은 뒤로 미루는 구조를 만들 수 있었습니다.
1. 검색 엔진 전환: MySQL LIKE에서 Lucene까지
1단계 정상 상태: MySQL LIKE 검색
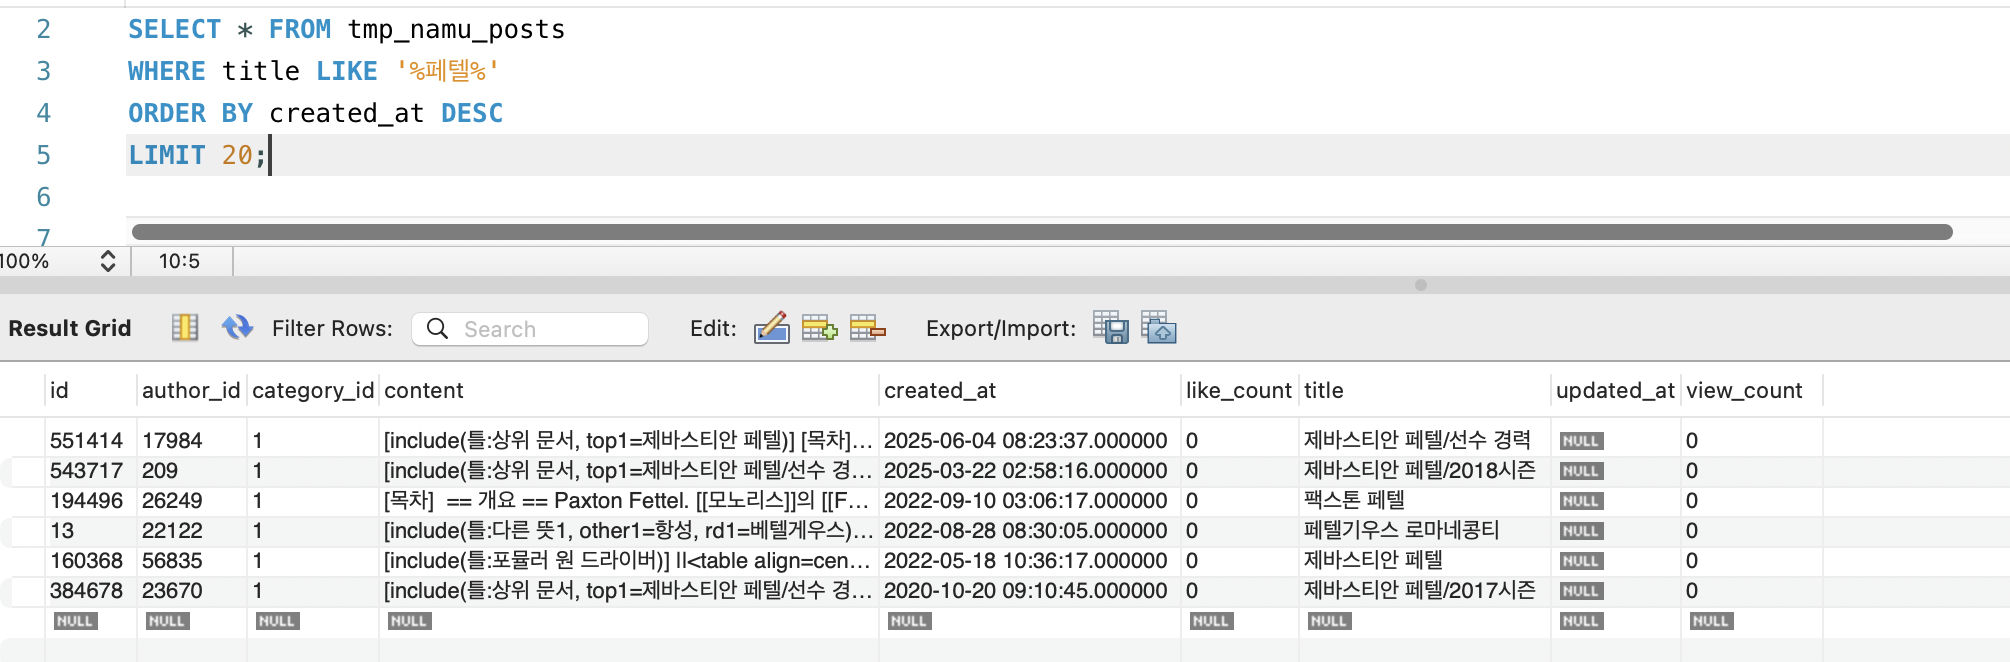
초기 검색은 MySQL LIKE '%keyword%'로 본문을 검색했습니다. posts 테이블은 id(PK, BIGINT AUTO_INCREMENT), title(VARCHAR 500), content(MEDIUMTEXT, 평균 6,586자), category_id(FK), view_count(BIGINT), like_count(BIGINT), created_at(DATETIME) 구조였고, categories는 posts:categories = N:1 관계였습니다. 데이터는 이미 1,215만 건이었고, content에는 위키 마크업이 포함돼 있어 평균 행 크기도 컸습니다.
2단계 문제 인식: 타임아웃과 cascade failure
k6 부하 테스트에서 검색 API가 5,000ms 이상 타임아웃되는 현상이 반복됐습니다. EXPLAIN으로 확인한 결과 type=ALL, rows=27,443,742였고, 결국 전체 테이블을 순차 스캔하고 있었습니다. LIKE '%keyword%'는 앞에 와일드카드가 있어 B-Tree 인덱스를 사용할 수 없고, 2,700만 건이 넘는 MEDIUMTEXT를 행마다 문자열 비교해야 했습니다. 더 심각했던 문제는 타임아웃 자체보다 cascade failure였습니다. 검색 쿼리 하나가 HikariCP 커넥션을 수 초간 점유하면 목록 조회, 상세 조회, 게시글 작성까지 커넥션을 얻지 못해 전체 서비스가 마비될 수 있었습니다.
3단계 문제 분석: 왜 MySQL 전문 검색은 한계인가
1차 시도: FULLTEXT ngram 인덱스
첫 번째 시도는 MySQL FULLTEXT ngram 인덱스였습니다. 일부 쿼리에서는 12초 → 6ms로 개선되며 분명한 효과가 있었습니다. 하지만 고빈도 토큰 대한처럼 매우 자주 등장하는 2글자 토큰에서는 다시 posting list 순회가 폭발했고, 5,000ms 이상 타임아웃이 재발했습니다.
문제는 성능만이 아니었습니다. ngram은 형태소 분석이 아니라 단순 2글자 분해이기 때문에 false positive가 많았고, 1,215만 건 x 평균 6,586자 x ngram 토큰 조합을 계산하면 인덱스 크기가 300GB+로 추정됐습니다. 당시 서버 디스크가 47GB 수준이었기 때문에 물리적으로 저장하는 것 자체가 불가능했습니다. MySQL FULLTEXT의 boolean mode는 50% 이상 문서에 포함된 term을 자동 제외하는데, 위키 데이터에서는 한국어 조사나 흔한 어미가 그 임계값을 넘으면서 검색 결과에서 빠지는 문제도 있었습니다. 이 단계에서 확인한 것은 “조금 더 빠른 MySQL 검색”이 아니라, MySQL 전문 검색이 현재 데이터 특성에 구조적으로 맞지 않는다는 사실이었습니다.
4단계 대안 비교: 어떤 검색 엔진이 현재 제약에 맞는가
이 단계의 핵심 질문은 “기능이 가장 많은 검색 엔진이 무엇인가”가 아니라, “지금 이 한 대의 서버에서 실제로 감당 가능한 검색 구조가 무엇인가”였습니다. 당시 환경은 2코어, 12GB RAM 단일 서버에서 애플리케이션, MySQL, Nginx가 함께 동작하는 구조였고, 먼저 필요했던 것은 대규모 분산 검색보다 타임아웃 없이 검색이 동작하고 인덱스를 현실적으로 운영할 수 있는 경로를 확보하는 일이었습니다.
Elasticsearch와 OpenSearch는 검색 기능과 운영 도구가 풍부하고, 분산 검색으로 확장하기에도 유리합니다. 하지만 이 프로젝트에서는 검색 엔진을 별도 프로세스로 올리는 순간 메모리 사용량과 운영 복잡도가 함께 증가하는 점이 더 크게 보였습니다. 특히 검색 엔진은 JVM 힙뿐 아니라 인덱스 파일을 위한 페이지 캐시도 충분히 필요하기 때문에, 단일 서버 환경에서는 별도 검색 프로세스를 추가하는 것 자체가 부담이었습니다. 관리형 OpenSearch도 검토했지만, 비용이 커질 뿐 아니라 MySQL과 검색 엔진 사이의 동기화 문제는 여전히 별도로 해결해야 했습니다.
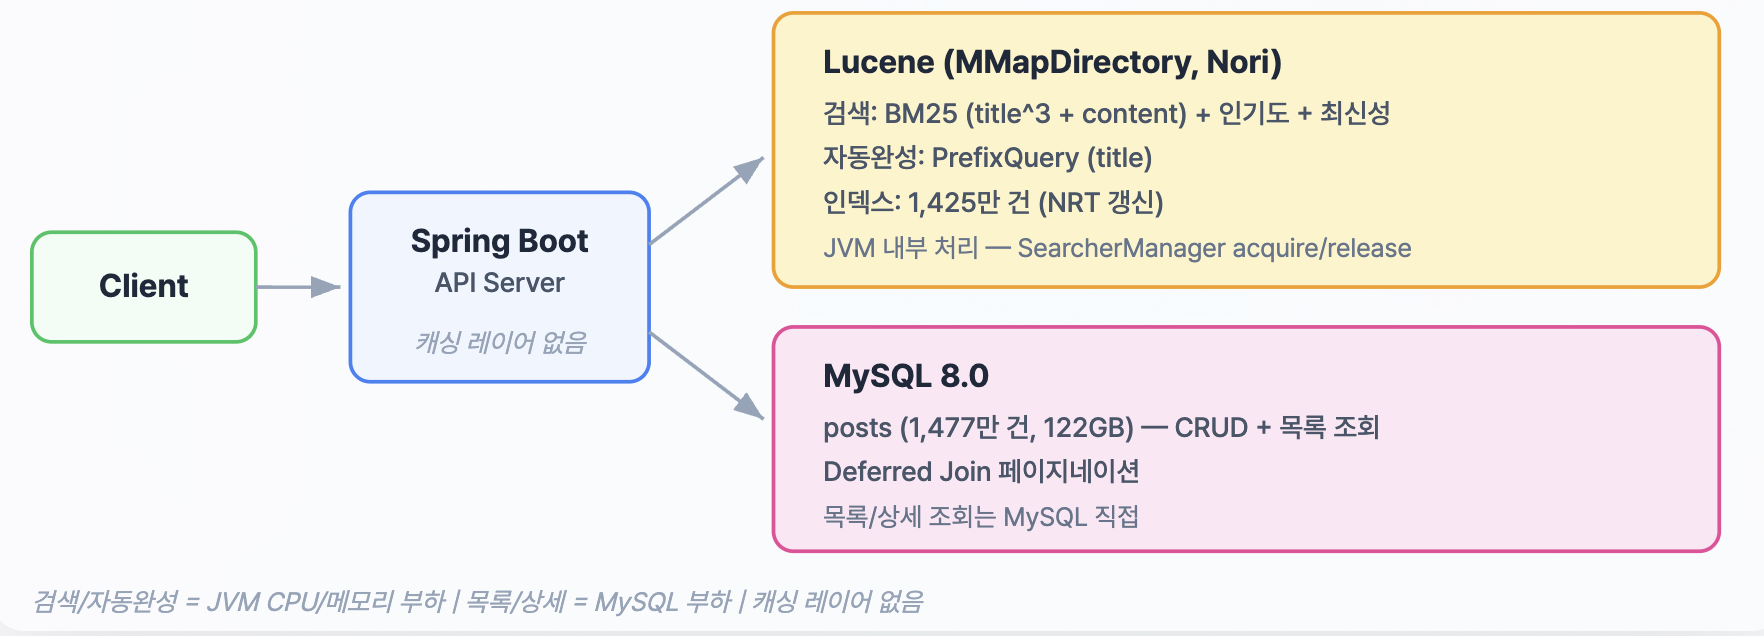
반면 임베디드 Lucene은 애플리케이션 내부에서 직접 제어할 수 있었고, 별도 프로세스 없이 현재 서버 자원 안에 포함시킬 수 있었습니다. 네트워크 홉 없이 검색 경로를 단순하게 유지할 수 있었고, 한국어 형태소 분석, 랭킹 조정, 하이라이팅 같은 기능도 필요한 수준까지 직접 제어할 수 있었습니다. 즉, 이 단계에서 Lucene은 가장 화려한 선택이라기보다 단일 서버라는 제약 안에서 가장 현실적으로 운영 가능한 선택에 가까웠습니다.
5단계 결과: Lucene 전환 후 무엇이 해결됐고, 무엇이 남았을까
Lucene으로 전환한 뒤 가장 먼저 달라진 것은, 본문 검색이 더 이상 타임아웃에 기대는 기능이 아니라 안정적으로 응답하는 기능이 되었다는 점이었습니다. 일부 검색어에서 5초 이상 지연되거나 실패하던 본문 검색은 29ms, P95 100ms 수준으로 안정화됐습니다. 제목과 본문 가중치, 인기도, 최신성 같은 신호를 반영해 랭킹을 조정하면서 P@10도 0.827 → 0.853으로 개선됐습니다.
다만 검색 엔진을 바꿨다고 해서 전체 읽기 경로 문제가 한 번에 해결된 것은 아니었습니다. 본문 검색은 빨라졌지만, 최신 게시글 목록 조회에서는 COUNT(*)와 deep OFFSET 비용이 그대로 남아 있었고, 이 경로가 다시 전체 시스템의 병목으로 드러났습니다. 그래서 이후에는 검색 엔진 자체를 더 바꾸기보다, 읽기 경로를 다시 나눠서 봤습니다. 불필요한 전체 건수 계산은 제거하고 deep OFFSET이 비싼 경로는 별도 최적화 구조로 바꾸면서 병목을 줄였고, 그 결과 COUNT(*) 2,038ms를 제거하고 최신 게시글 목록 조회를 2,518ms → 17.56ms로 줄였으며, 에러율도 32.53% → 0%로 해소했습니다.
관련 글: 검색 시스템 장애 방지, FULLTEXT ngram 인덱스, Lucene 전환, 검색 품질 평가, Deferred Join 최적화, 쿼리 리팩토링
2. 캐시 전략 + 자동완성: 반복 계산을 줄이고 품질을 먼저 올린 단계
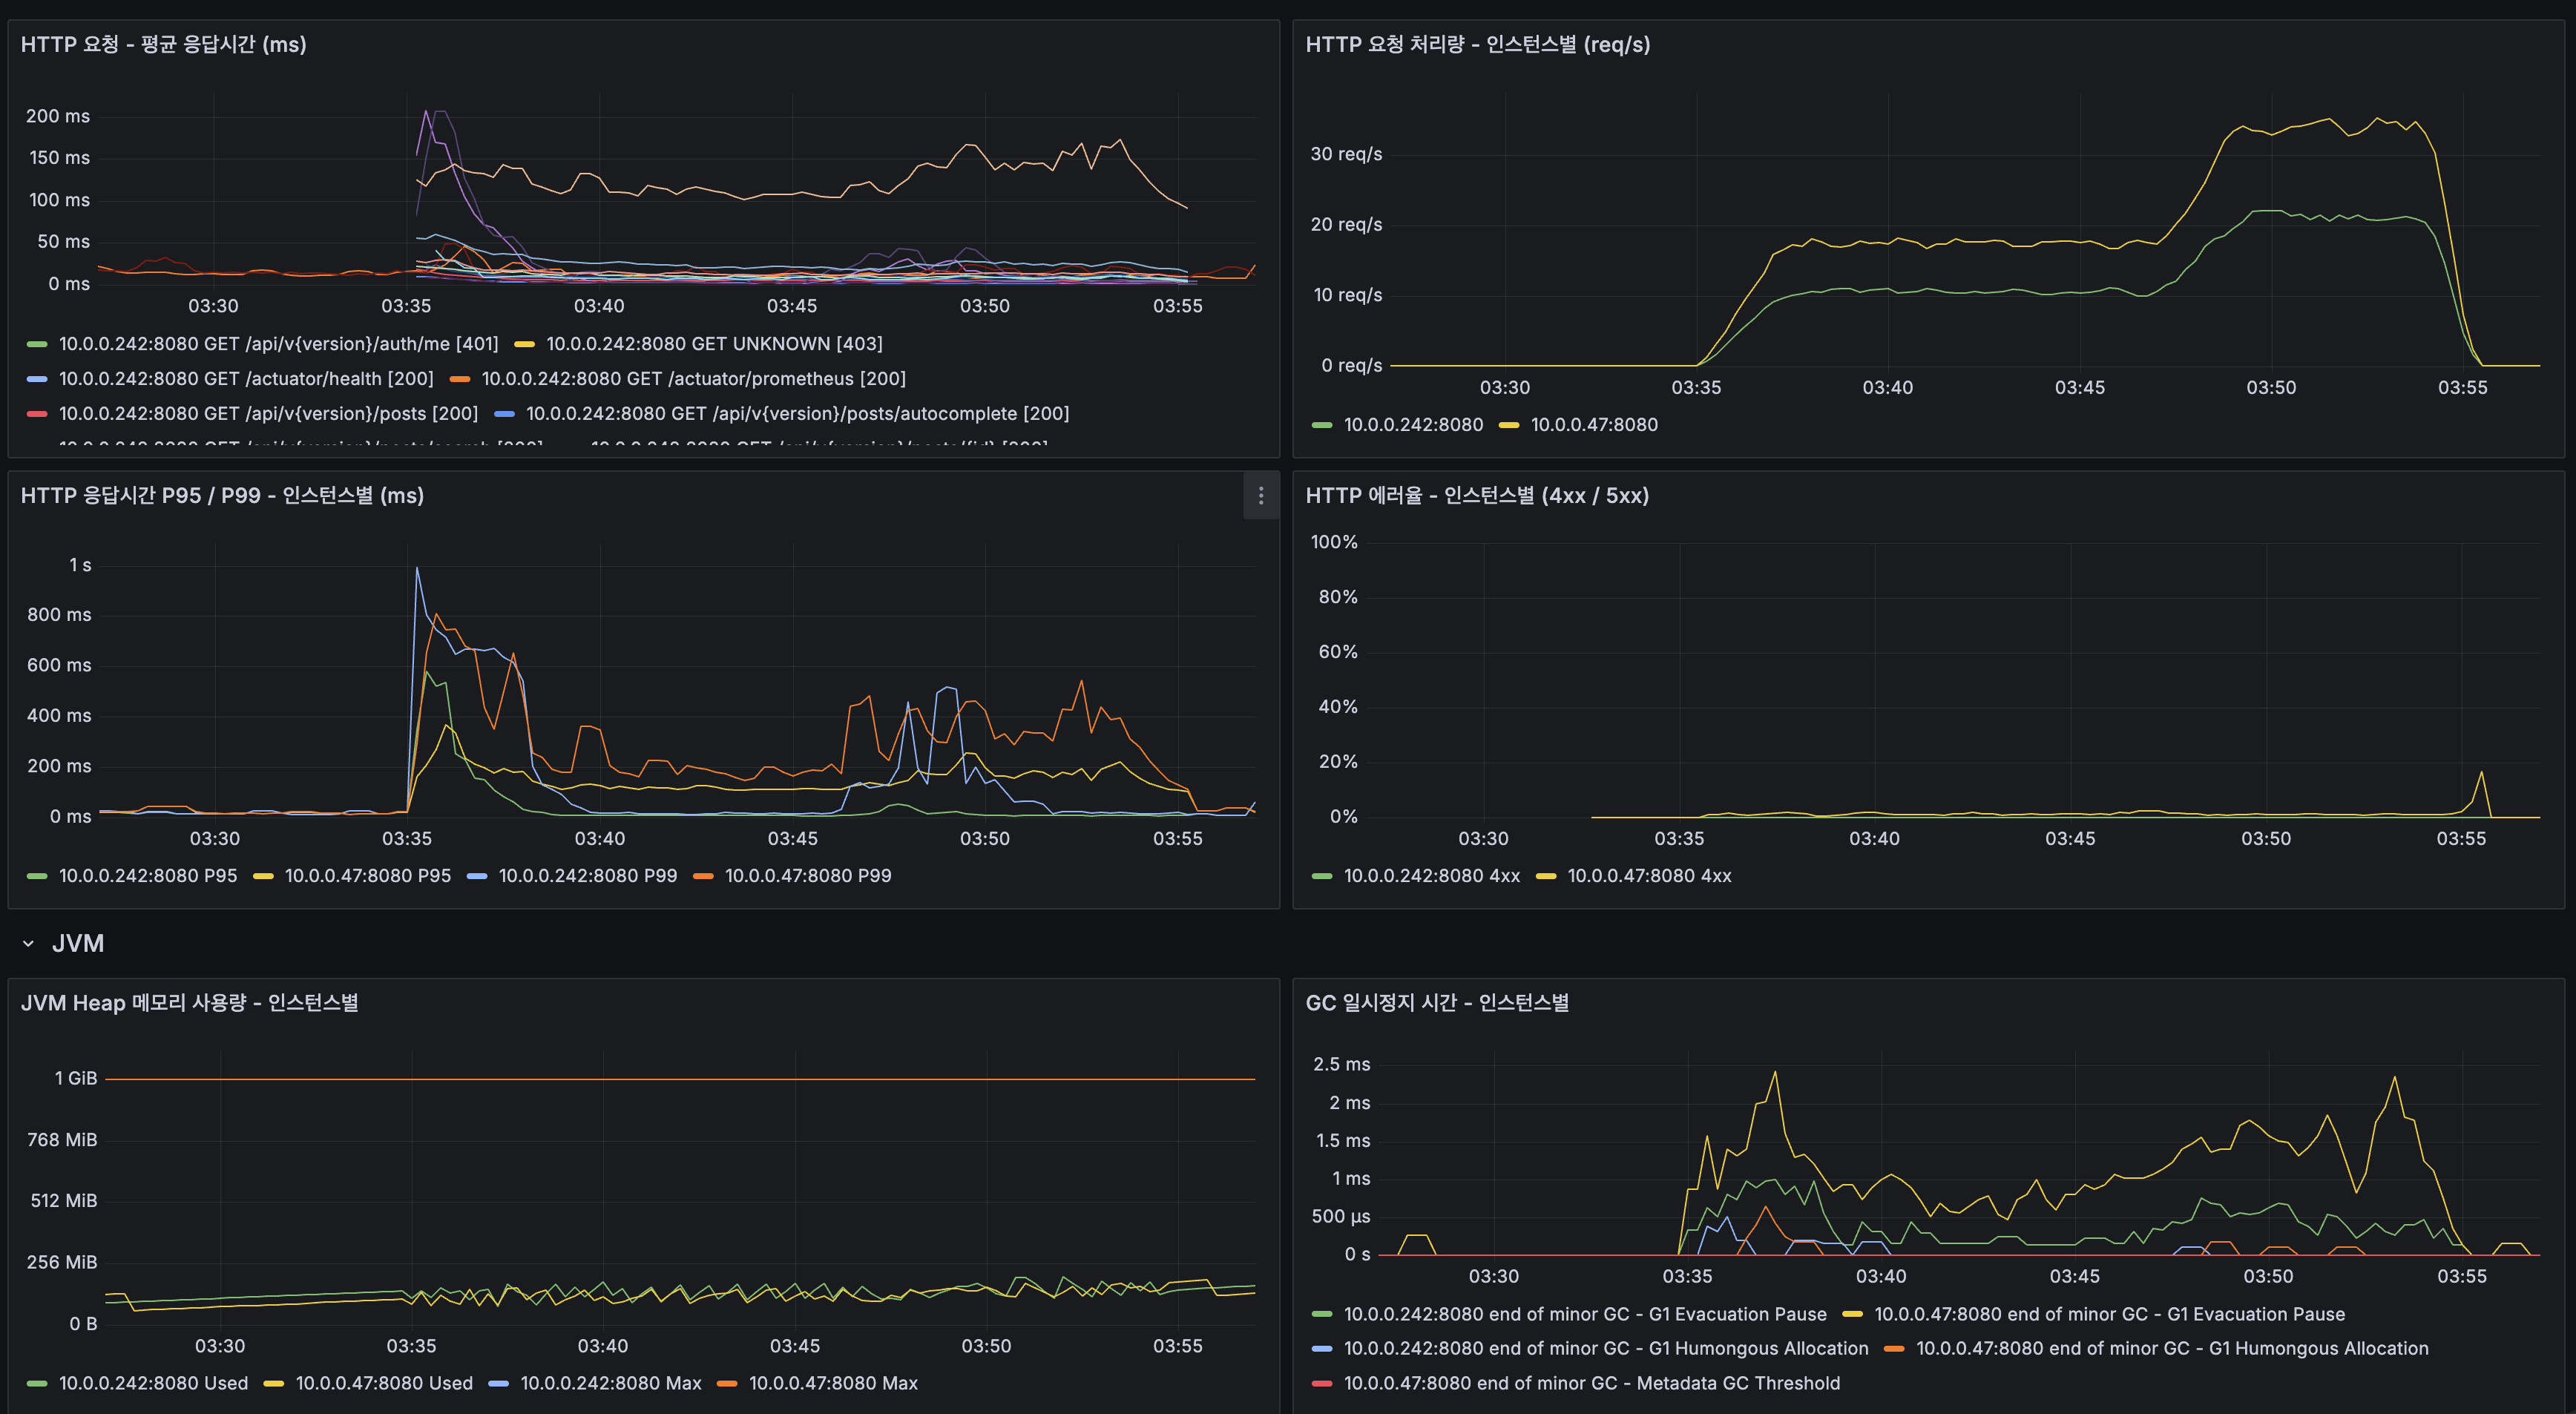
Lucene 검색 자체는 29ms까지 내려왔지만, 동일한 검색어에 대해 매번 인덱스를 다시 탐색하는 것은 여전히 CPU를 반복적으로 소모하는 작업이었습니다. 실제 검색 트래픽은 소수의 인기 검색어에 요청이 집중되는 분포를 보였고, k6 부하 테스트에서도 BM25 + FeatureField + RecencyDecay 계산이 CPU를 지속적으로 태우면서 100 VU 구간에서 CPU 80~100% 포화가 나타났습니다.
이 단계에서 고민한 것은 “어디에 캐시를 둘 것인가”보다, “어떤 요청을 얼마나 빠르게 다시 돌려줄 것인가”였습니다. 검색 결과는 정적 리소스처럼 단순하게 외부 캐시로 밀어두기 어렵고, 키워드와 페이지 조합에 따라 경우의 수가 빠르게 늘어납니다. 반면 같은 인스턴스에서 반복되는 요청은 네트워크 비용 없이 즉시 반환하는 편이 가장 효율적이었습니다. 그래서 우선은 애플리케이션 내부에서 가장 가까운 위치에 캐시를 두는 선택이 더 적합하다고 봤습니다.
그 결과 Caffeine L1 로컬 캐시를 적용했고, searchResults 히트율은 81.8%, autocomplete 히트율은 99.9%, postDetail 히트율은 40.5%를 기록했습니다. 전체 응답시간은 775.89ms → 53.83ms로 14.4배 개선됐습니다. 이 수치는 캐시가 가장 잘 맞는 유리한 벤치마크가 아니라, 희귀·중빈도·고빈도 검색어와 랜덤 상세 조회를 섞어 캐시 미스가 계속 발생하도록 구성한 보수적인 조건에서 얻은 결과였습니다.
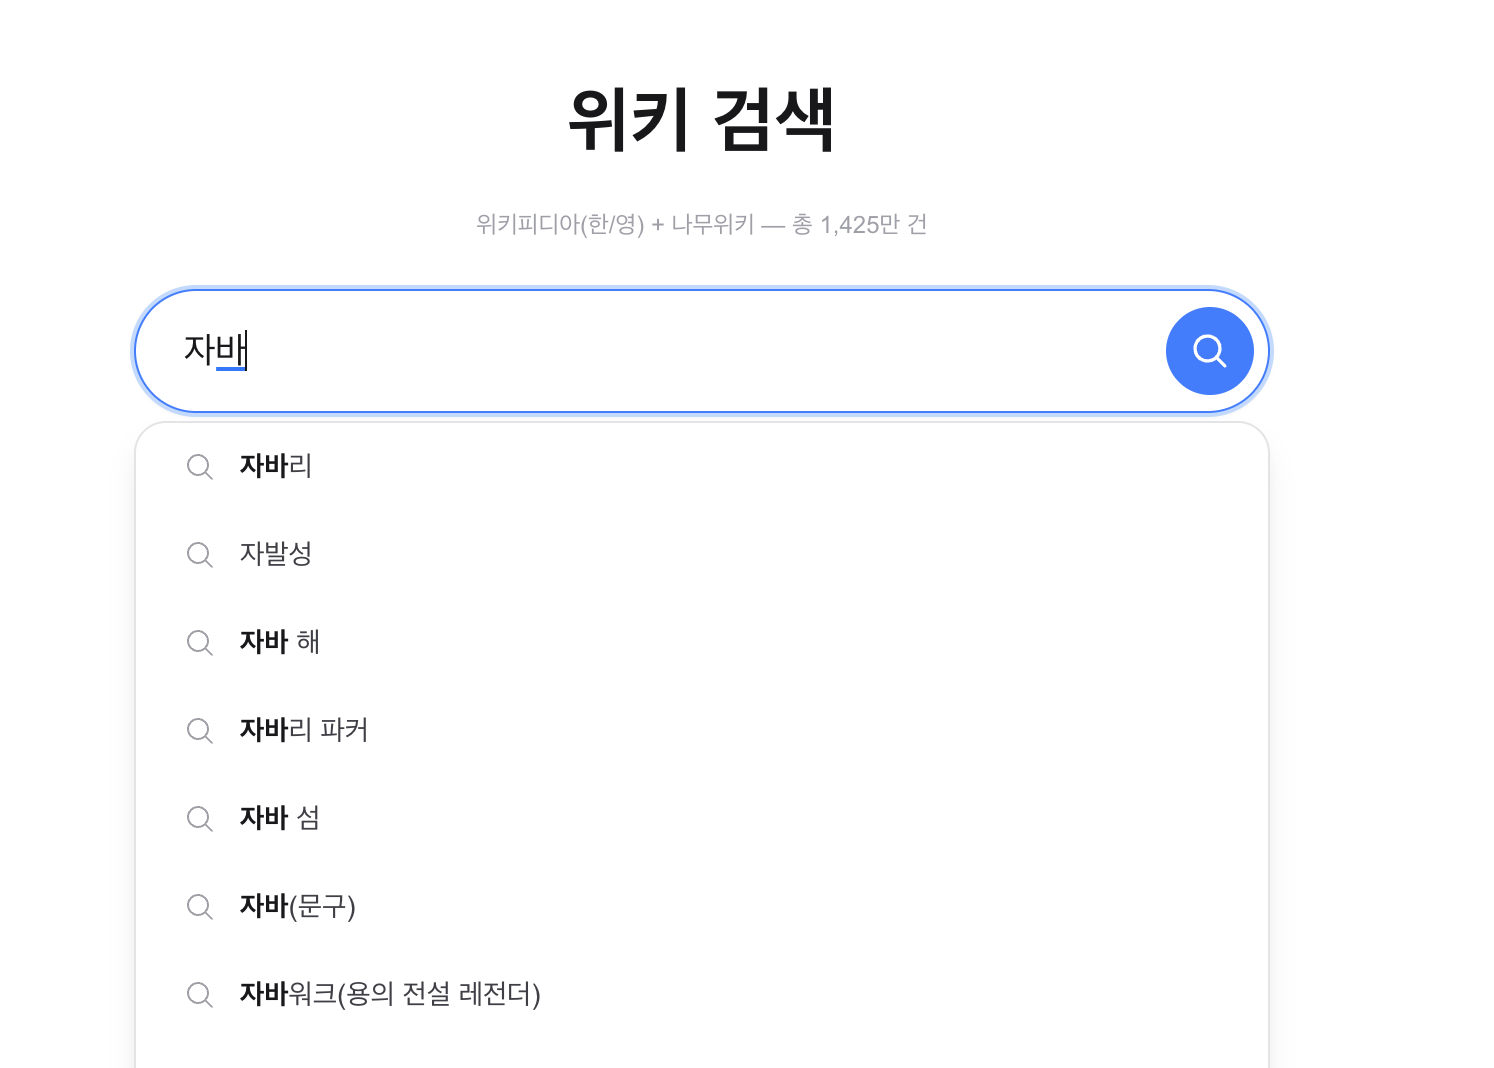
자동완성은 별도의 품질 문제가 있었습니다. 속도는 빨라졌지만, Prefix 기반 자동완성은 결과를 사전순으로 반환했기 때문에 삼성을 입력해도 사용자가 기대하는 삼성전자보다 르노삼성 QM3 같은 결과가 먼저 나왔고, 한글은 자모 단위로 입력되기 때문에 삼ㅅ처럼 완성되지 않은 입력에서는 추천이 끊겼습니다. 이 문제를 해결하기 위해 검색 로그 기반 인기 검색어를 인메모리 Trie에 적재하고, 접두사 입력 시 DFS로 Top-10 제안을 반환하도록 구성했습니다. 여기에 초성·중성·종성 분해를 적용해 삼ㅅ → 삼성전자처럼 한글 중간 입력도 자연스럽게 처리했습니다.
이 단계에서 Trie는 인기순 추천과 한글 자모 입력 문제를 해결하는 데 효과적이었습니다. 다만 조회 시마다 DFS 탐색과 정렬 비용이 따라오고, 갱신 과정에서 Copy-on-Write 방식으로 인한 메모리 부담이 있었기 때문에, 이 구조는 이후 분산 환경과 스케일아웃 단계에서 다시 한 번 바뀌게 됩니다. 즉, 이 단계의 목적은 자동완성을 최종 구조로 완성하는 것이 아니라, 로컬 캐시와 Trie를 통해 체감 품질을 먼저 끌어올리는 데 있었습니다.


3. 분산 아키텍처: 서버를 늘리기 전에 상태, 읽기 부하, 변경 전파를 분리한 과정
단일 서버 한계 발견
읽기 경로 최적화와 자동완성 품질 개선까지 마친 뒤, 단일 서버 환경에서 k6 stress 테스트(200 VU, 25분)를 수행했습니다. 그 결과 100 VU 수준에서는 비교적 안정적이었지만, 200 VU 구간에 진입한 뒤 약 5분부터 CPU가 100%까지 포화되고 Load Average가 20+까지 치솟으면서 시스템 전체 응답시간이 급격히 무너지기 시작했습니다. P95는 1,413ms까지 상승했고, 처리량도 오히려 떨어졌습니다.
중요했던 것은 병목의 원인이 단순한 설정 문제가 아니라는 점을 구분하는 일이었습니다. 메모리 사용량은 여유가 있었고, GC pause도 최대 3ms 수준으로 안정적이었으며, DB 버퍼 풀 히트율도 100%에 가까웠고 락 경합도 거의 없었습니다. 반면 CPU만 지속적으로 포화됐고, 커넥션 대기나 스레드 적체는 그 결과로 따라오는 증상이었습니다. 즉, 이 시점의 병목은 메모리나 I/O가 아니라 검색과 조회 경로에서 반복적으로 발생하는 CPU 연산 자체였습니다.
3-1. Stateless 전환 + 공유 상태 외부화
가장 먼저 든 판단은 “서버를 더 늘리기 전에, 애플리케이션 안에 남아 있는 상태부터 밖으로 꺼내야 한다”는 것이었습니다. 당시 애플리케이션 내부에는 로컬 캐시, Trie 기반 자동완성, 토큰 무효화 상태처럼 인스턴스마다 달라질 수 있는 데이터가 남아 있었습니다. 이 상태로 App 인스턴스만 늘리면 요청은 분산될 수 있어도 캐시 히트율은 서버별로 갈라지고, 자동완성 결과도 어떤 서버가 응답하느냐에 따라 달라지며, 로그아웃된 토큰이 다른 서버에서는 다시 유효하게 보이는 문제가 생깁니다.
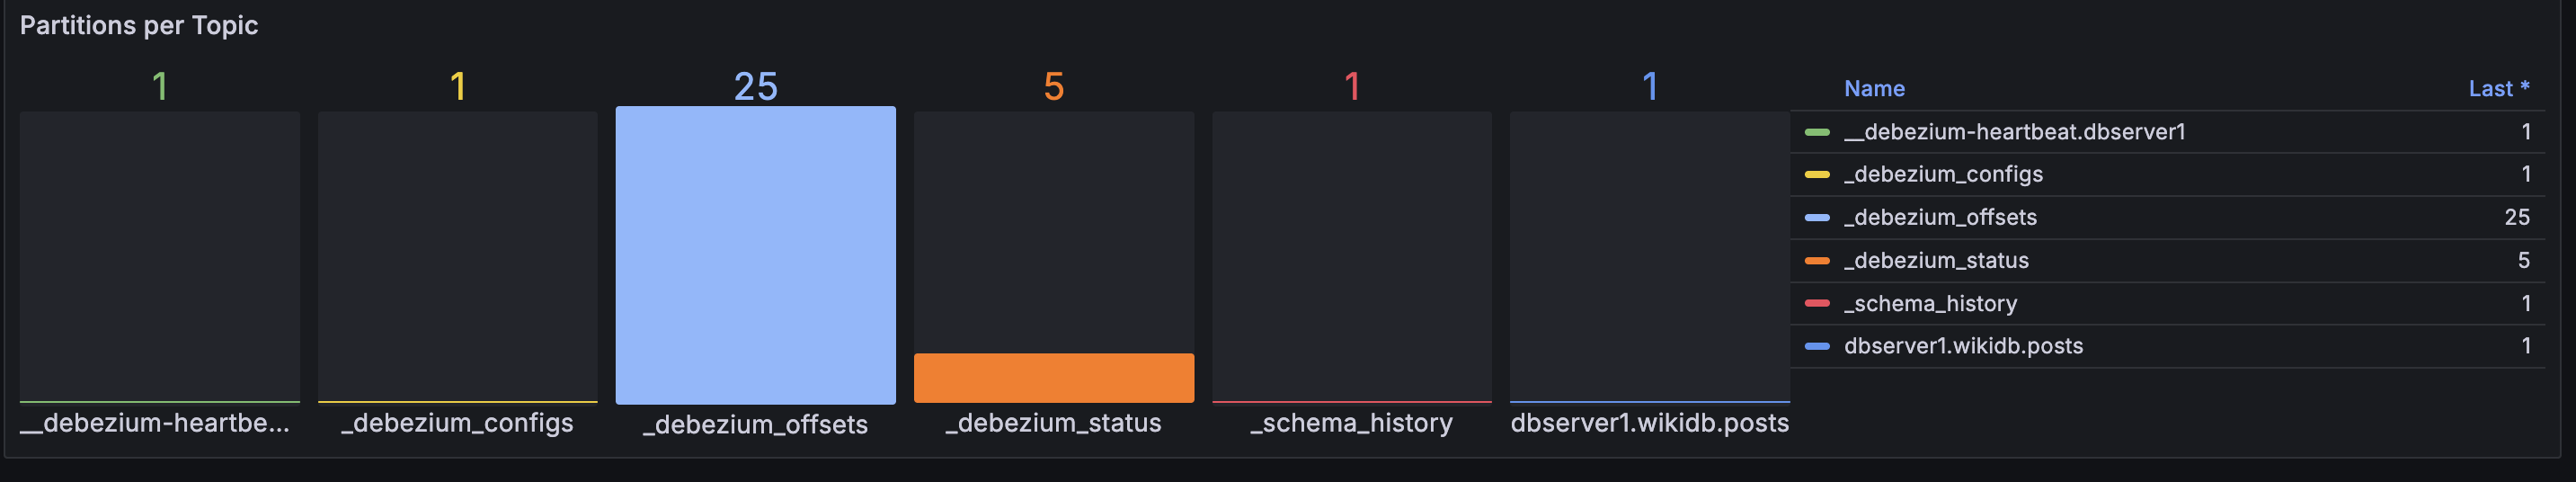
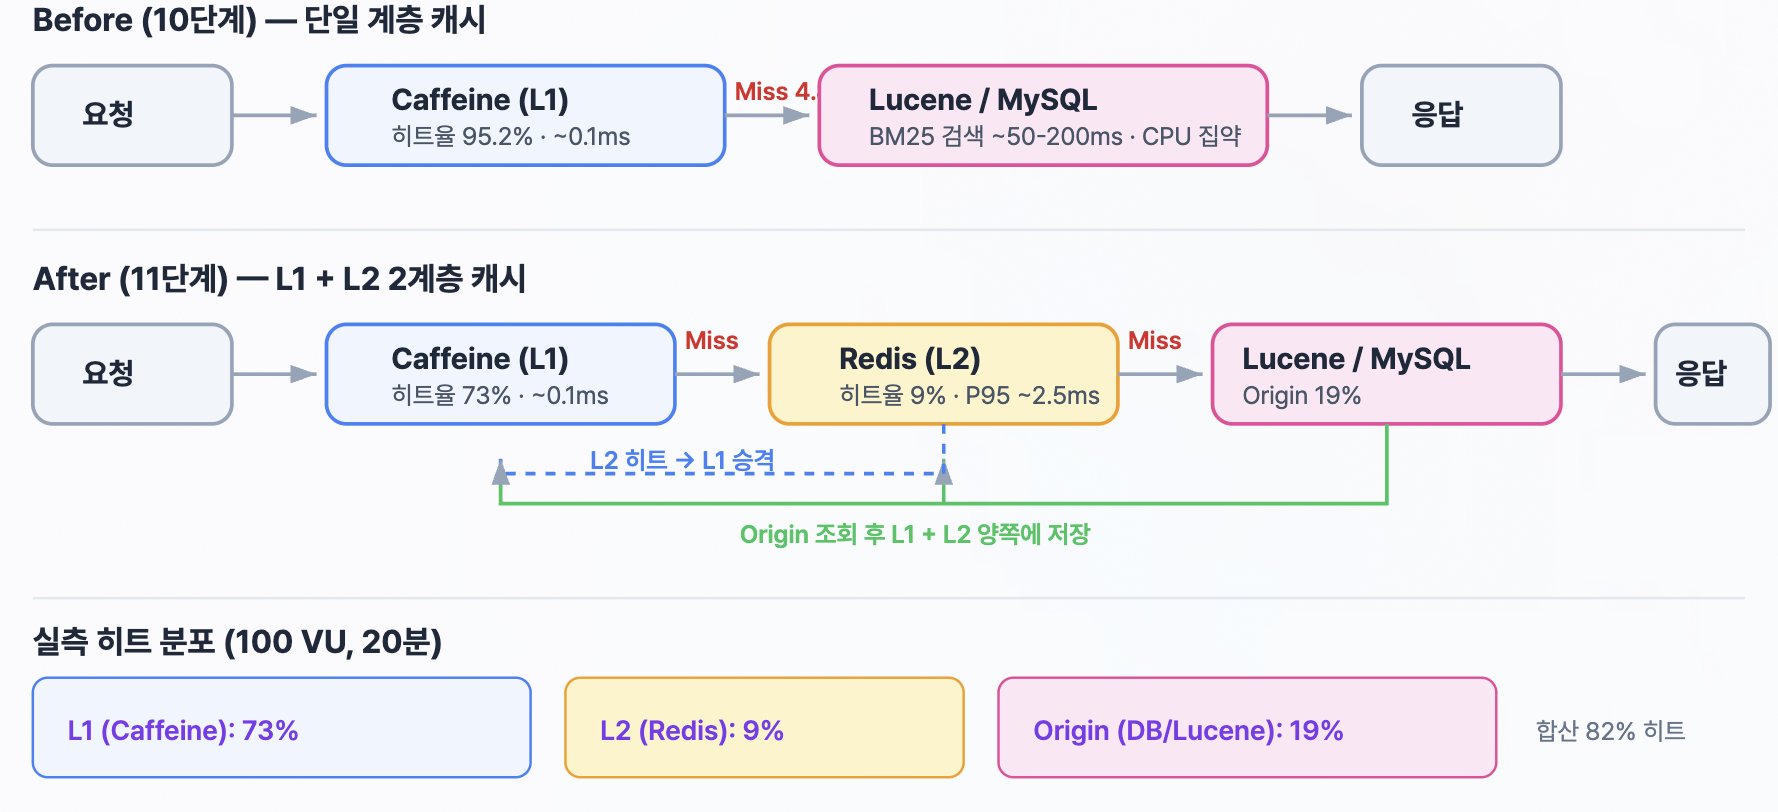
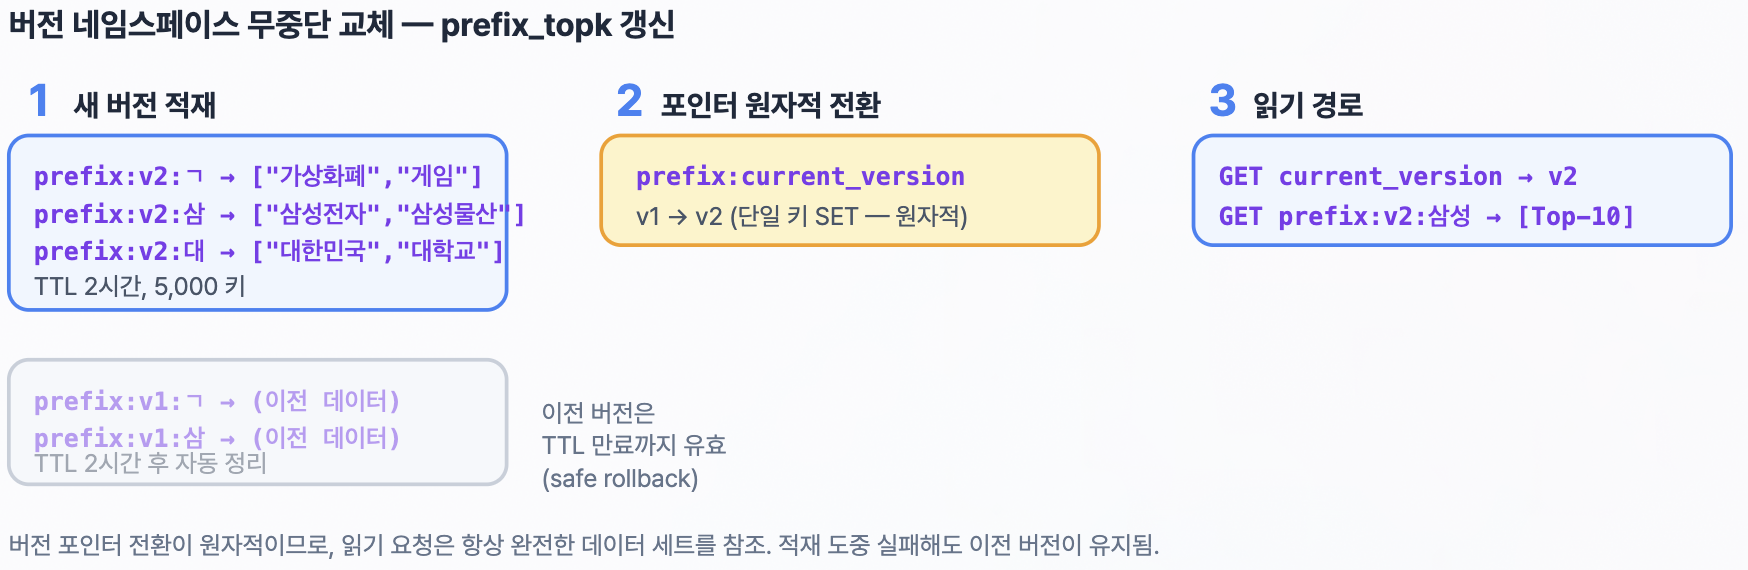
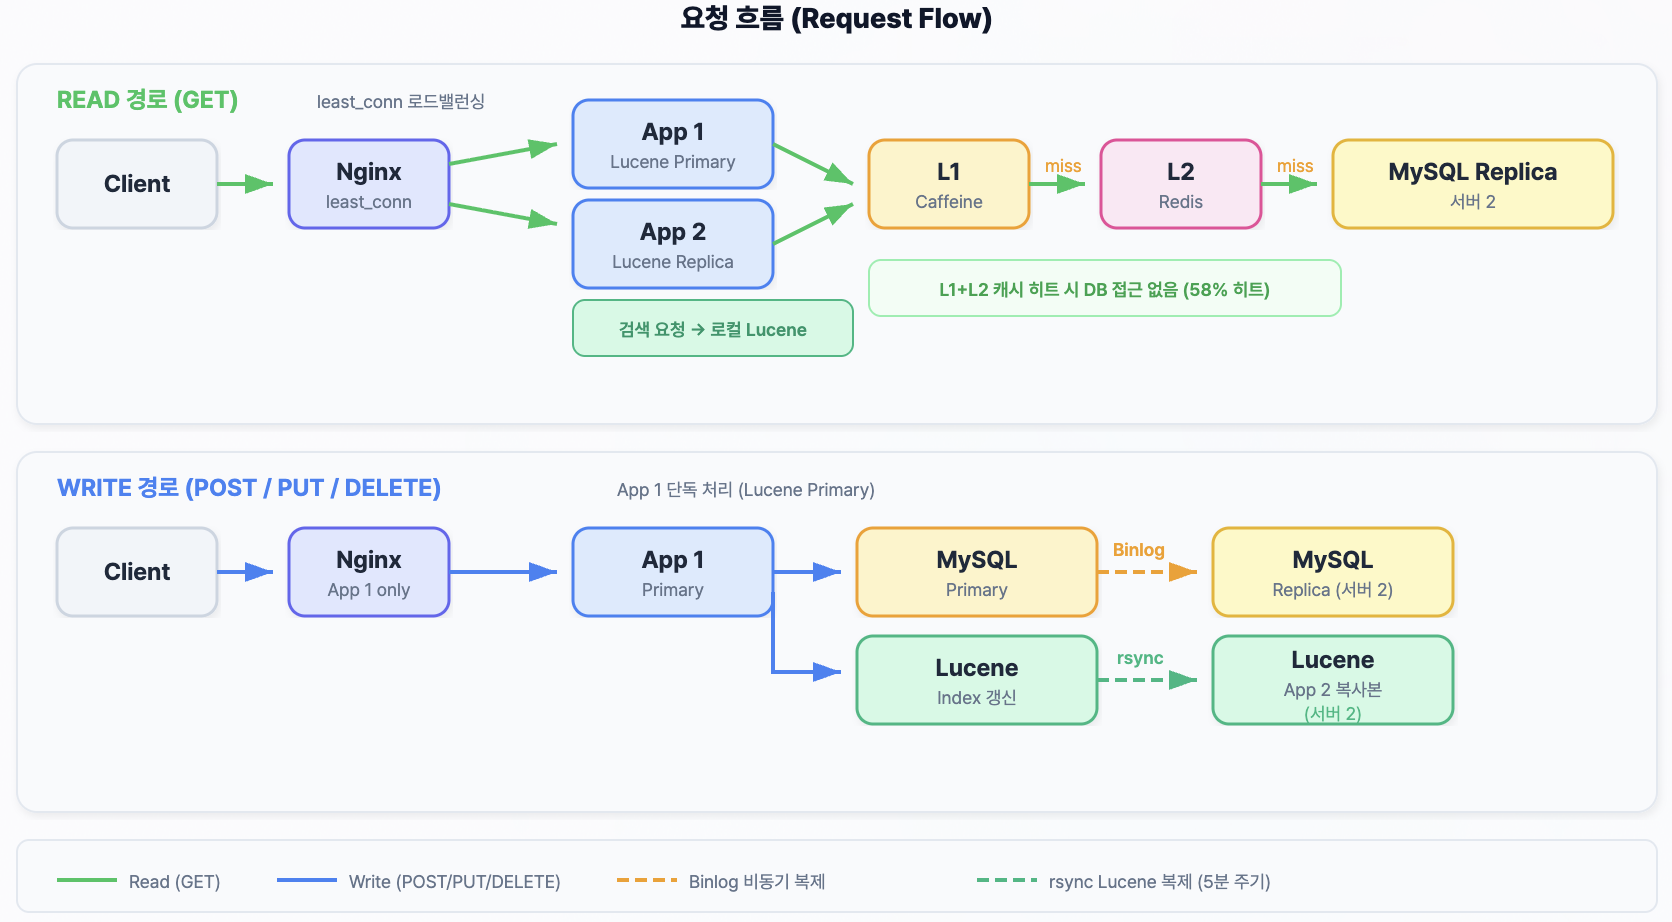
그래서 이 단계에서는 모든 것을 무조건 외부화하기보다, 요청을 가장 빠르게 처리해야 하는 부분은 가까운 곳에 두고 인스턴스 간에 반드시 공유되어야 하는 상태만 밖으로 꺼내는 방향을 선택했습니다. 검색 결과는 같은 인스턴스에서 반복되는 요청을 가장 짧은 경로에서 처리하고, 그 외의 미스는 공유 캐시가 보완하도록 2계층 구조로 나눴습니다. 자동완성도 인메모리 Trie를 그대로 유지하기보다, 접두사별 추천 결과를 미리 계산해 공유 저장소에서 바로 읽는 구조로 바꾸면서 어떤 인스턴스가 응답하더라도 동일한 추천 결과를 돌려줄 수 있게 했습니다.
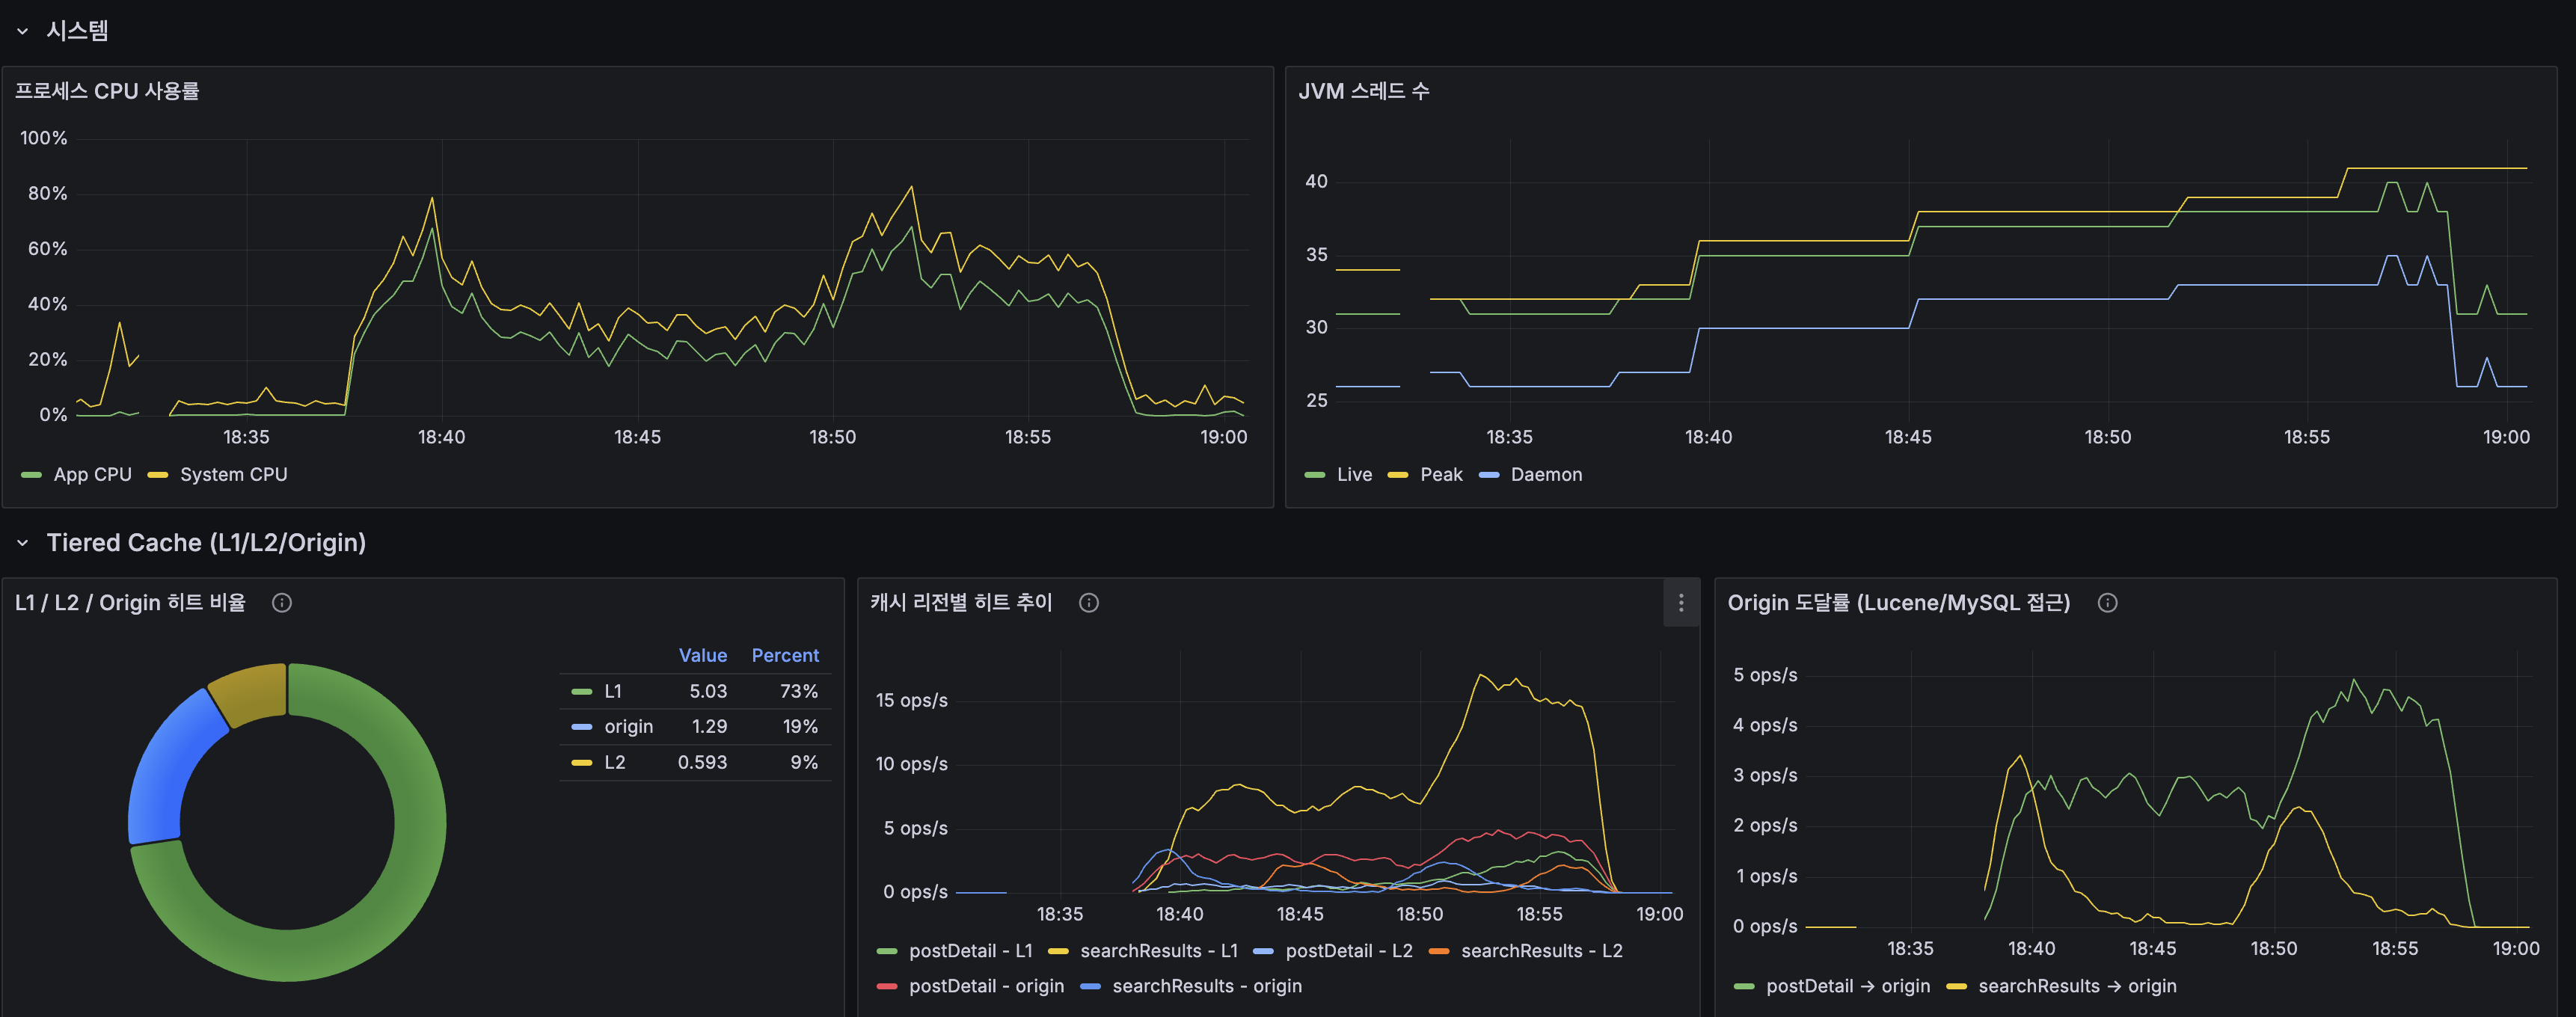
이후 구조에서는 총 캐시 히트율이 82%까지 올라갔고, DB와 검색 엔진까지 실제로 도달하는 비율은 19% 수준으로 낮아졌습니다. 자동완성은 Trie DFS에서 접두사별 flat KV 조회로 전환되면서 응답 경로를 단순화했고, 인스턴스 간 결과 일관성도 확보했습니다.
3-2. 읽기/쓰기 분리: App 스케일아웃 전에 DB 경로를 먼저 나눈 이유
이 단계에서 본질적인 질문은 “지금 MySQL이 느린가?”가 아니라, “App 인스턴스를 늘린 뒤에도 현재 DB 구조가 버틸 수 있는가?”였습니다. 당시 측정 기준으로 보면 MySQL은 직접적인 병목이 아니었습니다. 버퍼 풀 히트율도 높았고, Slow Query도 거의 없었으며, CPU 역시 여유가 있었습니다. 하지만 그렇다고 해서 DB를 그대로 둔 채 App만 2대로 늘리는 것이 안전한 선택은 아니었습니다. App 인스턴스가 늘어나면 읽기 요청과 커넥션 수 역시 함께 증가하는데, 그 모든 읽기 부하가 단일 DB에 계속 몰리면 지금은 괜찮아 보여도 다음 단계에서 다시 병목이 생길 수 있기 때문입니다.
커뮤니티 게시판은 구조적으로 읽기가 훨씬 많고, 쓰기는 상대적으로 적었습니다. 이런 서비스에서는 쓰기는 한곳에서 안정적으로 처리하고, 읽기는 별도 경로가 흡수하도록 나누는 편이 훨씬 자연스럽습니다. 또한 서비스 코드에는 이미 읽기 전용 트랜잭션과 일반 트랜잭션의 구분이 있었기 때문에, 이 구분을 기준으로 읽기와 쓰기를 자동으로 나누는 방식이 별도 프록시를 추가하는 것보다 단순하고 현재 규모에도 잘 맞았습니다.
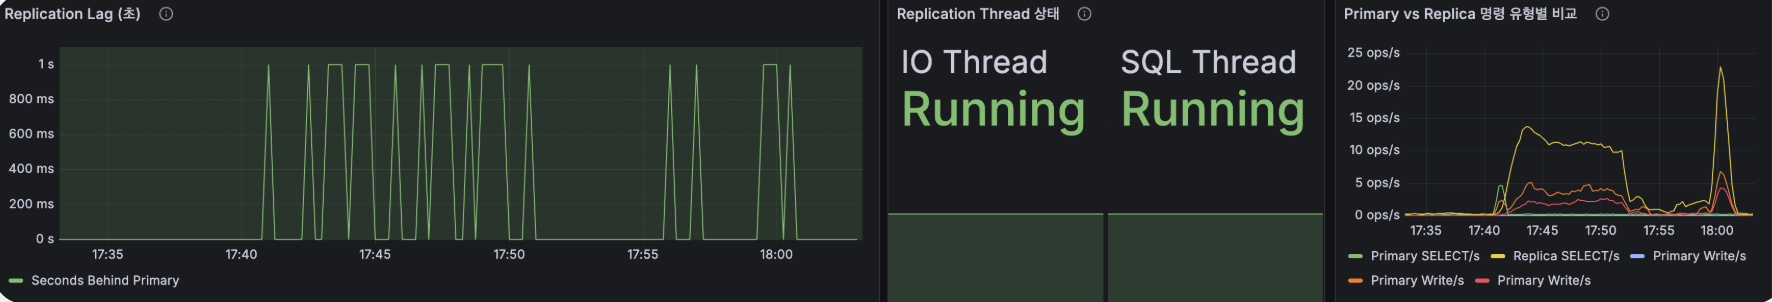
일관성 측면에서는 강한 동기화보다 서비스 특성에 맞는 최종 일관성을 허용하는 쪽을 택했습니다. 게시글 수정 직후 아주 짧은 시간 동안 이전 데이터가 보일 가능성은 있었지만, 커뮤니티 게시판 특성상 이 정도 지연이 사용자 경험을 크게 해치지 않는다고 판단했습니다. 실제 복제 지연도 0~1초 수준으로 유지됐습니다.
3-3. App 스케일아웃: CPU 병목을 실제로 분산한 과정
단일 서버 한계 테스트와 읽기/쓰기 분리 이후에도 남아 있던 병목은 여전히 App CPU였습니다. 쿼리 최적화, 캐시, 자동완성 품질 개선까지 적용한 뒤에도 100 VU 구간에서 App CPU가 100%에 가까워졌고, P95는 2,300ms, 에러율은 13.25%까지 올라갔습니다. 반면 MySQL은 버퍼 풀 히트율이 높았고 Slow Query도 거의 없었으며, Redis 역시 상대적으로 여유가 있었습니다. 즉, 이 시점의 문제는 DB나 캐시가 아니라 읽기 요청이 하나의 App 인스턴스에 집중되면서 검색과 조회 경로의 CPU 비용이 한곳에 몰린다는 점이었습니다.
여기서 중요한 것은 서버를 한 대 더 띄우는 것 자체가 아니라, CPU를 많이 쓰는 읽기 요청을 여러 인스턴스로 어떻게 나눌 것인가였습니다. 검색처럼 랭킹 계산이 많이 필요한 요청도 있었고, 캐시가 잘 맞아서 거의 즉시 끝나는 요청도 있었기 때문에, 단순한 순환 분배보다 현재 활성 연결이 적은 쪽으로 보내는 편이 더 안정적이라고 판단했습니다. 또한 쓰기 요청까지 양쪽 인스턴스에서 함께 처리하면 검색 인덱스 동기화 경로가 복잡해질 수 있었기 때문에, 이 단계에서는 읽기 요청은 두 App이 나눠 처리하고 쓰기 요청은 한쪽에 고정해 경로를 단순하게 유지했습니다.
또 하나의 현실적인 문제는 Lucene 인덱스 동기화였습니다. DB는 복제로 맞출 수 있었지만, Lucene 인덱스는 파일 기반이기 때문에 App을 2대로 늘리는 순간 두 인스턴스의 검색 결과를 어떻게 일치시킬 것인지가 새 과제가 됐습니다. 이 프로젝트에서는 더 무거운 검색 클러스터를 바로 붙이기보다, 한쪽에서만 인덱스를 갱신하고 다른 쪽은 이를 따라가는 Primary/Replica 패턴을 택했습니다.
이 전환의 결과, 읽기 부하가 여러 App으로 분산되면서 평균 응답시간은 482ms → 40.93ms, P95는 2,300ms → 175ms까지 크게 줄었습니다. 다만 이 과정에서 기존엔 가려져 있던 다른 구조 문제가 새롭게 드러났습니다. 상세 조회 GET 요청 안에 조회수 증가를 위한 DB UPDATE가 남아 있었고, 이 구조가 읽기 전용 경로와 충돌하면서 에러율 11.10%가 발생했습니다.
3-4. 조회수 경로 재설계: 읽기 요청 안의 쓰기를 없애다
App을 2대로 늘린 뒤에는 “읽기 요청은 읽기 경로로 간다”는 가정과 달리, GET 요청 내부에서 조회수를 증가시키기 위해 DB UPDATE가 실행되고 있다는 점이 더 분명하게 드러났습니다. 단일 서버에서는 크게 눈에 띄지 않던 구조였지만, 읽기/쓰기 분리를 도입한 뒤에는 이 구조가 즉시 충돌로 나타났습니다. 읽기 요청이 읽기 전용 경로를 타고 들어왔는데 내부에서 다시 쓰기를 시도하다 보니 에러가 발생했고, 실제로 상세 조회 시나리오에서 500 에러가 집중적으로 나타났습니다.
그래서 이 단계에서는 조회수 증가를 읽기 경로 밖으로 옮겼습니다. 요청 시점에는 공유 카운터에 원자적으로 누적만 하고, 실제 DB 반영은 짧은 주기의 배치로 모아서 처리하는 구조로 바꿨습니다. 그 결과 GET 요청에서 DB 쓰기가 완전히 제거됐고, 에러율은 11.10% → 0.00%로 해소됐습니다. 동시에 평균 응답시간은 40.93ms → 37.23ms, P95는 175ms → 158ms로 추가 개선됐습니다.
3-5. 변경 전파 구조 재설계: dual-write를 걷어내고 correctness를 확보한 과정
분산 구조가 어느 정도 자리를 잡아가면서 다음으로 보였던 문제는, 데이터 저장과 검색 반영을 서비스 코드 안에서 직접 함께 처리하는 구조였습니다. 게시글을 저장한 뒤 검색 인덱스를 바로 갱신하고, 관련 캐시까지 직접 무효화하는 방식은 처음에는 이해하기 쉽지만, 쓰기 지연이 커지고 한쪽만 성공하는 partial failure가 생기면 데이터 정합성이 흔들릴 수 있습니다.
그래서 이 단계에서도 처음부터 가장 무거운 인프라를 붙이기보다, 더 가벼운 선택부터 적용해 실제로 무엇이 해결되고 무엇이 남는지를 보는 순서로 접근했습니다. 먼저 애플리케이션 내부 비동기 이벤트로 전환해 서비스 코드의 결합을 줄이고, 사용자 응답 경로에서 검색 인덱싱과 캐시 무효화를 분리했습니다. 이 전환만으로도 게시글 생성 지연은 5,315ms → 33ms로 줄었고, 사용자 응답은 훨씬 가벼워졌습니다.
하지만 운영 관점에서 보면 한계는 분명했습니다. 애플리케이션을 통하지 않는 DB 변경은 잡을 수 없었고, 멀티 인스턴스 환경에서는 변경 이력을 공통 기준으로 따라가거나 다시 재생하는 것이 어려웠습니다. 실제로 인덱싱 실패가 발생하면 DB에는 저장됐지만 검색 인덱스에는 반영되지 않는 불일치가 생길 수 있었고, 당시 구조에서는 이를 다시 따라가며 복구할 기준이 부족했습니다.
그래서 최종적으로는 DB에 실제로 기록된 변경 사실을 기준으로, 검색 인덱스와 캐시가 이를 각자 독립적으로 소비하는 구조로 옮겼습니다. 여기서 Kafka와 CDC를 선택한 이유는 처리량 때문이 아니라 correctness와 replay 가능성 때문이었습니다. 비동기는 지금 응답을 가볍게 만드는 방법이지만, 재생 가능한 로그는 문제가 생겼을 때 어디까지 되돌아가 복구할 수 있는가를 결정하는 기준점입니다. 최종 구조에서 쓰기 평균은 24ms 수준으로 유지됐고, 더 중요했던 것은 dual-write를 서비스 코드에서 걷어내고 변경 이력을 다시 읽어 재반영할 기준점을 확보했다는 점이었습니다.
3-6. Redis 워크로드 분리: 성능 개선보다 간섭 제거와 영향 범위 축소
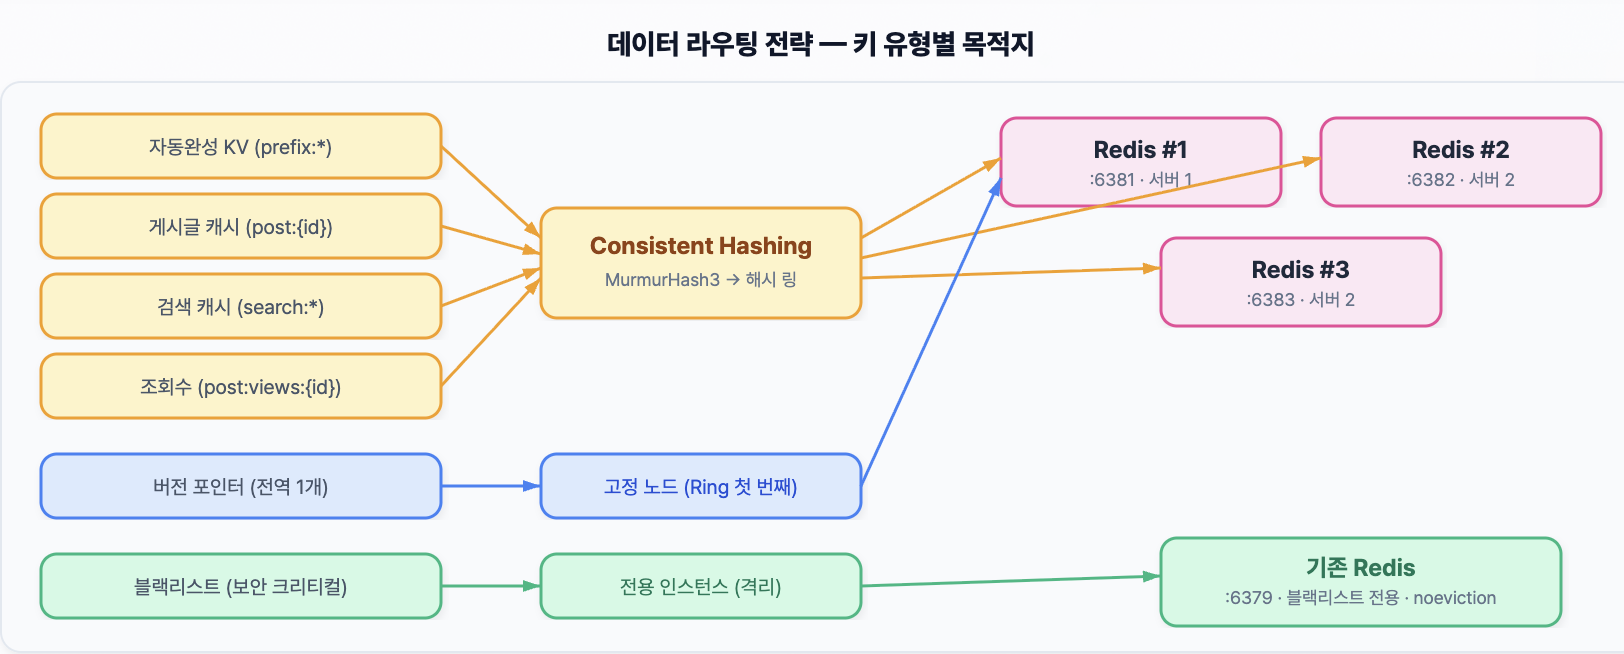
마지막으로 다룬 문제는 Redis를 쓰고 있다는 사실 자체가 아니라, 서로 성격이 전혀 다른 작업들이 하나의 Redis 인스턴스 안에서 함께 돌고 있다는 점이었습니다. 당시 한 인스턴스 안에는 자동완성 추천 결과, 일반 캐시, 조회수 카운터, 토큰 블랙리스트가 함께 들어 있었습니다. 자동완성은 주기적 대량 갱신이 일어났고, 일반 캐시는 TTL 기반으로 흐르며, 조회수는 짧은 주기의 고빈도 증가 연산이 중심이었고, 블랙리스트는 보안상 유실되면 안 되는 데이터였습니다.
실제로도 간섭이 관측됐습니다. 조회수 배치를 처리하는 과정에서 전체 키를 한 번에 훑는 명령이 실행되면서 Redis 내부에 수십 ms 수준의 블로킹이 기록됐고, 그 순간 실시간 GET과 INCR도 함께 대기했습니다. 자동완성 추천 결과를 대량으로 다시 쓰는 시간대에는 평소에는 빠르게 끝나던 일반 조회 요청도 비정상적으로 느려지는 스파이크가 나타났습니다. 그래서 먼저 전체 스캔 안티패턴을 제거하고, 이후 자동완성·일반 캐시·블랙리스트처럼 성격이 다른 데이터를 분리했습니다.
이 과정에서 더 중요했던 것은 단순한 레이턴시가 아니라, 한 종류의 문제가 다른 기능까지 얼마나 넓게 번질 수 있느냐였습니다. 일반 캐시와 자동완성 데이터는 일부 유실되더라도 다시 만들 수 있지만, 토큰 블랙리스트는 보안상 잘못 다루면 바로 문제가 됩니다. 그래서 이 단계의 핵심은 Redis를 더 빠르게 만들었다기보다, Redis 안에서 서로 달라야 하는 것들을 구분해 운영 가능한 구조로 나눴다는 데 있었습니다. 그 결과 flush 시점에 기록되던 34.6ms SLOWLOG 블로킹은 사라졌고, 배치 작업과 실시간 요청이 서로 끌어내리던 현상도 크게 줄었습니다.
3-7. 검증 결과: 분산 구조가 실제로 버티는가
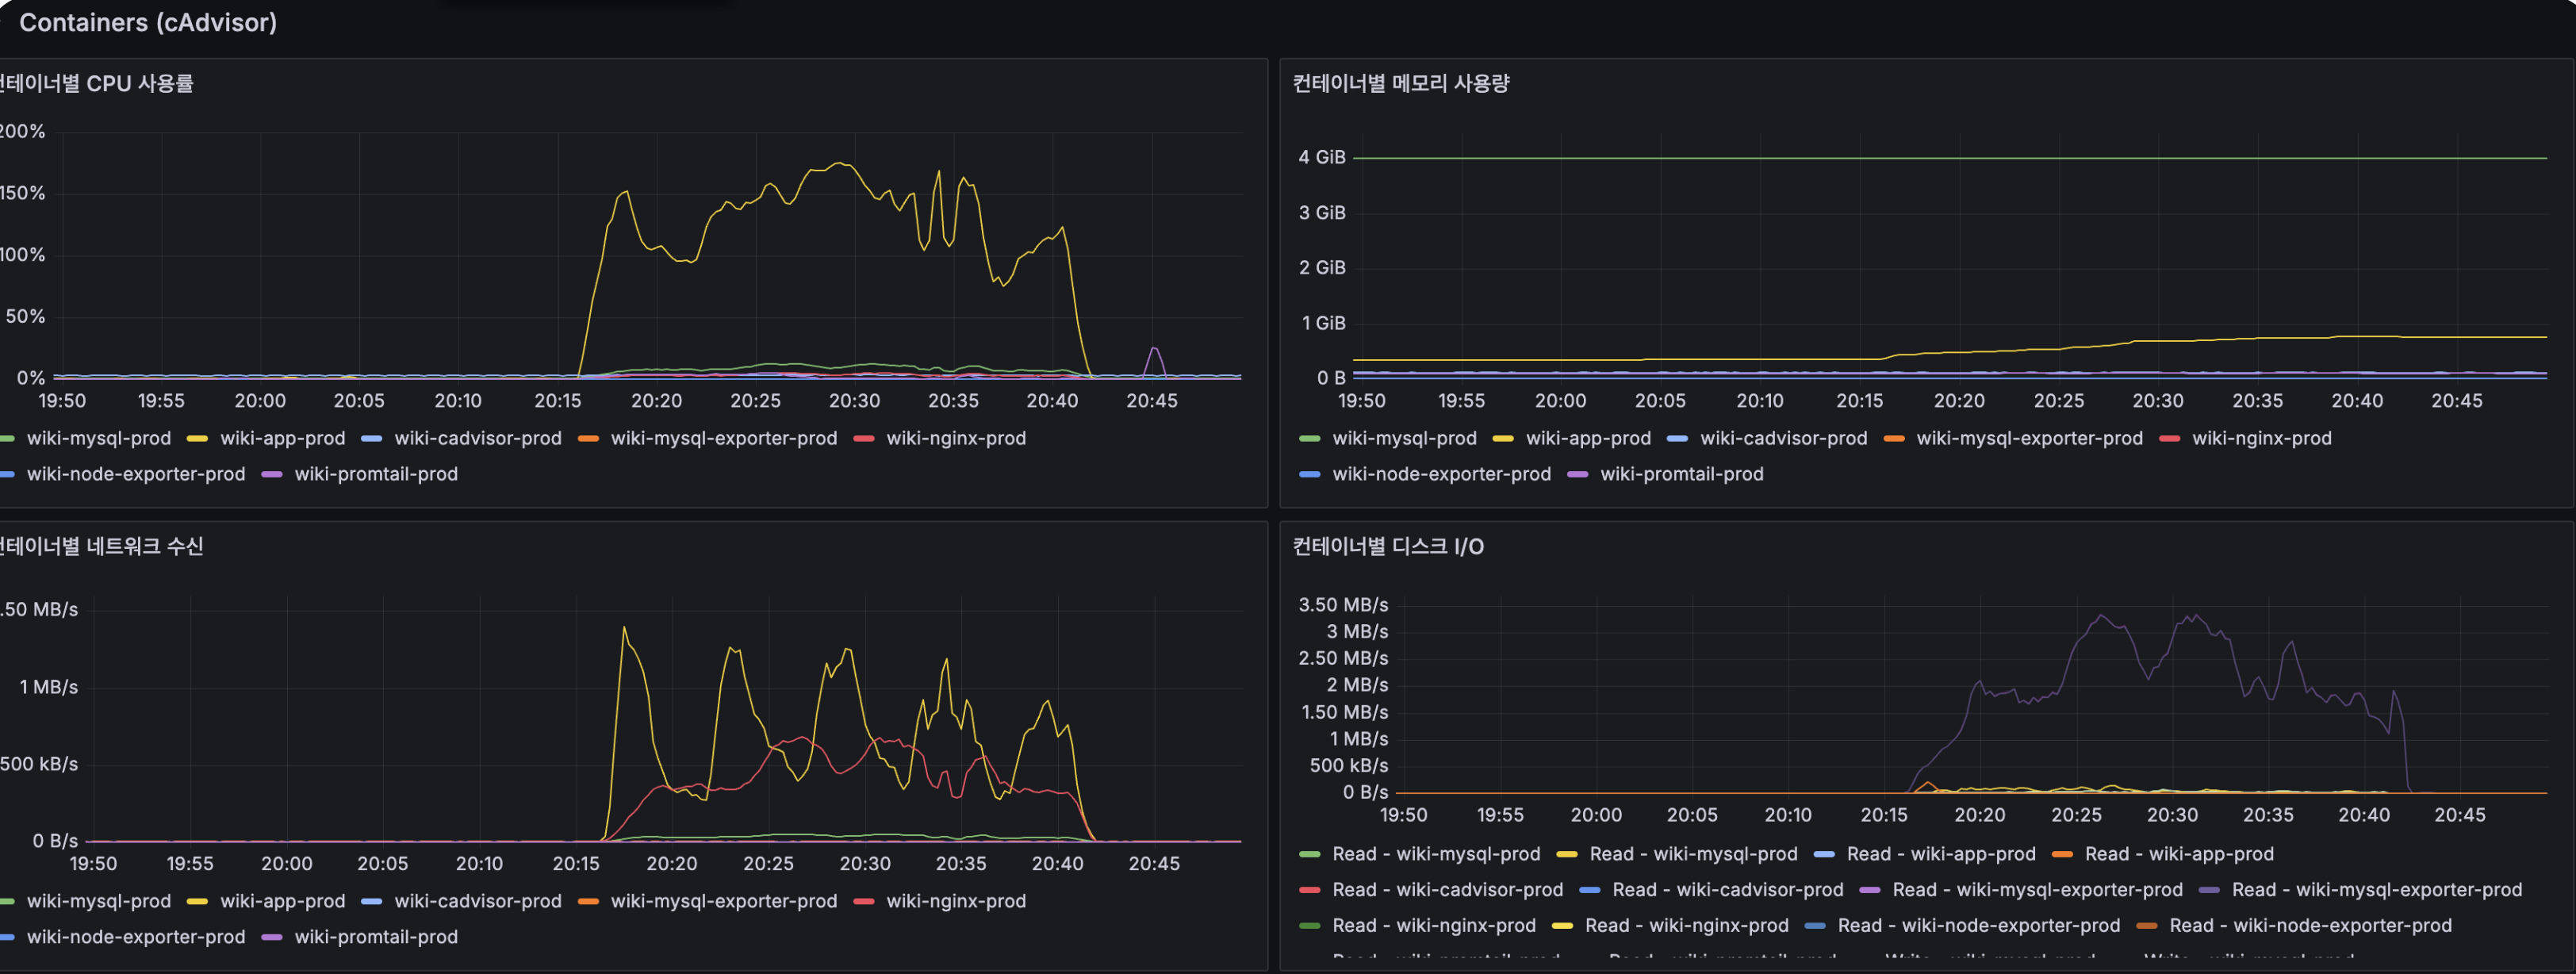
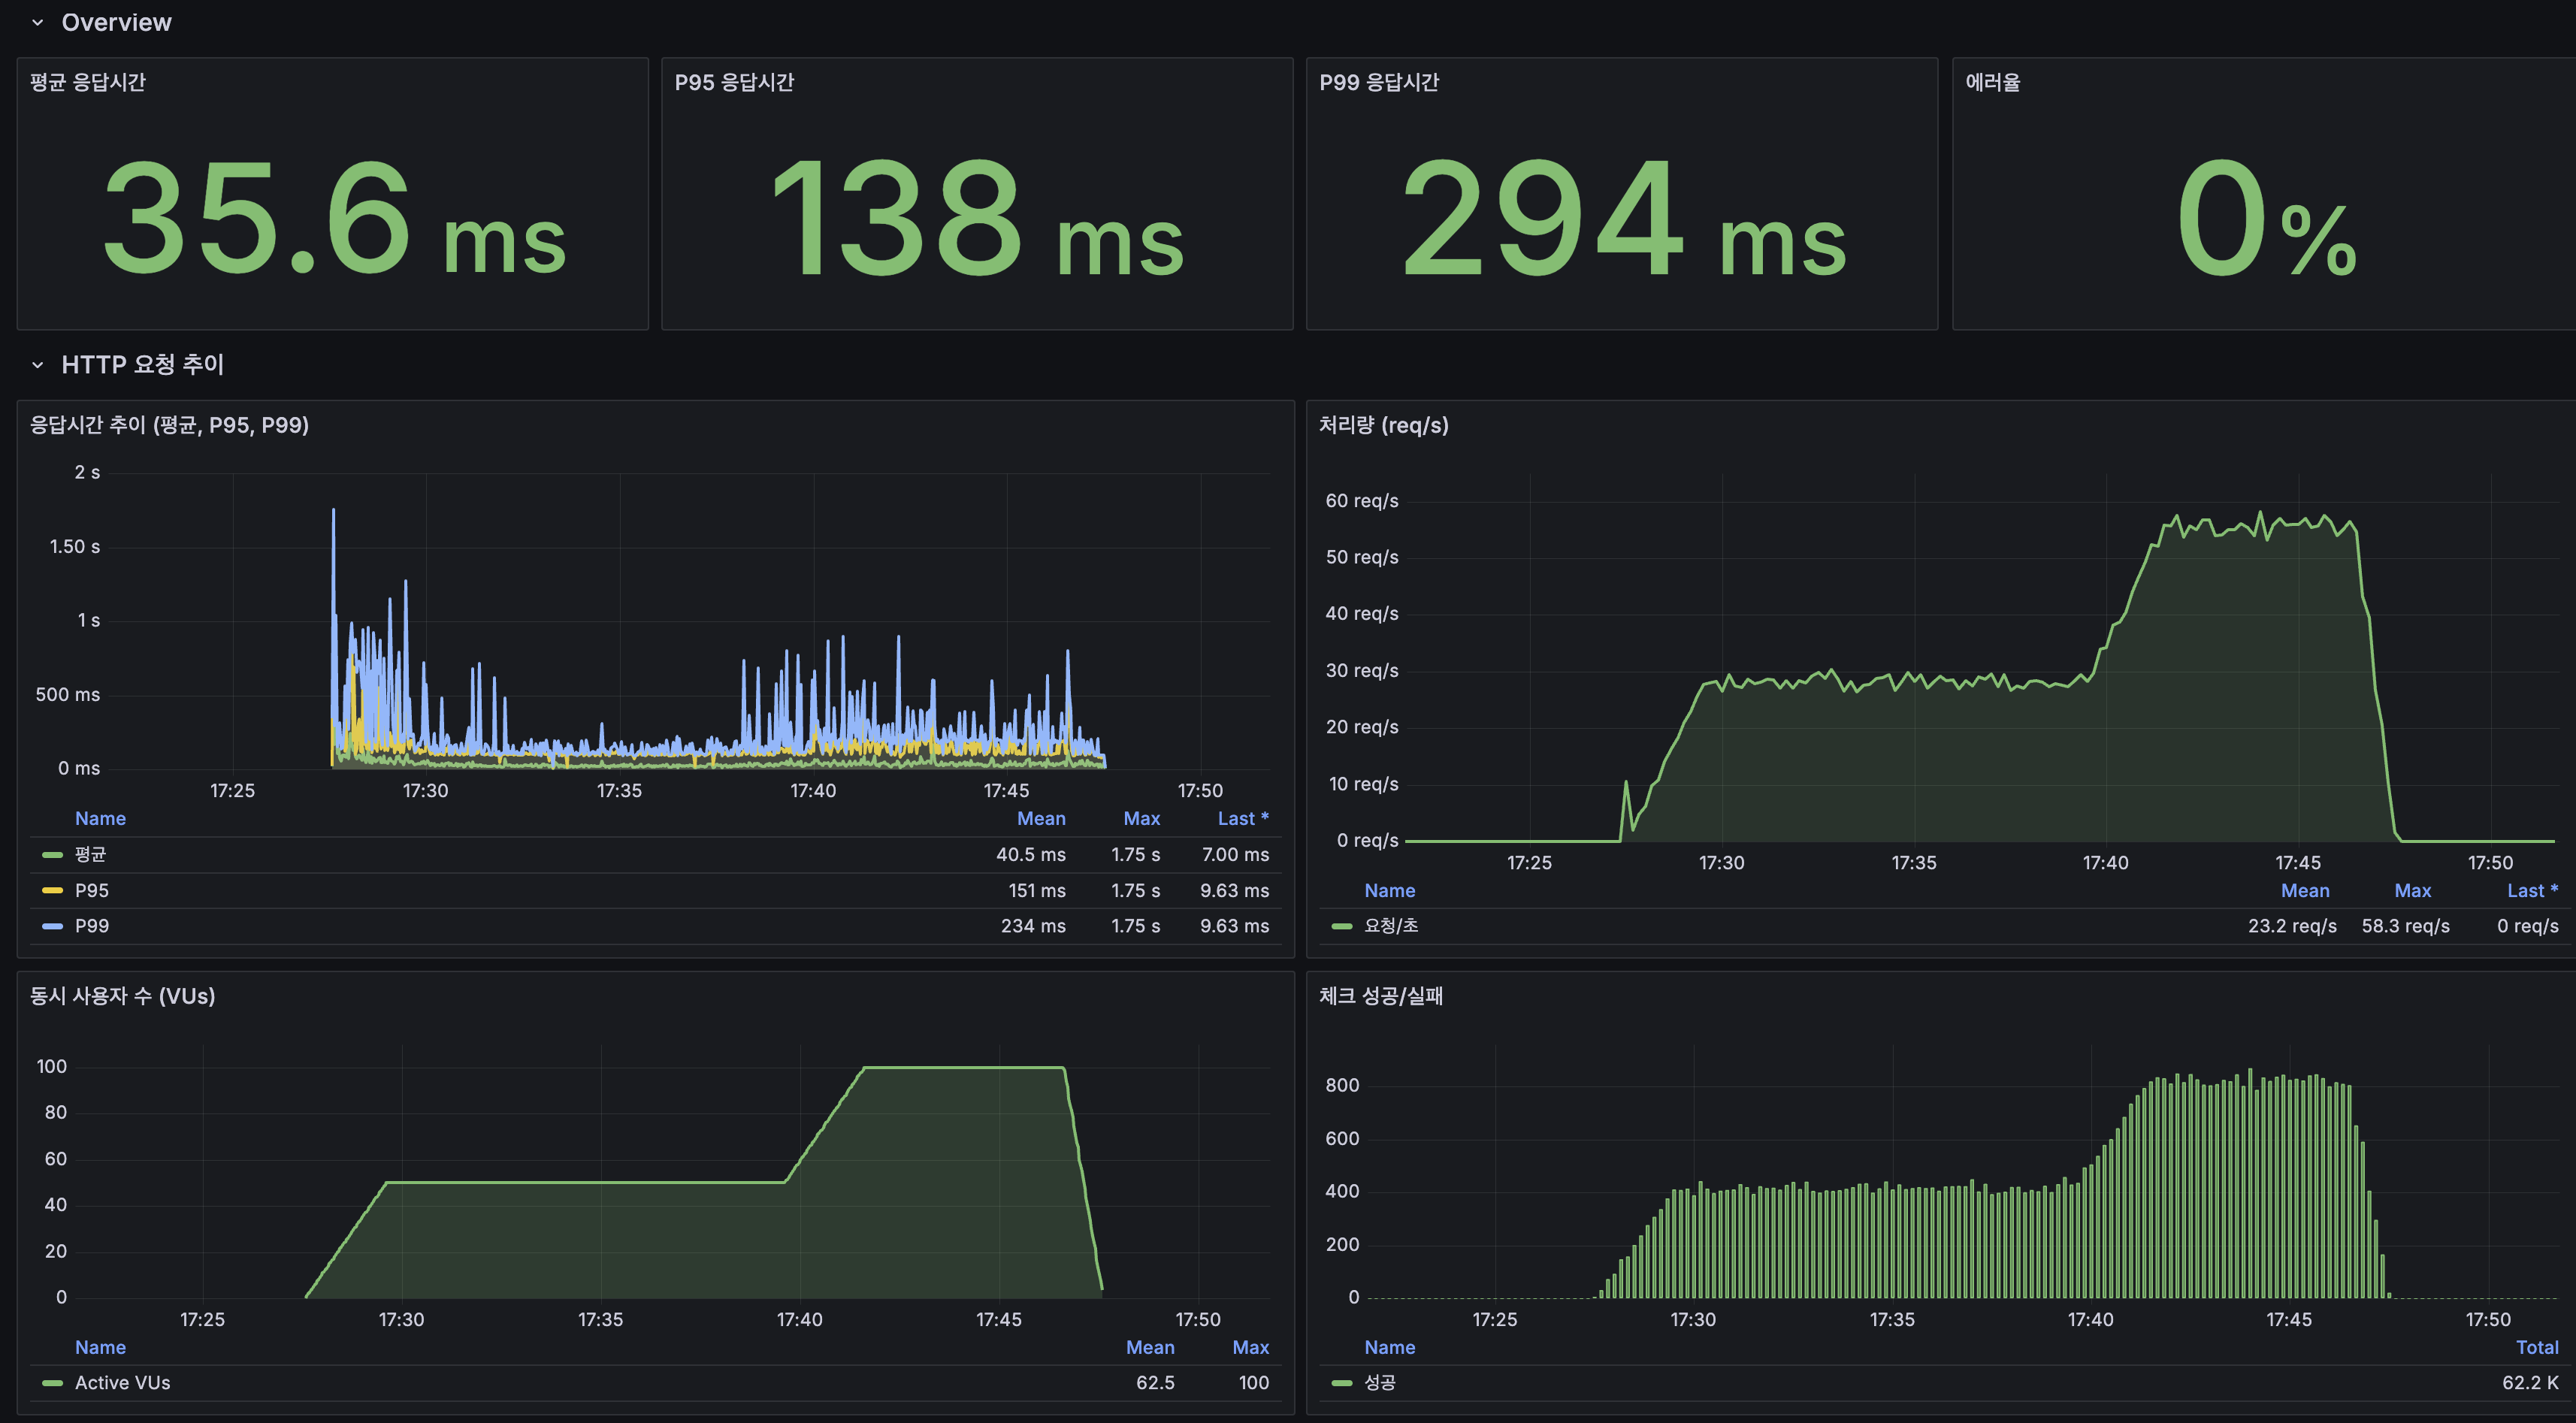
분산 아키텍처(2 App + MySQL Replication + Redis 3샤드 + Kafka CDC) 전환 후 200 VU stress 테스트를 다시 수행했습니다. 그 결과 에러율은 13.25% → 0.09%, 처리량은 30 req/s → 109 req/s, P95는 2,300ms → 190ms로 개선됐습니다. 100 VU 구간에서는 P95가 약 200ms 수준으로 SLA 300ms를 충족했습니다.
관측 지표를 보면 MySQL(InnoDB 버퍼 풀 히트율 100%, Row Lock 0), Redis(OPS 정상), Kafka(Consumer Lag 0~3K에서 0 수렴, CDC Lag 피크 40ms), Nginx(Active Connection 200+)는 모두 여유가 있었고, App CPU만이 여전히 80~100%로 근본 병목임을 소거법으로 확인할 수 있었습니다. 즉, 분산 구조는 DB·캐시·변경 전파의 병목을 충분히 분리했고, 이제 남아 있는 과제는 App CPU를 더 어떻게 줄일 것인가였습니다.
관련 글: 부하 테스트 튜닝, Redis L2 캐시, MySQL Replication, App 스케일아웃, 조회수 Redis INCR, CDC 이벤트 기반 동기화, Redis 샤딩, 분산 안정성 검증
4. 검색 품질: 더 맞게 찾게 하는 방향으로 고도화한 단계
4-1. 동의어 확장 + 오타 교정 + snippet 개선
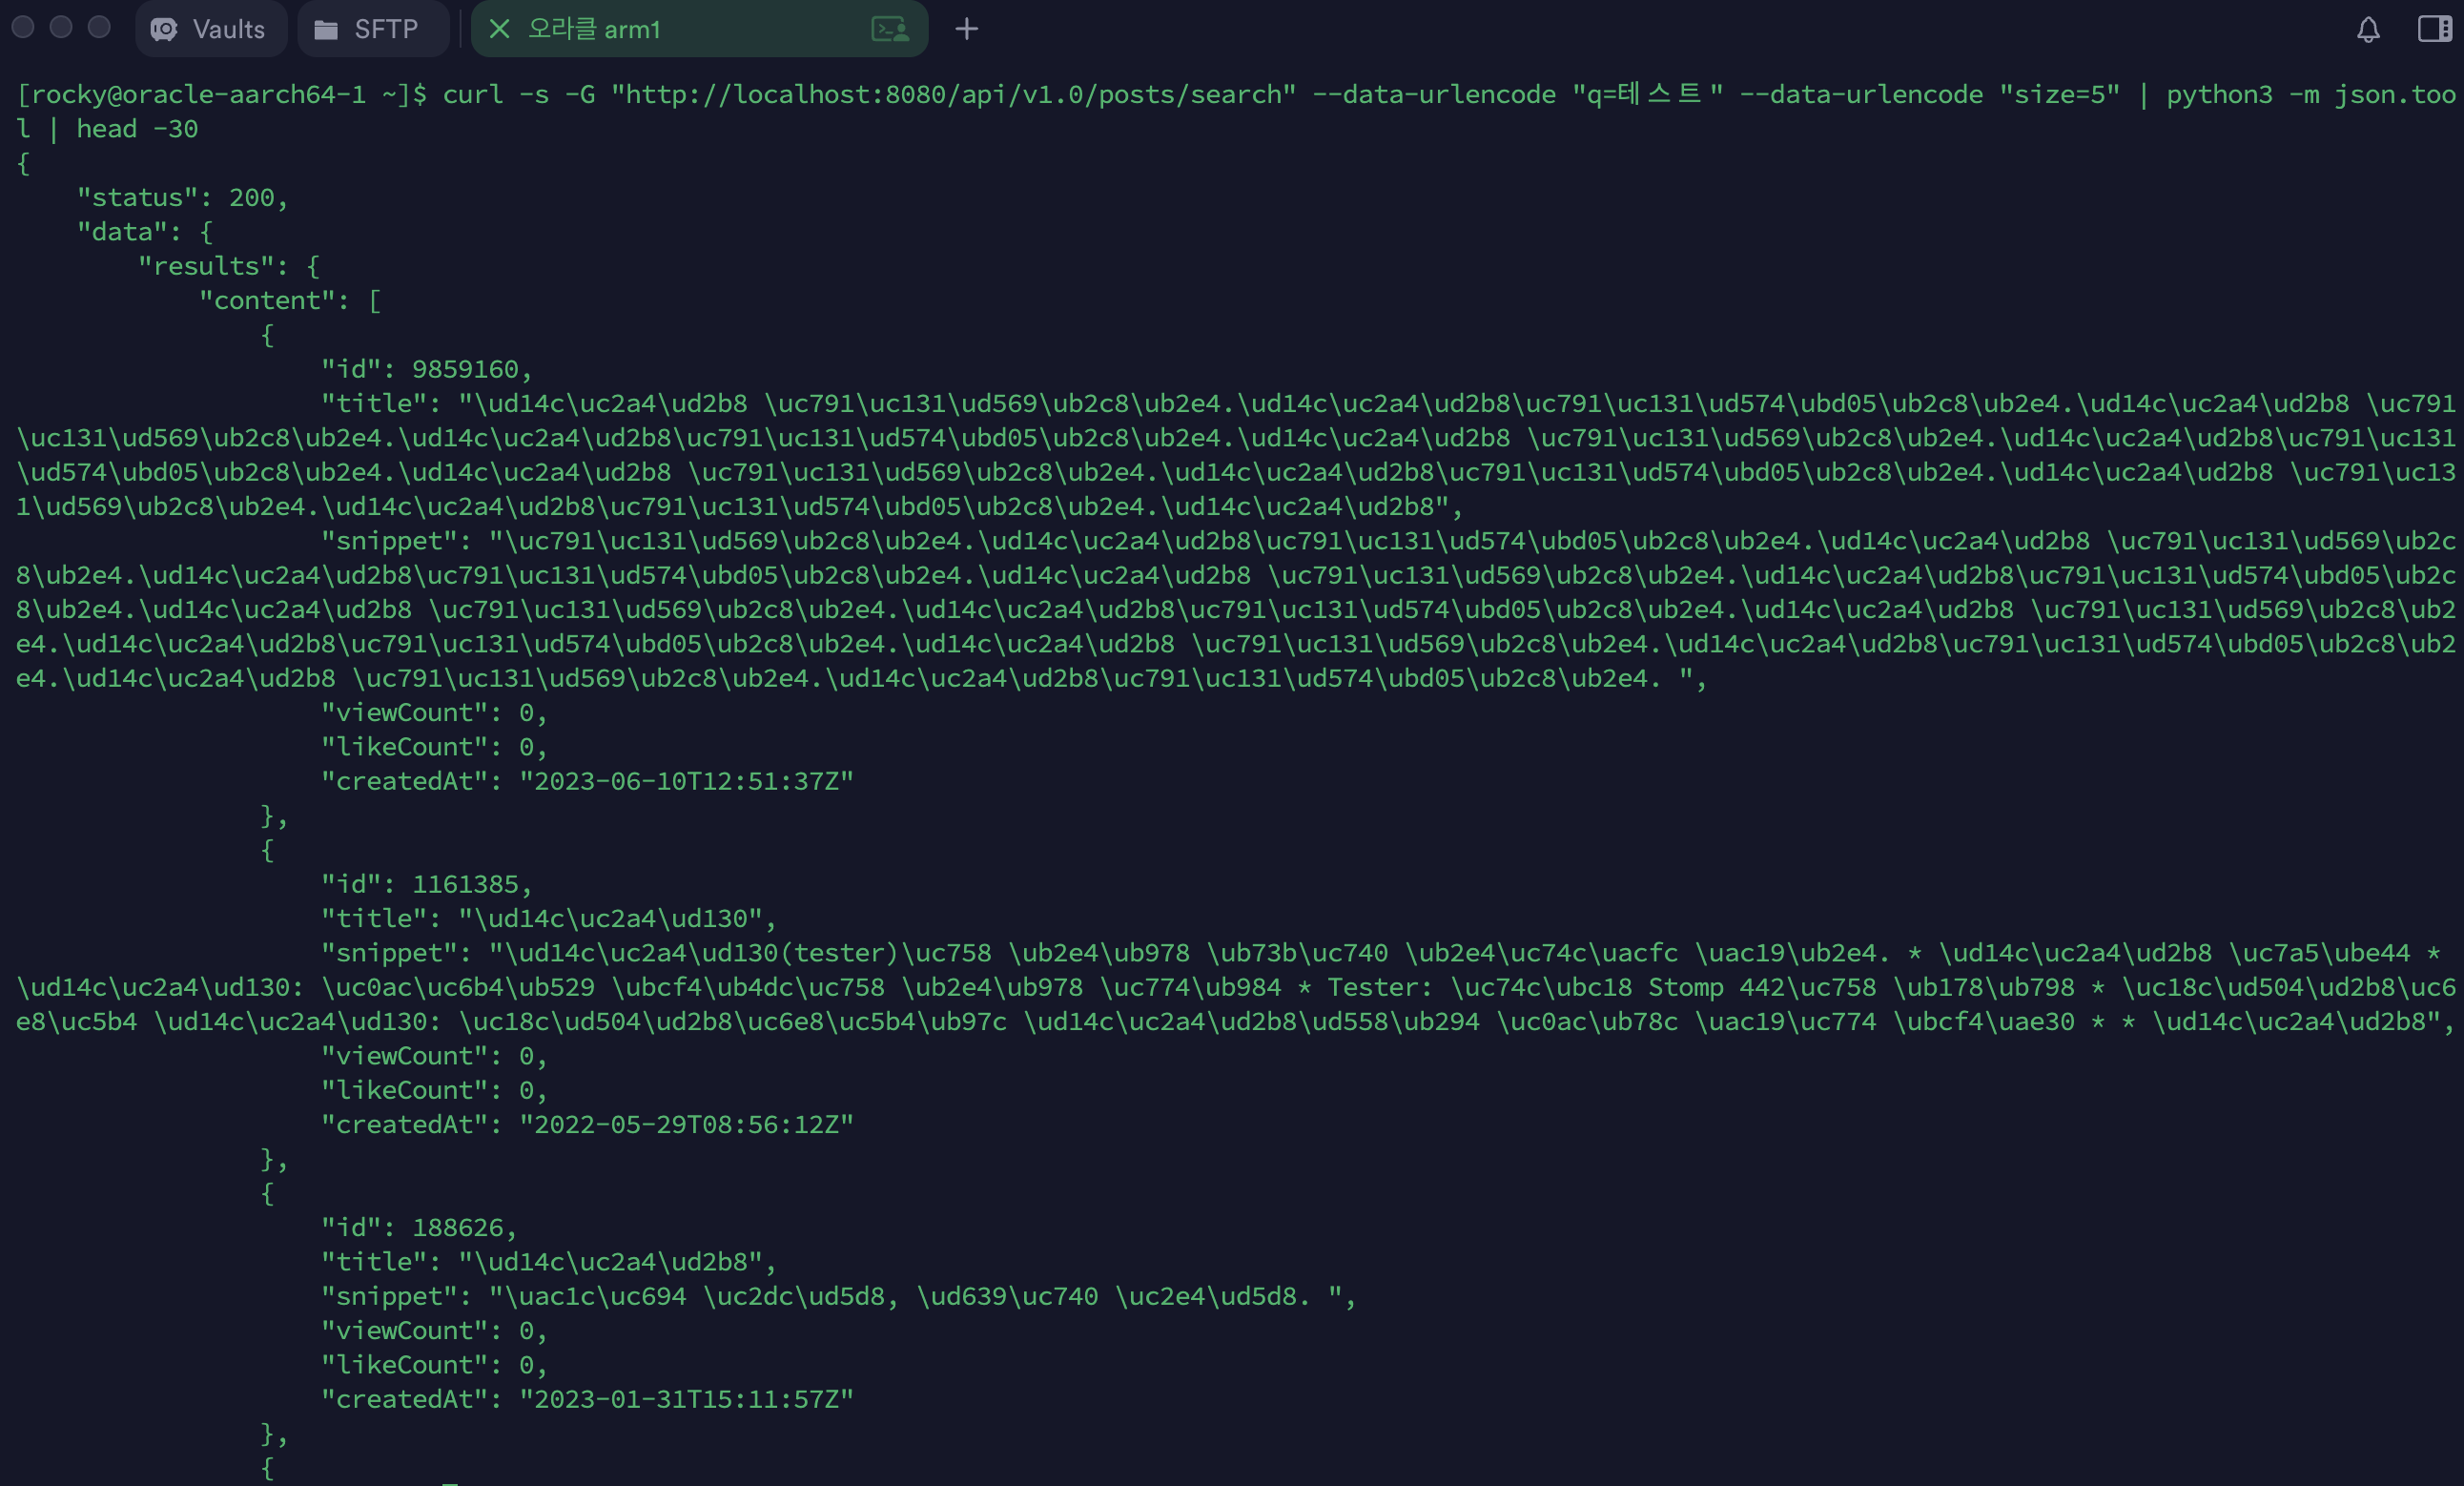
이 단계의 대상은 GET /posts/search?q= 검색 API였습니다. 당시 검색 엔진은 1,215만 건 규모 문서를 Lucene BM25로 조회하고 있었고, 제목과 본문에 서로 다른 가중치를 주는 기본 랭킹까지는 적용된 상태였습니다. 응답속도 자체는 이미 충분히 개선되어 있었지만, 실제 사용 관점에서 보면 검색 품질에는 세 가지 한계가 남아 있었습니다.
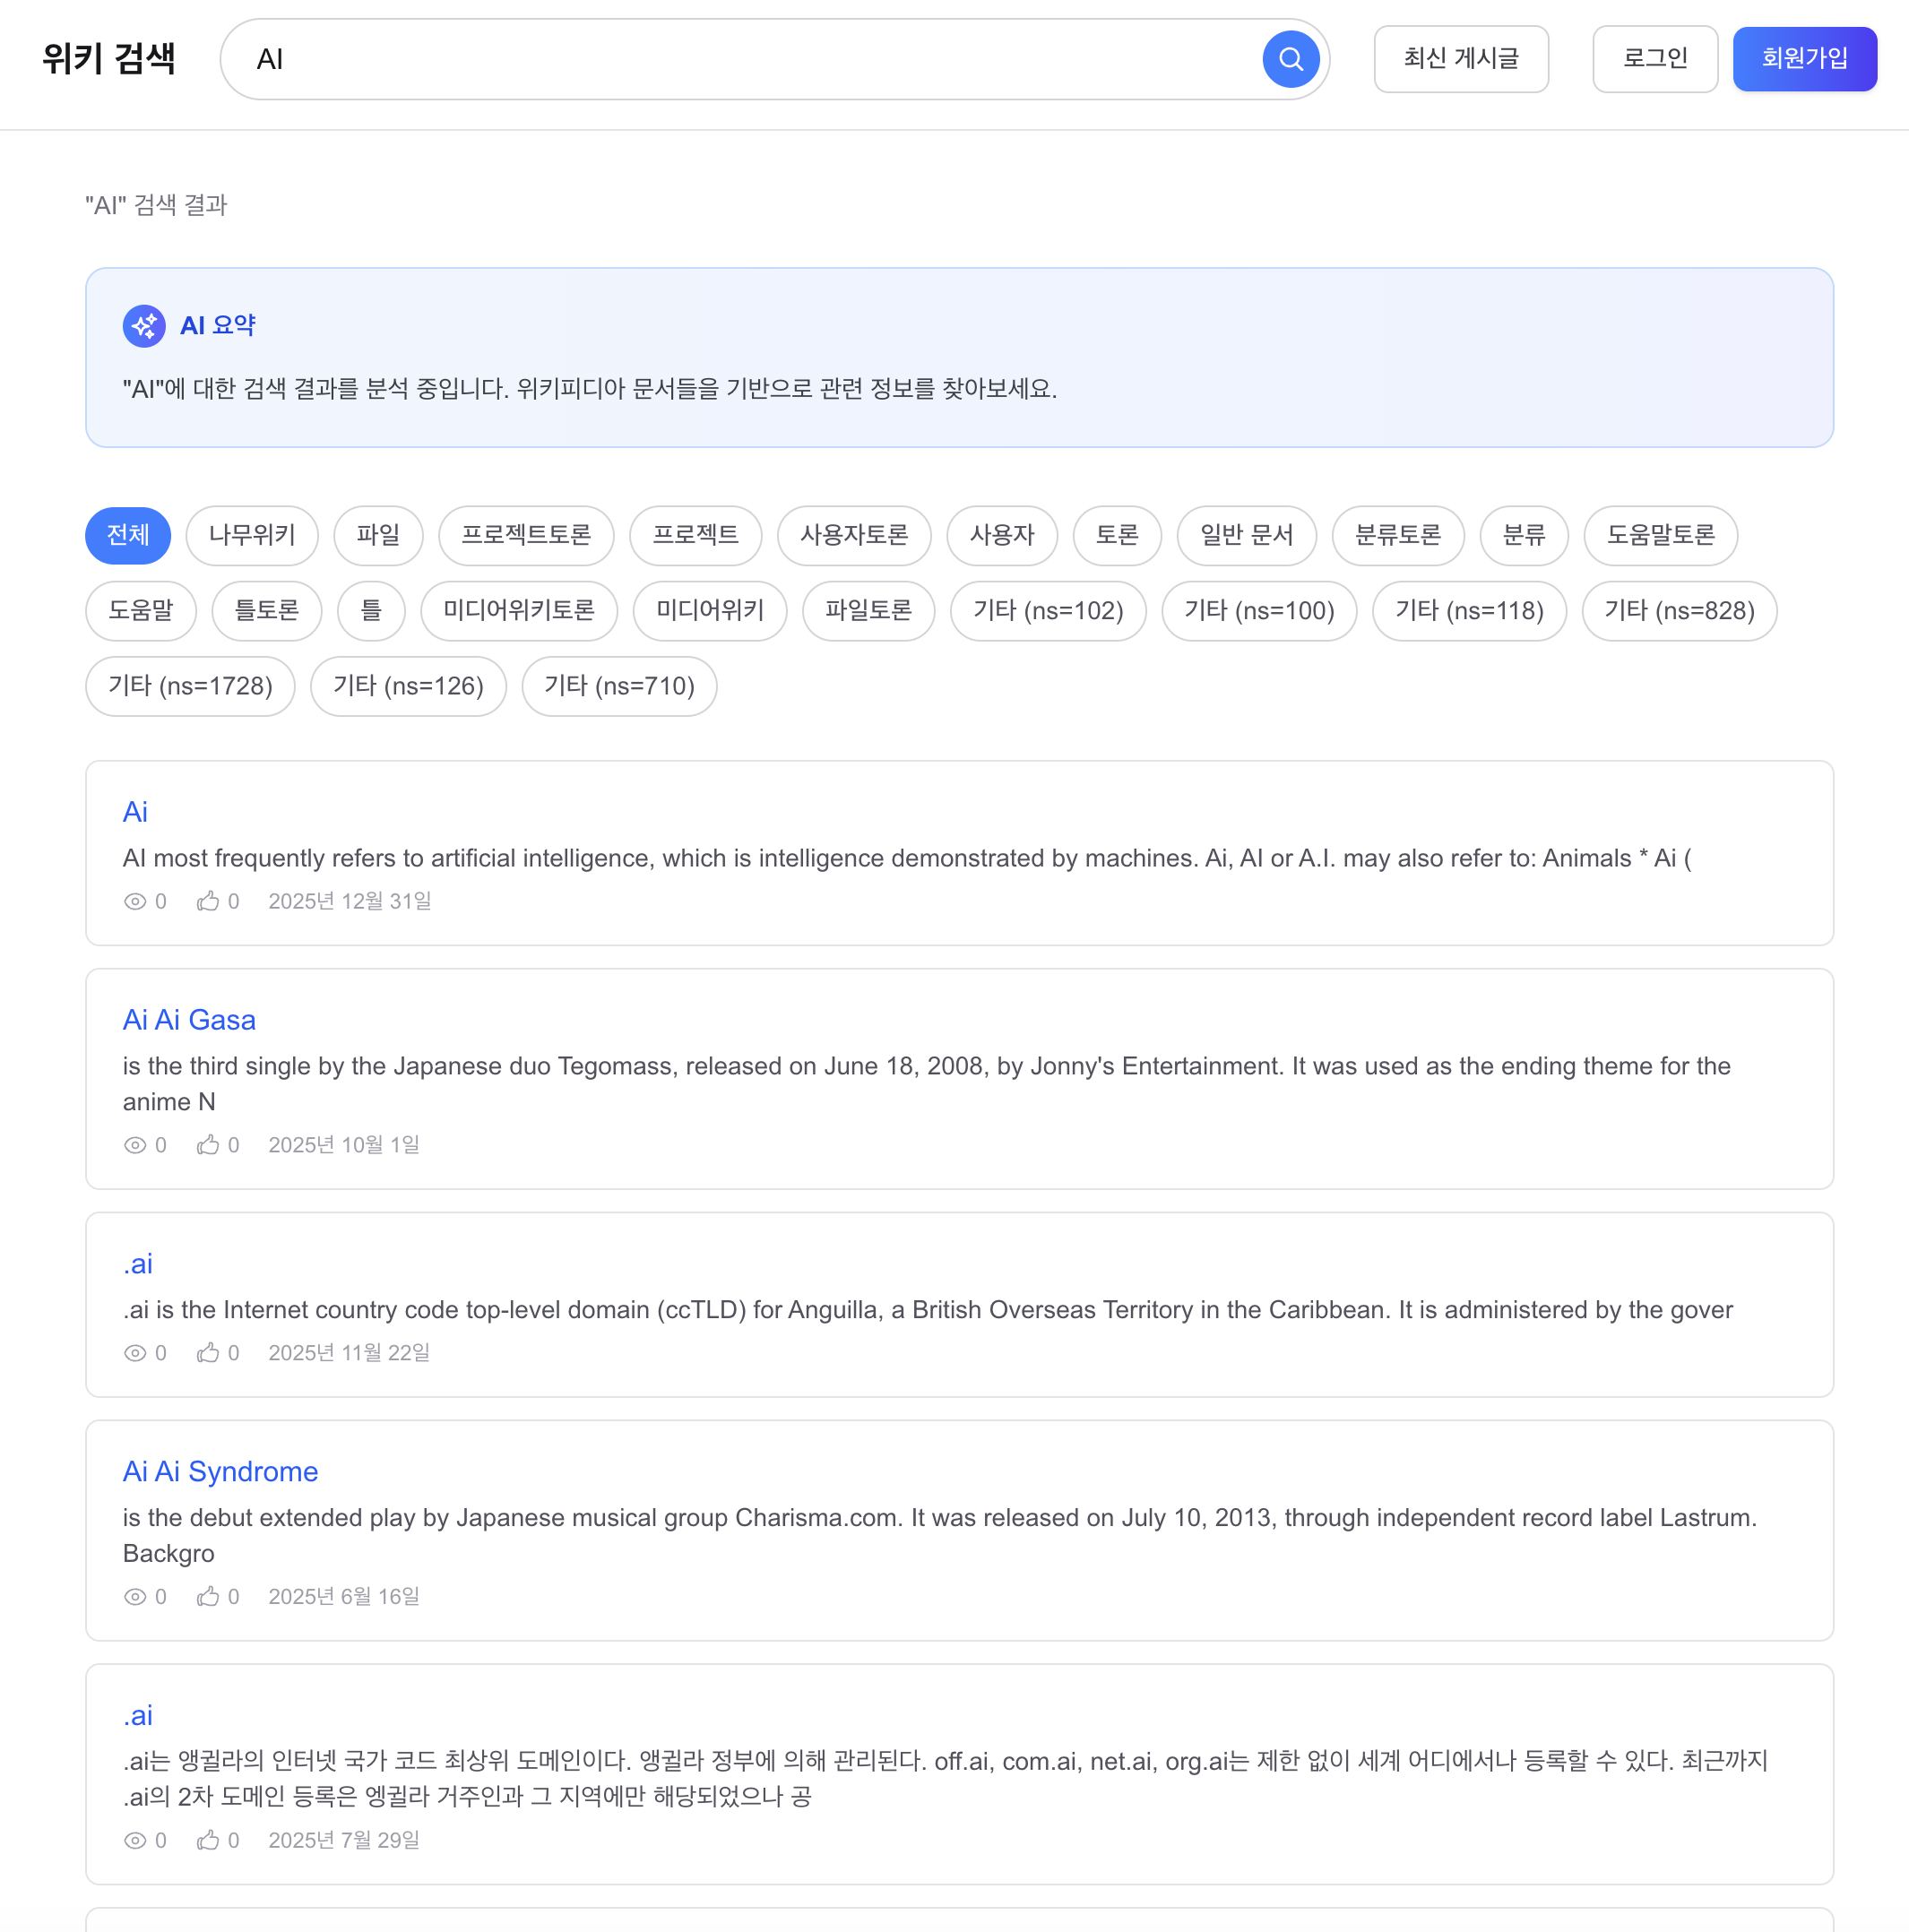
첫째, 동의어를 이해하지 못했습니다. AI, 인공지능, DB, 데이터베이스처럼 사람이 보기엔 같은 의미여도 인덱스에는 서로 다른 term으로 남습니다. 둘째, 오타에 취약했습니다. 프로그래링처럼 흔히 입력할 수 있는 오타도 그대로 검색 실패나 무관 결과로 이어졌습니다. 셋째, snippet 품질이 낮았습니다. 문서 앞 150자를 잘라 보여주는 방식에서는 검색어가 문서 중간 이후에 등장하면 “왜 이 문서가 나왔는지”를 설명하지 못했습니다.
동의어 처리에서는 네 가지를 비교했습니다. 인덱스 타임 동의어는 IDF 왜곡과 재색인 비용 때문에 제외했습니다. 파일 기반 SynonymGraphFilter는 장기적으로 자연스럽지만 운영 중 즉시 반영이 어렵다는 점이 부담이었습니다. 벡터 임베딩 기반 의미 확장은 AI ↔ 인공지능 같은 비교적 명확한 동의어 수준을 해결하기엔 복잡도와 추론 비용이 과하다고 봤습니다. 그래서 이 단계에서는 DB 기반 쿼리 타임 동의어 확장을 먼저 선택했습니다.
오타 교정에서는 DirectSpellChecker, 검색 로그 기반 “Did you mean?”, SymSpell을 비교했습니다. 검색 로그 기반 방식은 정확도가 높지만 초기에 로그가 부족했고, SymSpell은 빠르지만 별도 사전 운영이 필요했습니다. 반면 DirectSpellChecker는 인덱스가 곧 사전이므로 지금 단계에서 별도 인프라 없이 바로 붙이기 좋았습니다. snippet 개선에서는 본문 전체 저장과 500자 부분 저장을 비교한 끝에, 검색어 주변 맥락을 보여줄 수 있을 만큼만 저장하고 전체 저장은 피하는 절충안을 택했습니다.
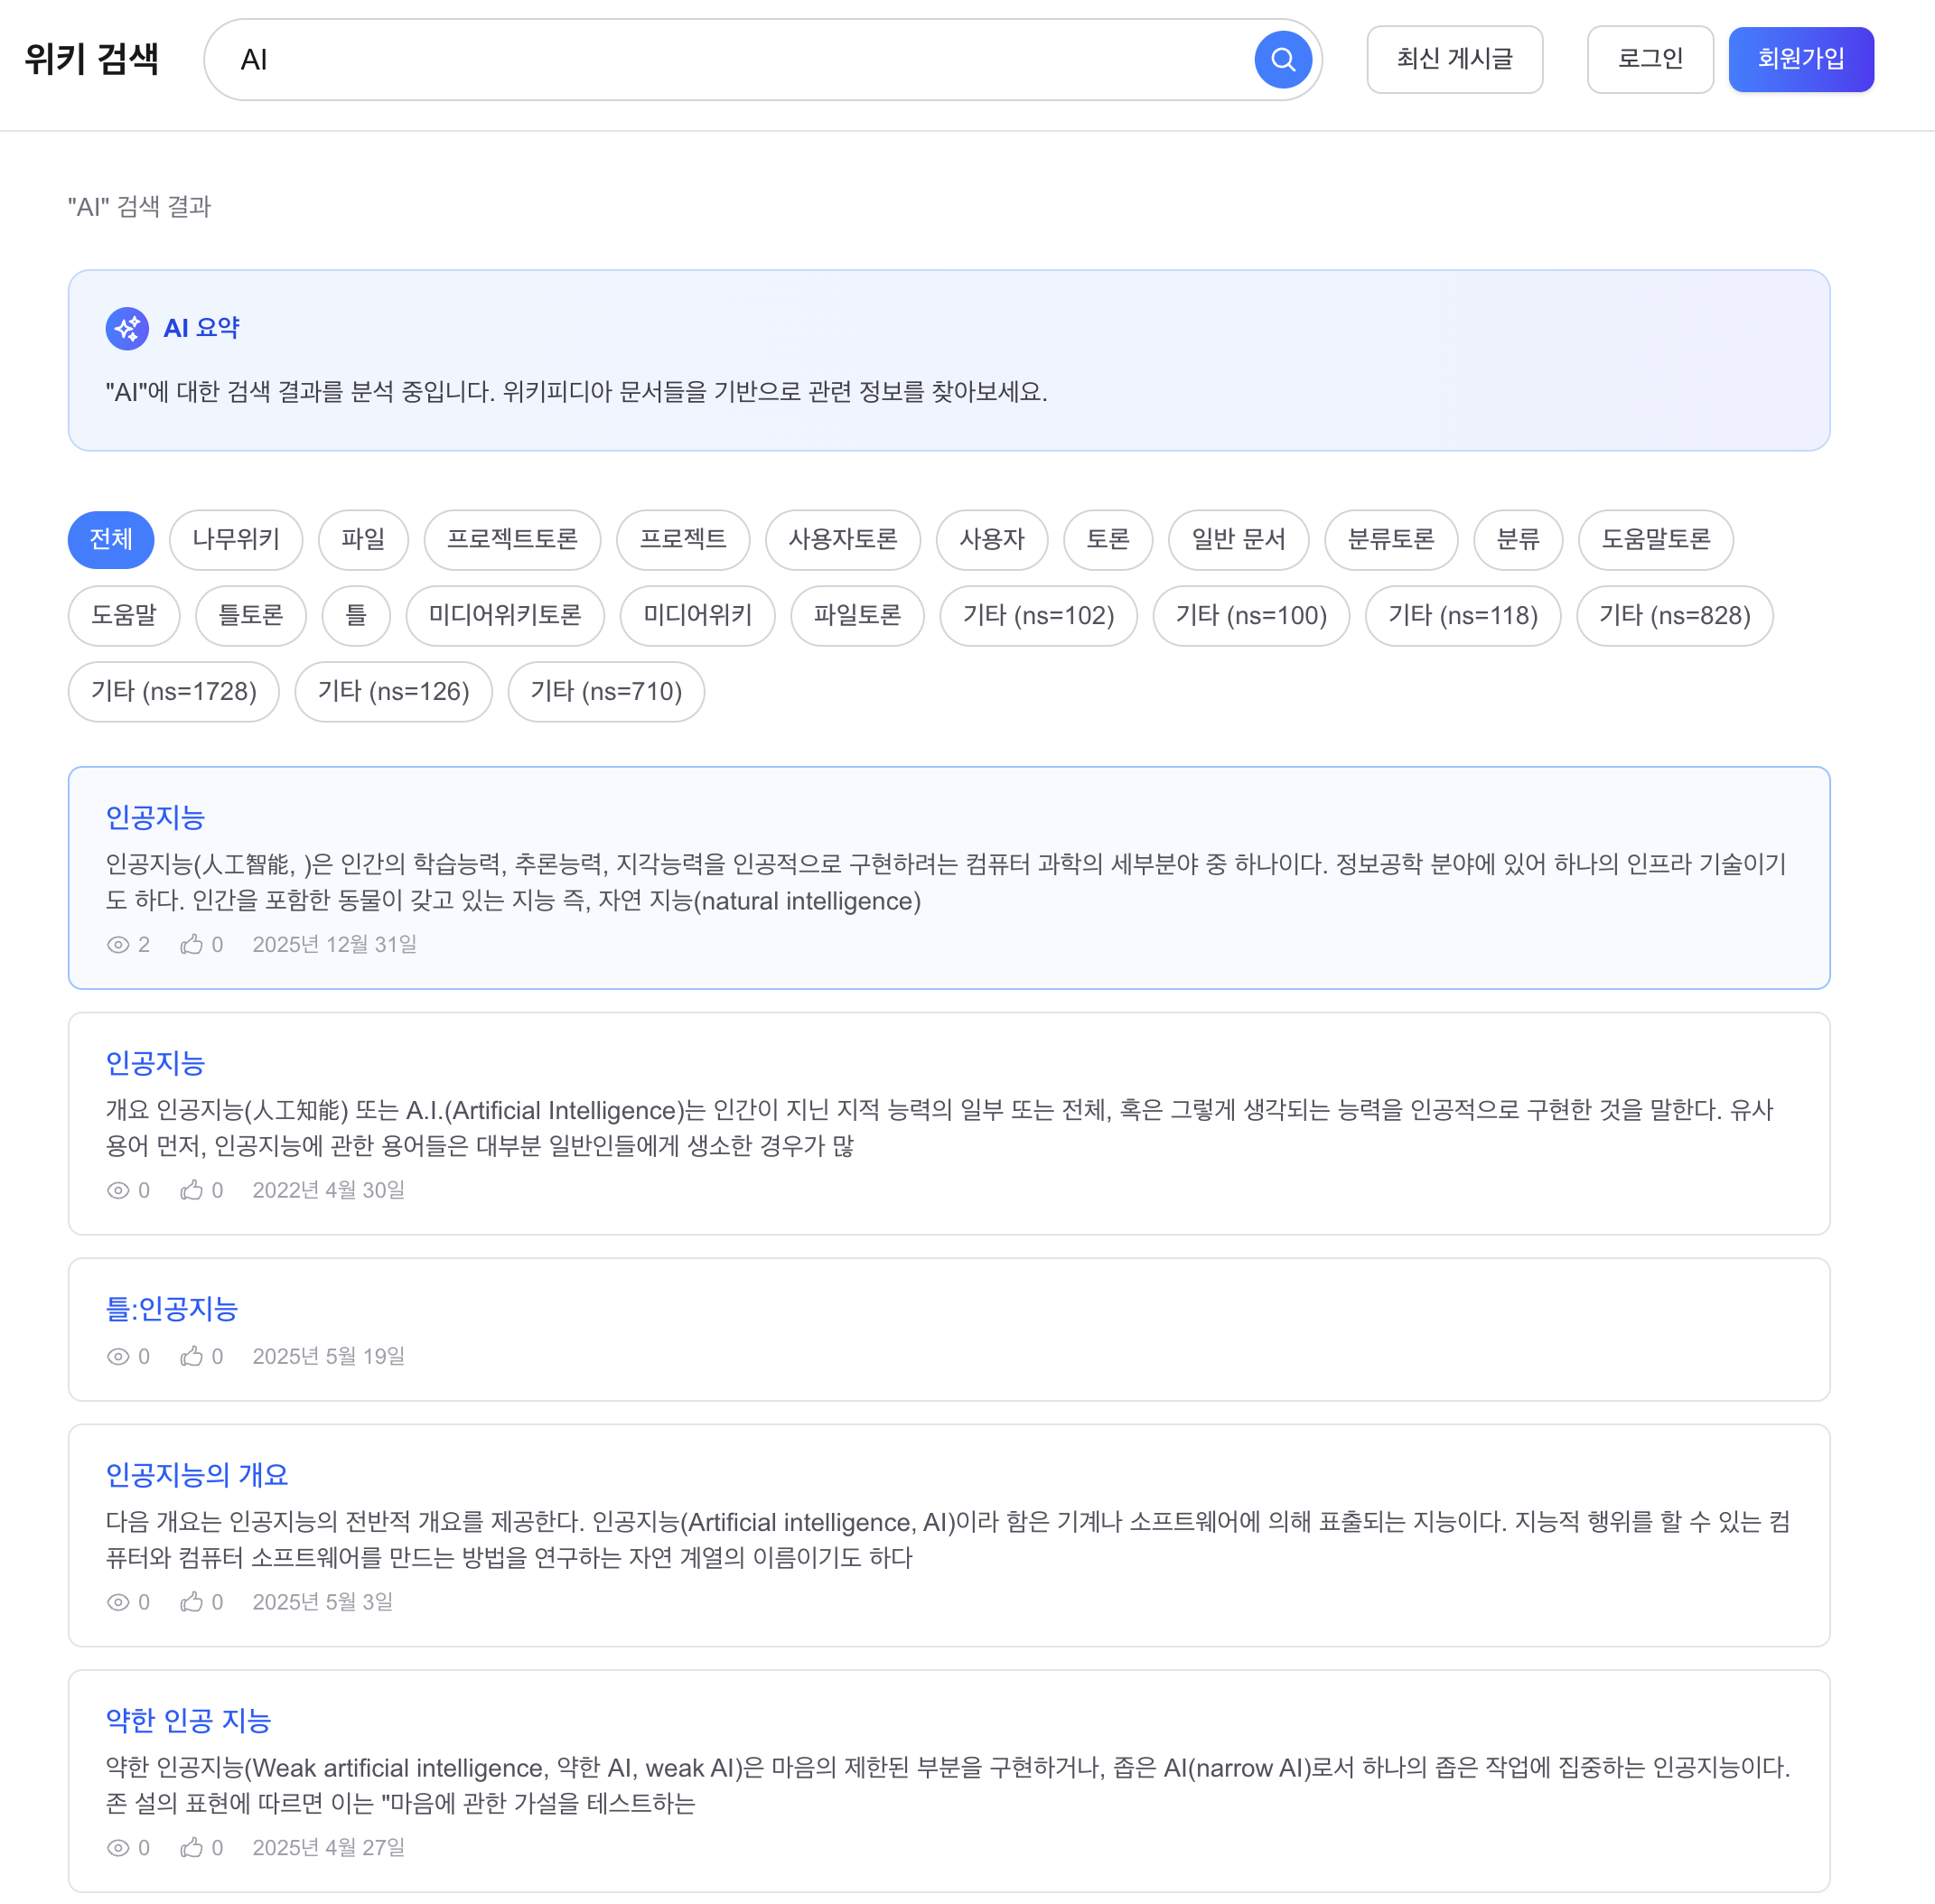
그 결과 AI 검색 시 인공지능 관련 문서가 상위에 노출되도록 바꿨고, 프로그래링 같은 오타에도 혹시 '프로그래밍'을 찾으셨나요? 같은 보정 제안을 제공할 수 있게 됐습니다. snippet도 문서 앞부분이 아니라 검색어 주변 맥락을 기준으로 보여줄 수 있게 됐습니다. 이 과정에서 Nori 사용자 사전 158,539개를 적용해 복합어 보존도 함께 개선했고, 필드/분석기 변경이 필요했기 때문에 12,156,589건 무중단 재색인 인프라도 같이 구축했습니다. 인덱스 크기는 약 42GB, 재색인 시간은 약 2시간이었습니다.
4-2. LTR 재랭킹: XGBoost LambdaMART
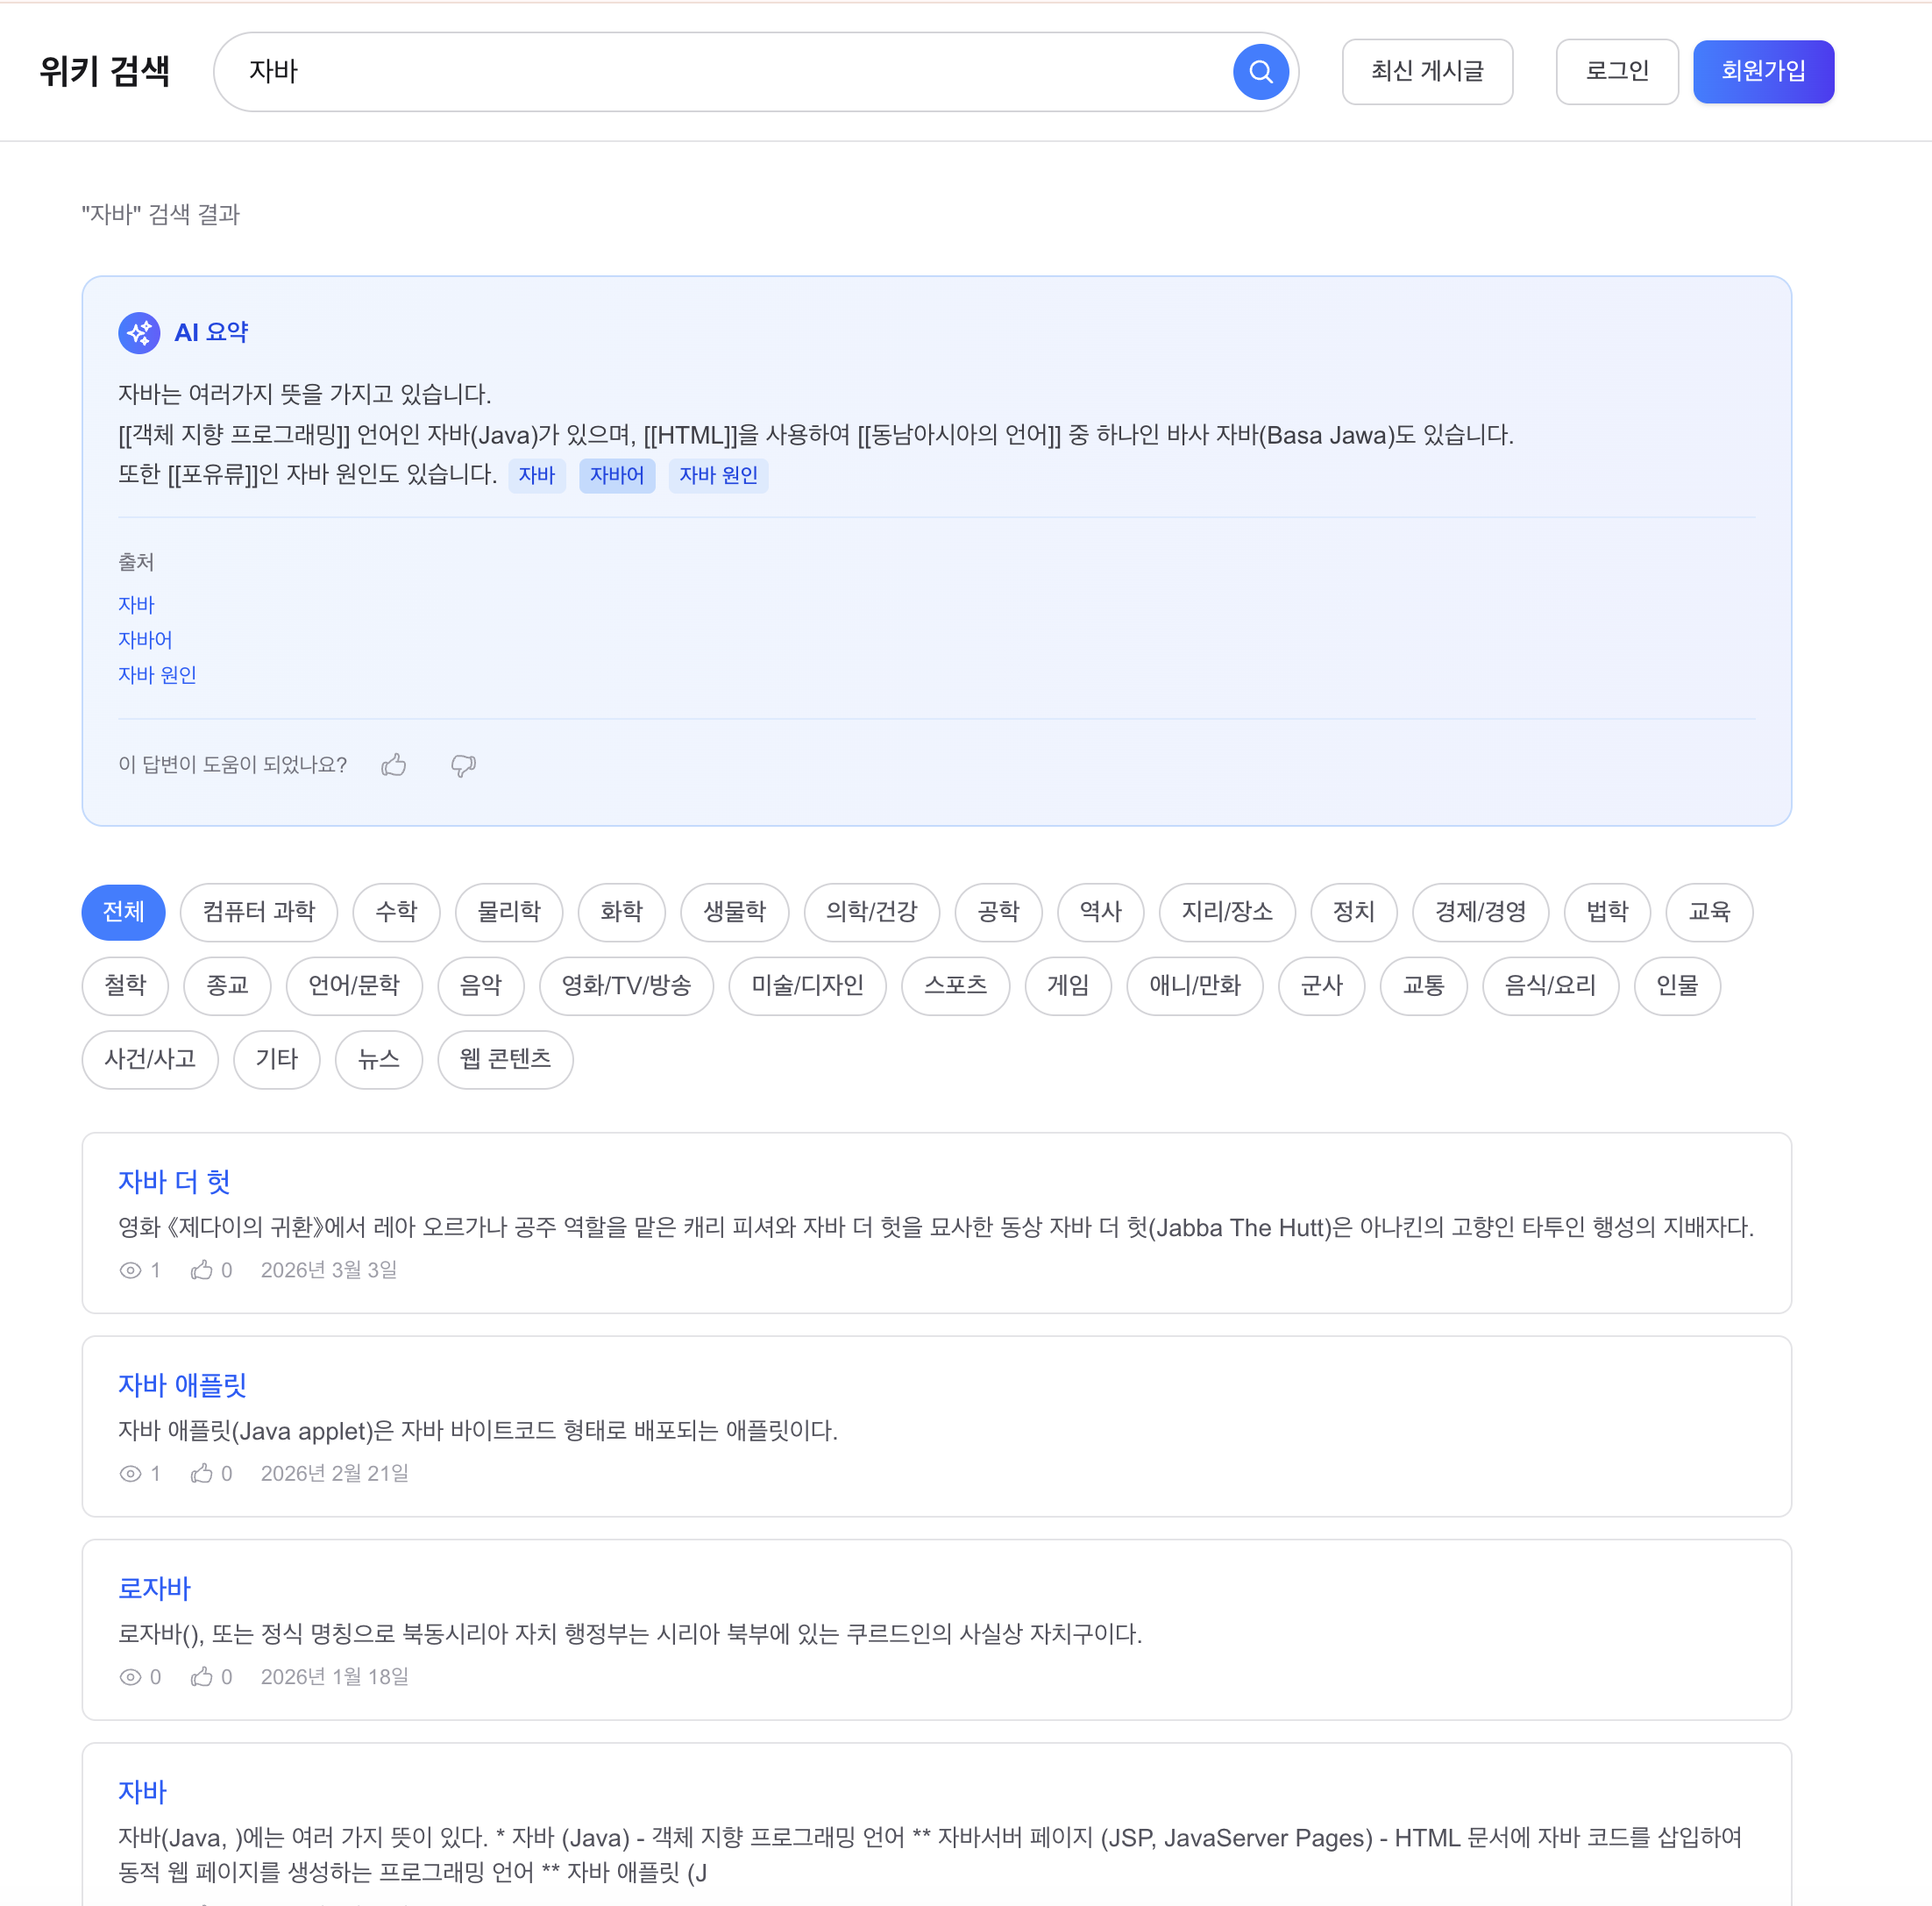
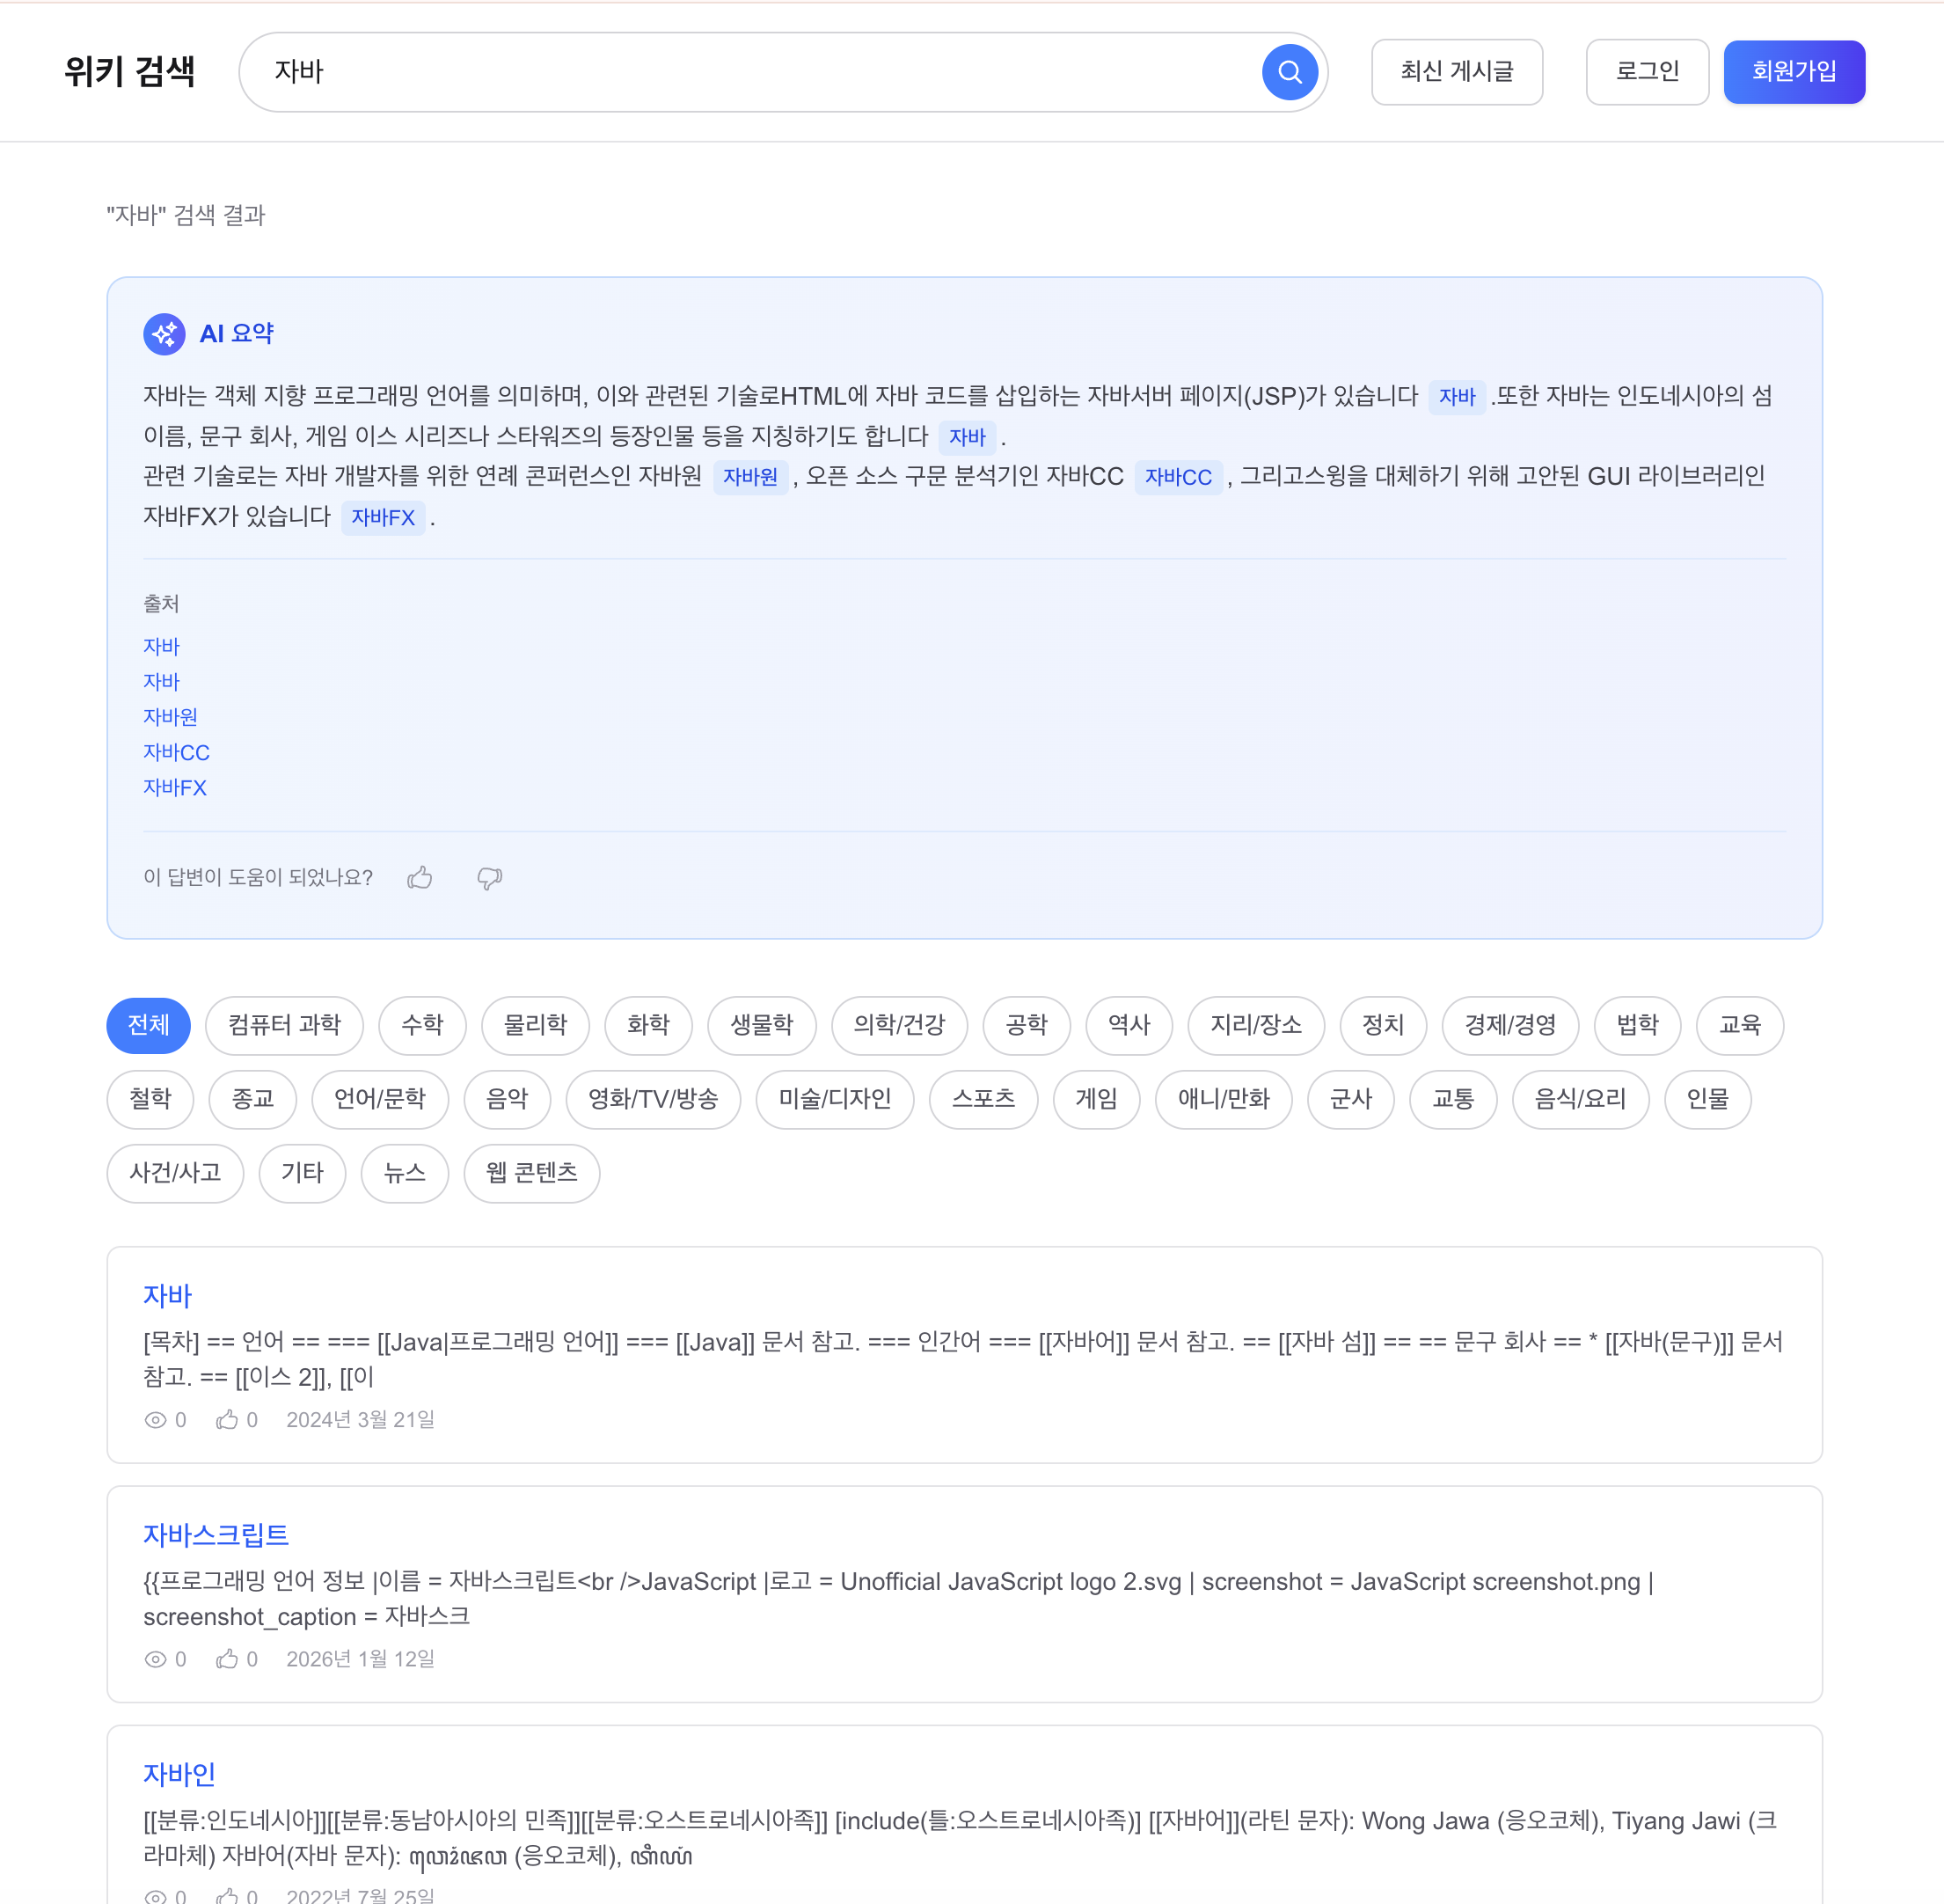
이 단계의 문제는 검색 자체보다 “어떤 문서를 먼저 보여줄지”가 여전히 사람이 정한 선형 가중치에 의존하고 있다는 데 있었습니다. 자바 검색에서 사용자는 대부분 자바(프로그래밍 언어)를 기대하지만, 실제 결과에서는 자바 더 헛(스타워즈) 같은 문서가 더 위로 올라오고 프로그래밍 언어 문서는 4위까지 밀려났습니다. popularity 피처의 변별력이 거의 없는 데이터셋에서 선형 부스팅은 결국 텍스트 매칭 점수에 더 많이 끌려갈 수밖에 없었습니다.
LTR 모델은 여러 대안을 비교했습니다. Linear Model은 결국 수동 부스팅과 같은 종류의 선형 결합이라 같은 피처만으로는 큰 차이를 만들기 어렵다고 봤습니다. 반면 LambdaMART는 tree 기반으로 피처 간 interaction을 학습할 수 있습니다. titleLength, tagOverlap, bm25Title이 함께 작동할 때 특정 유형의 문서를 더 위로 끌어올리는 식의 비선형 관계를 포착할 수 있기 때문에, 현재 문제에는 LambdaMART가 더 적합하다고 판단했습니다.
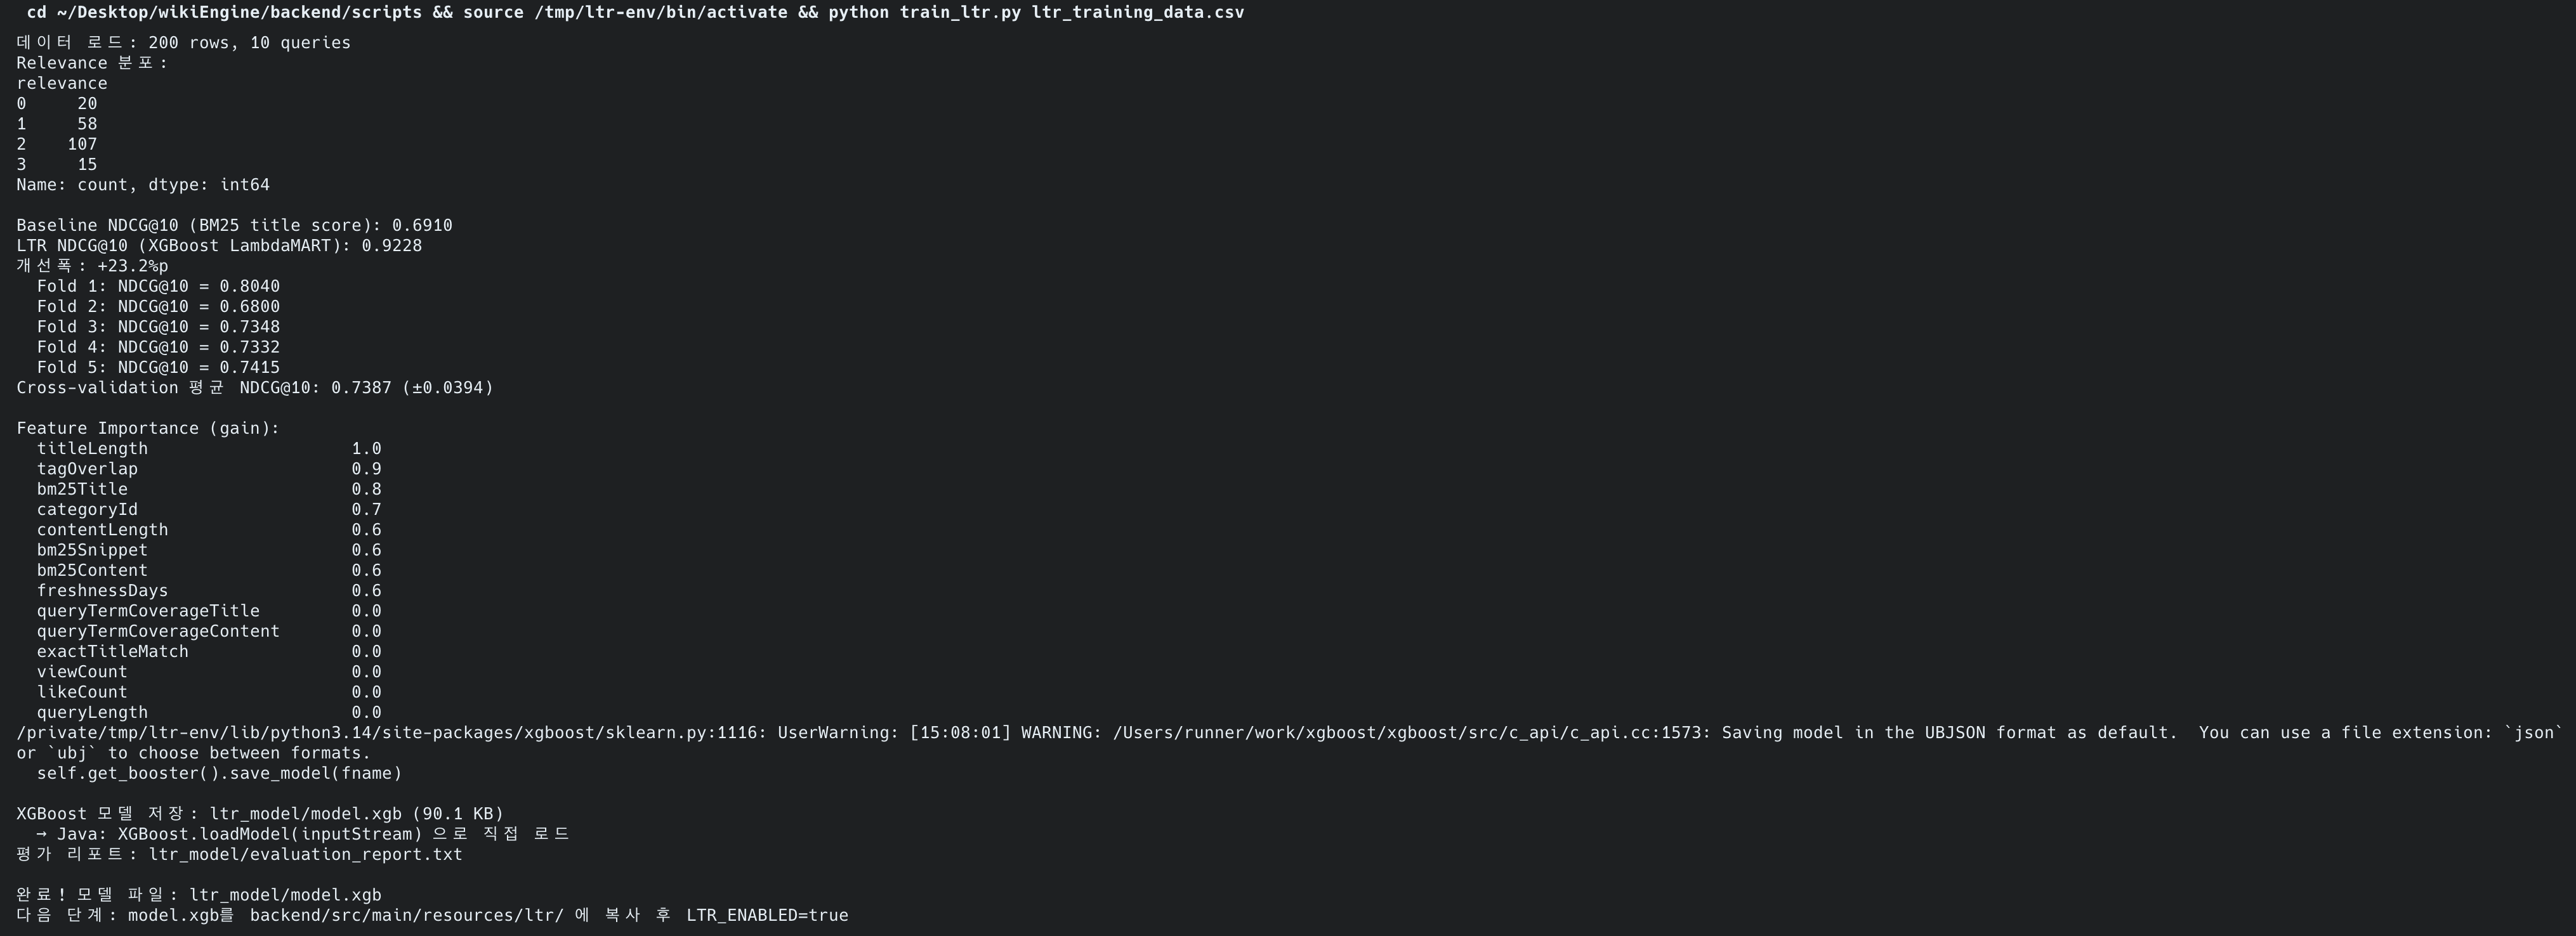
문제는 학습 데이터였습니다. 서비스 트래픽이 거의 없어 클릭 로그가 충분하지 않았기 때문에, cold start 단계에서는 relevance 라벨을 사람이 직접 다는 대신 LLM-as-a-Judge로 대신 판단하게 했습니다. 검색어 45개와 각 쿼리의 BM25 Top-20 결과를 조합해 총 900개의 (query, doc) 쌍을 만들고, 여기에 4단계 relevance 점수를 부여했습니다. 한 번의 응답을 그대로 믿지 않고 3회 호출 평균 반올림으로 비결정성을 줄였습니다.
이 과정은 한 번에 잘 되지 않았습니다. 첫 실행에서는 900건 중 대부분이 실패했고, 성공률이 2% 수준에 불과했습니다. 원인은 라운드 간 딜레이를 너무 짧게 잡아 분당 요청 수가 제한을 넘겼고, Spring AI 기본 retry가 HTTP 429를 재시도 가능한 실패로 보지 않았으며, 결과를 메모리에만 모아두고 있어 대량 실패를 빨리 감지하지 못한 데 있었습니다. 이후 요청 간 간격, 지수 백오프, CSV 즉시 기록, resume 가능한 구조로 바꿨고 다시 수집할 수 있었습니다.
최종적으로는 14개 피처를 추출해 BM25 1차 검색 결과 Top-200을 대상으로 2차 재랭킹을 수행했습니다. 품질 측면에서는 분명한 개선이 있었습니다. BM25 baseline의 NDCG@10은 0.6910, LambdaMART의 5-Fold CV 기준 NDCG@10은 0.7387(+4.8%p)였습니다. 자바 검색에서도 기존에는 자바 더 헛이 1위였지만, 재랭킹 후에는 자바(프로그래밍 언어)가 1위로 올라왔습니다.
하지만 운영 테스트에서는 다른 결론이 나왔습니다. 2코어 ARM 환경에서 LTR를 켠 상태로 100 VU 부하를 주면 전체 평균 응답시간은 42.81ms → 3,088ms, 검색은 29.18ms → 8,826ms로 급격히 악화됐습니다. P95도 수십 초까지 치솟았고, 검색과 무관한 자동완성 API까지 함께 느려졌습니다. 그래서 최종적으로 운영에서는 LTR_ENABLED=false로 비활성화했고, 이 작업의 핵심 성과를 “프로덕션 적용”이 아니라 “품질 개선과 운영 비용 사이의 경계를 직접 측정하고 판단한 것”으로 정리했습니다.
4-3. 카테고리 자동 분류 + Facet 네이티브 전환
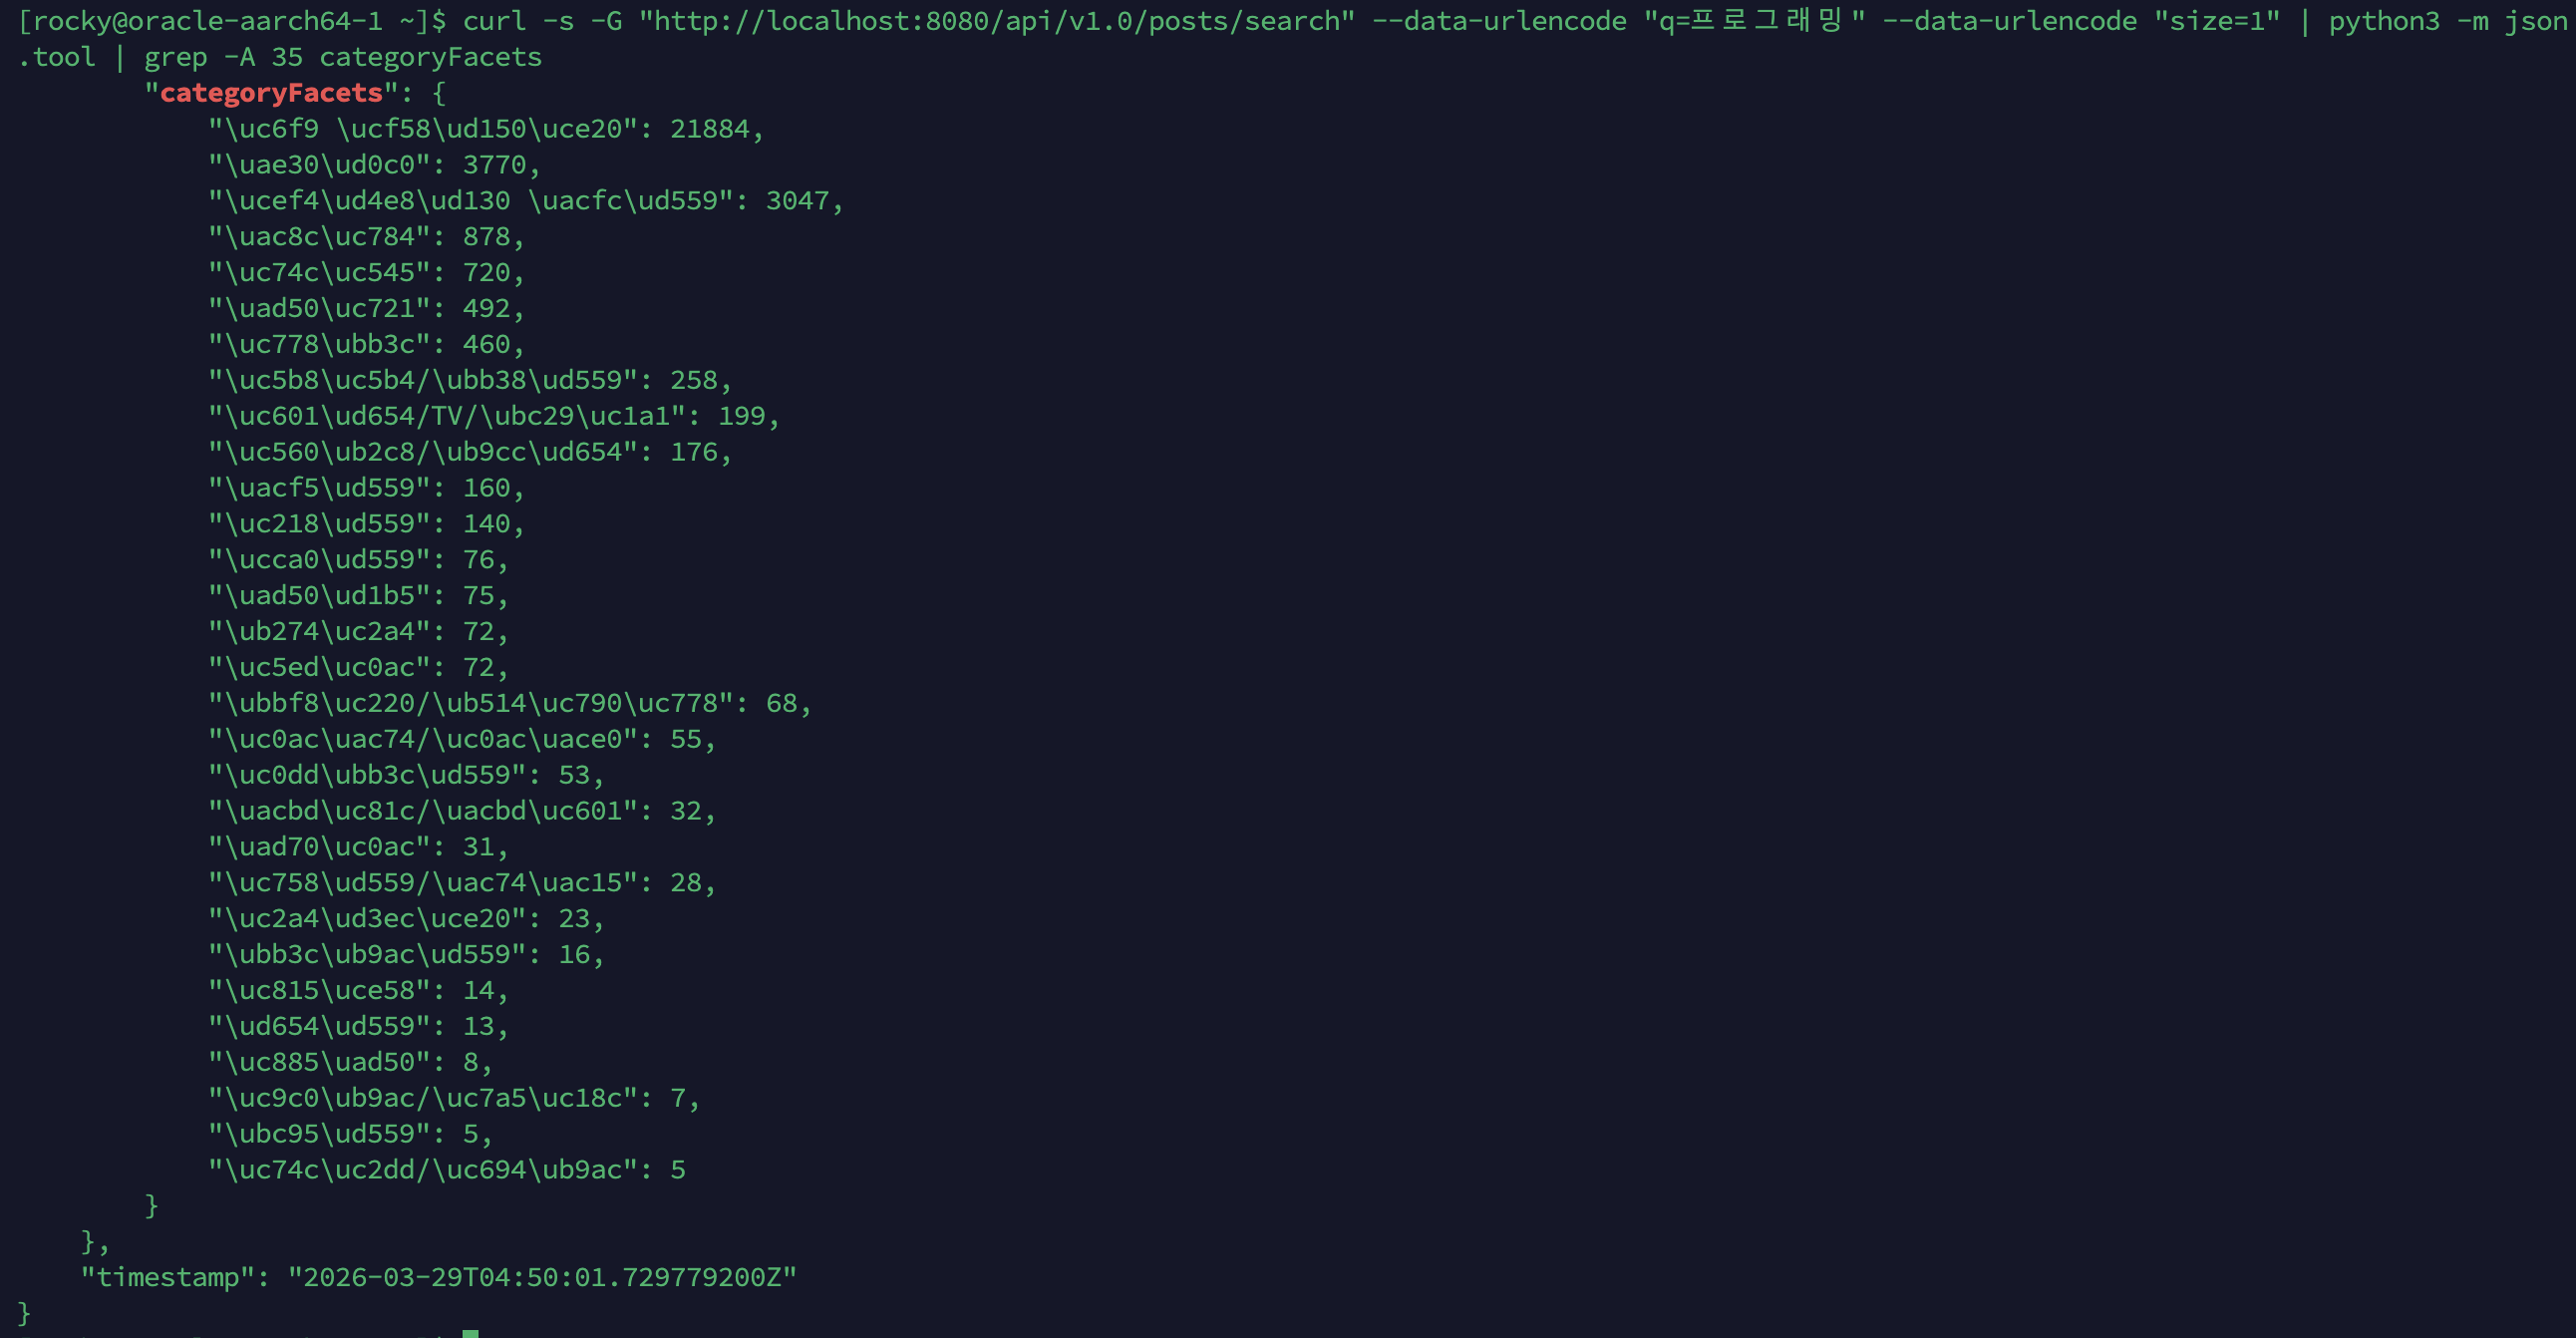
Facet 필터링 자체는 가능했지만, Facet은 실제 탐색 기능으로서 거의 의미가 없었습니다. 위키 데이터 임포트 시 부여된 기존 카테고리가 namespace 기반이라 대부분의 문서가 일반 문서에 몰려 있었고, 실제로 약 97%가 한 카테고리에 편중돼 있었습니다. Facet 집계도 검색 엔진 바깥에서 DB GROUP BY로 별도로 계산하고 있어, 검색 결과를 거르는 경로와 카테고리 분포를 계산하는 경로가 서로 달랐습니다.
그래서 먼저 카테고리 값 자체를 다시 정의했습니다. 컴퓨터 과학, 수학, 물리학, 역사, 음악, 게임, 스포츠 등 28개 주제 카테고리로 자동 재분류했고, 90건 수동 검증 기준으로 약 83% 정확도를 확인했습니다. 경계 사례에서 오분류가 일부 있었지만, 이 기능의 목적이 정밀 분류 모델이 아니라 사용자가 검색 결과를 더 쉽게 좁혀보게 하는 탐색 축이라는 점을 고려하면 충분히 실용적이었습니다.
그 다음 단계에서는 카테고리 필터와 Facet 집계를 모두 Lucene 내부로 가져왔습니다. 카테고리 값을 검색 인덱스에 함께 저장하고, Facet도 검색 결과와 동일한 reader 기준으로 계산하도록 바꾸면서, 필터링과 집계가 같은 기준 위에서 동작하도록 정리한 것입니다. 태그도 함께 검토했지만, 216만 개 규모의 고카디널리티 태그에 Facet을 붙이면 집계 비용과 UI 복잡도만 커지고 사용자가 탐색에 활용하기 어렵다고 봤습니다. 그래서 태그는 검색 매칭 품질을 높이는 용도로만 인덱싱하고, Facet은 상대적으로 안정적이고 사람이 해석 가능한 카테고리 축에만 유지했습니다.
4-4. 콘텐츠 필터링: 운영 안전장치
이 단계의 대상은 POST /api/v1.0/posts 작성 API와, 그 결과가 노출되는 검색/자동완성 경로였습니다. 당시 구조에서는 게시글 작성 시 본문과 제목에 대한 유해 콘텐츠 검사가 없었기 때문에 어떤 문자열이든 그대로 저장될 수 있었습니다. 문제는 이게 단순히 “나쁜 글이 저장된다”로 끝나지 않는다는 점이었습니다. 한 번 저장된 콘텐츠는 검색 결과와 자동완성 후보에도 그대로 반영되기 때문에, 검색 시스템 전체의 품질과 운영 안정성까지 함께 오염시킬 수 있었습니다.
가장 단순한 방법은 금칙어 목록을 하나씩 돌며 String.contains()로 검사하는 방식입니다. 하지만 금칙어가 수만 개 수준으로 늘어나면 게시글 하나를 검사할 때마다 본문 전체를 같은 방식으로 반복 순회해야 하므로, 비용이 금칙어 수에 비례해 증가합니다. 그래서 이 단계에서는 여러 금칙어 패턴을 한 번의 텍스트 순회 안에서 동시에 탐지할 수 있는 구조가 필요했고, 그 결과 Aho-Corasick을 선택했습니다. 이 방식은 여러 패턴을 Trie와 실패 링크로 묶어두고 입력 텍스트를 한 번만 읽으면서 모든 패턴을 동시에 검사할 수 있습니다.
노출 제어도 별도로 설계했습니다. 금칙어가 포함된 게시글을 검색 인덱스에서 삭제하는 방법도 있었지만, 이 방식은 복구가 필요할 때 다시 인덱싱해야 합니다. 그래서 게시글에 blinded 같은 상태를 두고, 검색에서는 제외하되 복원은 즉시 가능하게 하는 방식으로 처리했습니다. 앱 기동 직후 검색 인덱스가 아직 완전히 준비되지 않았을 때 발생할 수 있는 빈 결과는 짧은 TTL로만 캐시해 cache penetration을 막으면서도 잘못된 상태가 오래 유지되지는 않도록 했습니다.
4-5. AI 검색 요약: RAG 파이프라인
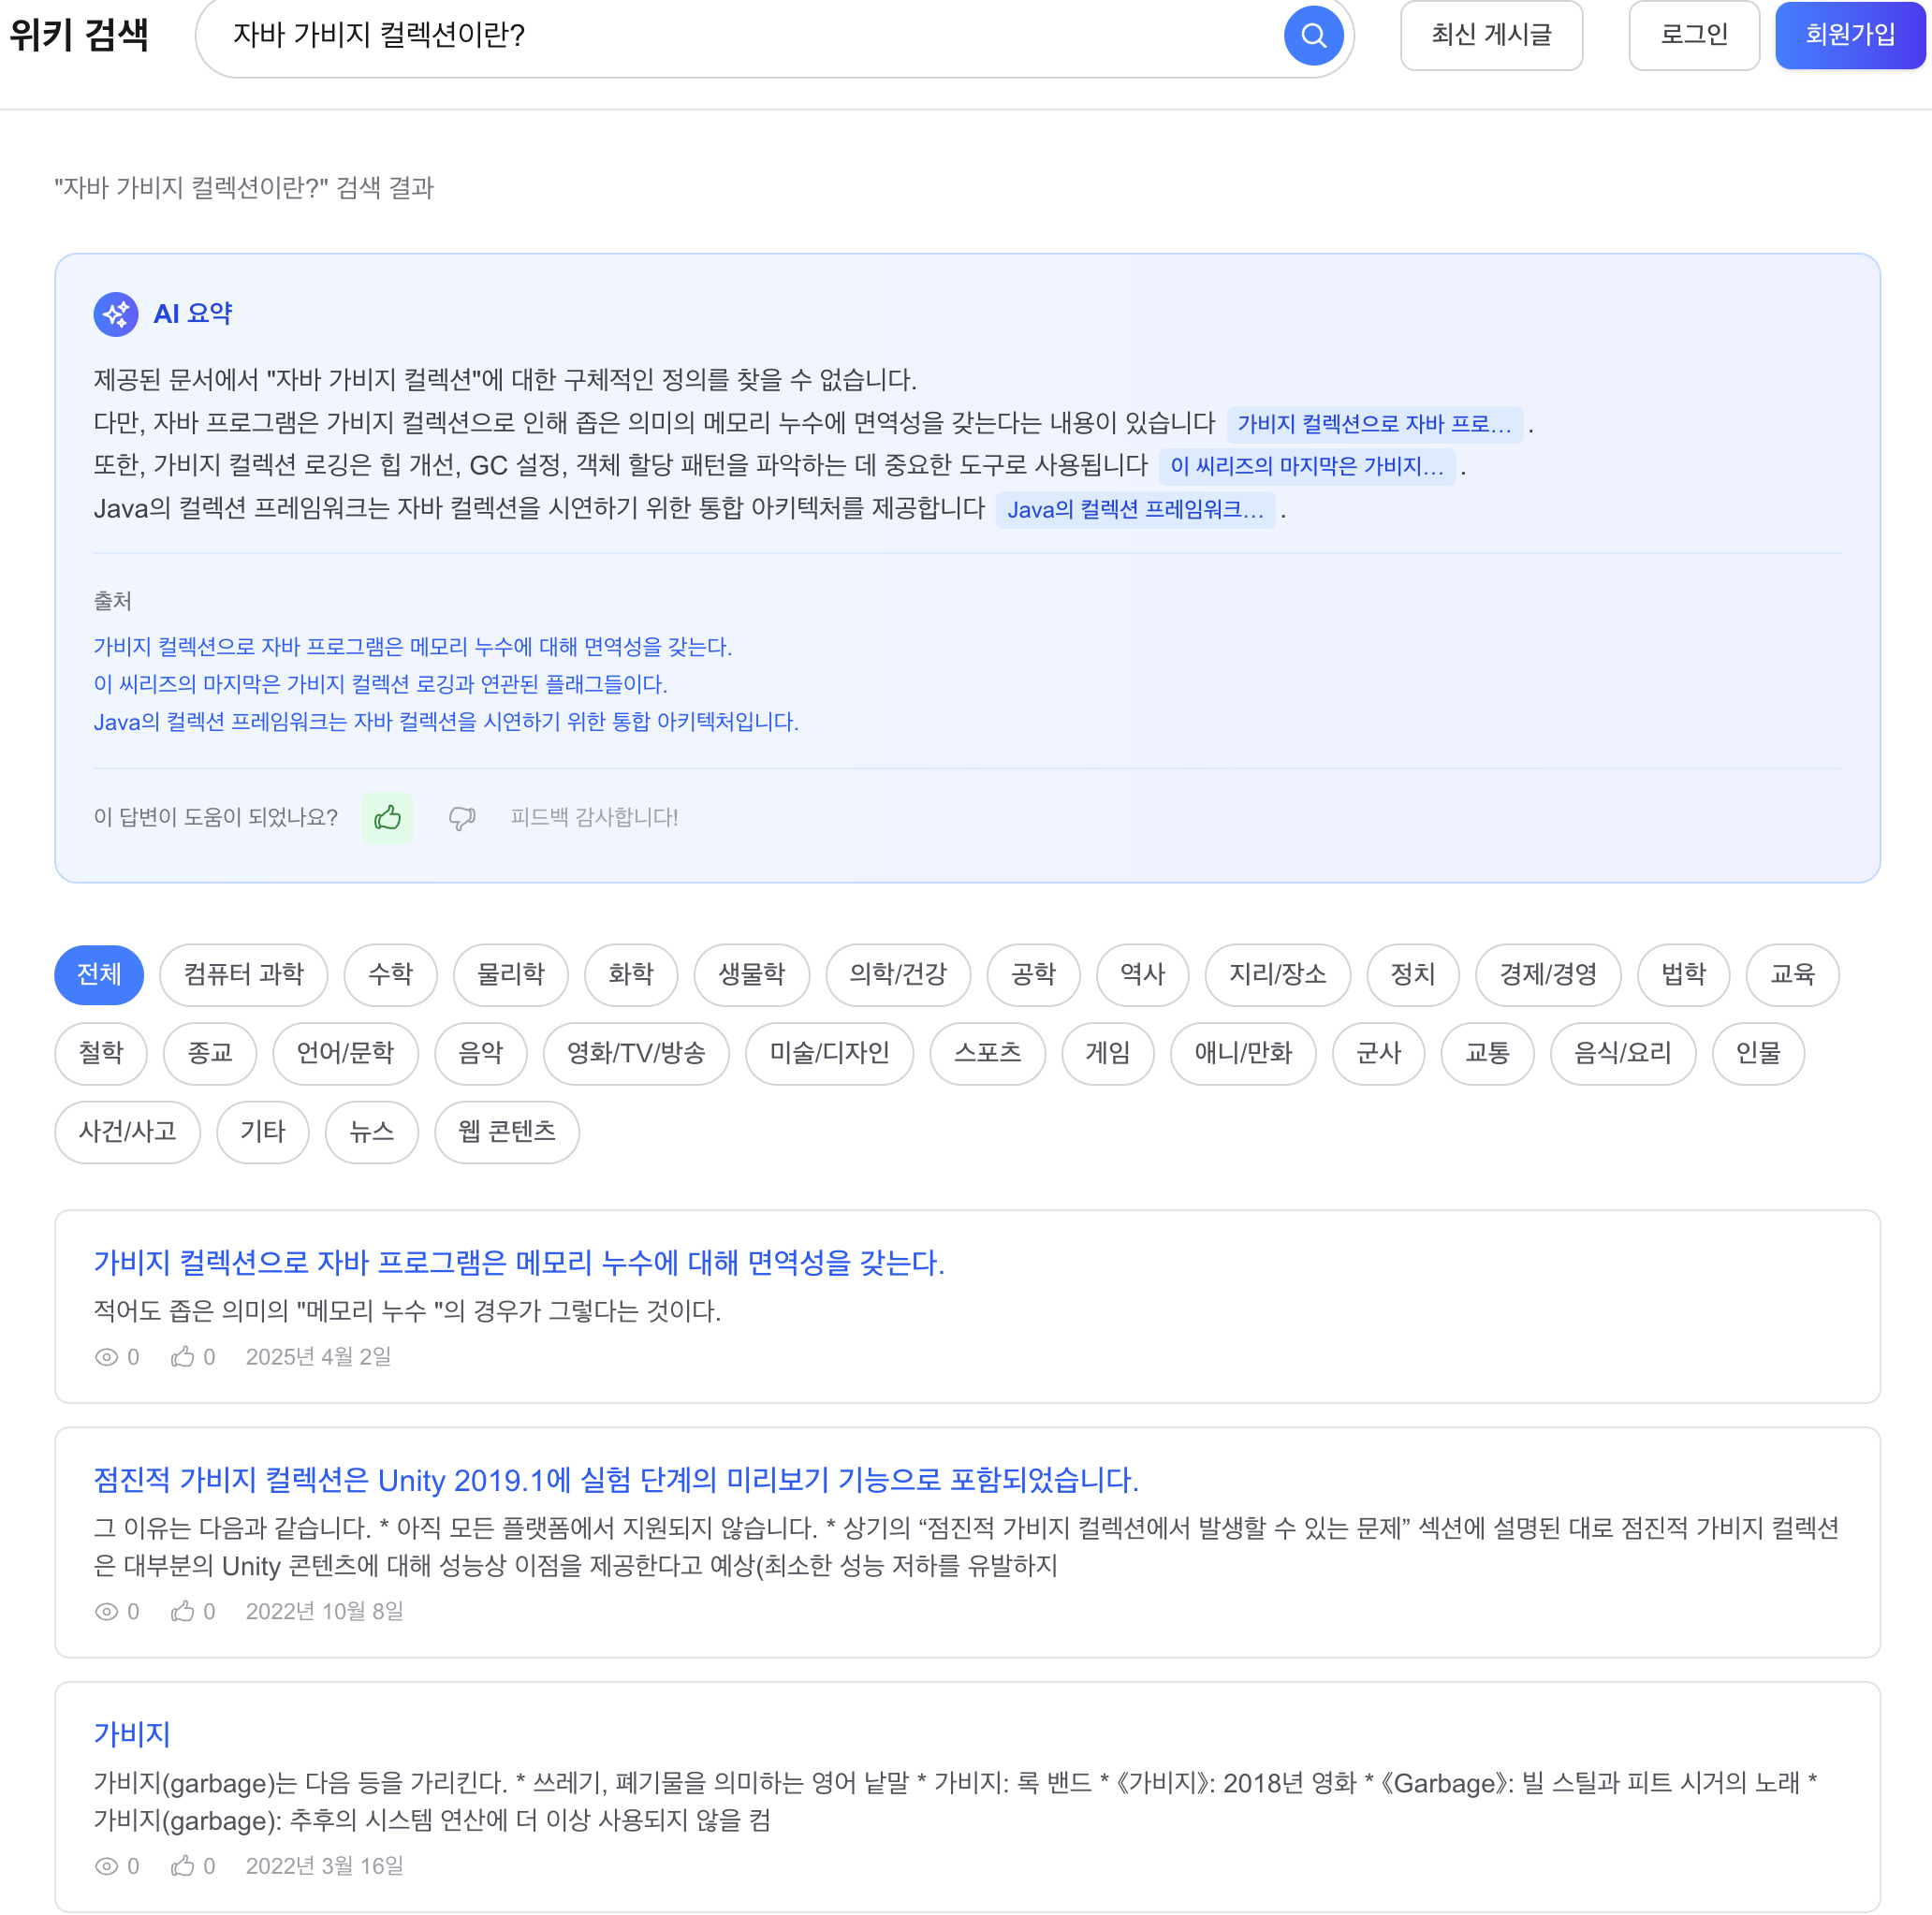
이 단계의 대상은 검색 결과 화면의 AI 요약 기능이었습니다. 당시 검색 엔진은 Lucene BM25 기반으로 관련 문서를 찾아 제목과 snippet을 보여줄 수 있었지만, 사용자는 여전히 여러 게시글을 직접 클릭해 읽어야 원하는 답을 얻을 수 있었습니다. 기존 AI 요약 구현도 검색된 문서를 컨텍스트로 주지 않고 쿼리만 LLM에 전달하는 방식이었기 때문에, 답변이 실제 검색 결과와 어긋날 수 있었고 출처를 붙일 수도 없었습니다.
이를 해결하기 위해 검색 결과를 그대로 LLM의 입력 컨텍스트로 연결하는 RAG 파이프라인을 구성했습니다. 흐름은 다섯 단계였습니다. 먼저 기존에 구현해둔 오타 교정과 동의어 확장을 재사용해 쿼리를 정리하고, 그 다음 Lucene BM25로 상위 문서를 검색했습니다. 이후 상위 5개 문서에서 필요한 부분만 잘라 컨텍스트를 구성하고, 이를 기반으로 LLM이 답변을 생성하도록 만들었습니다. 마지막으로 답변은 SSE로 스트리밍해 검색 결과는 즉시 보여주고, AI 요약은 비동기로 이어서 도착하도록 구성했습니다.
Retrieval은 Dense Retrieval이 아니라 기존 BM25를 그대로 사용했습니다. 현재 프로젝트의 주요 사용 패턴이 기술 용어와 개념 중심의 키워드 검색에 가까웠고, AI → 인공지능 수준의 의미 확장은 이미 동의어 확장으로 해결된 상태였기 때문에, 지금 단계에서 임베딩 모델과 벡터 저장소를 새로 도입하는 것은 요구사항 대비 복잡도가 더 크다고 판단했습니다.
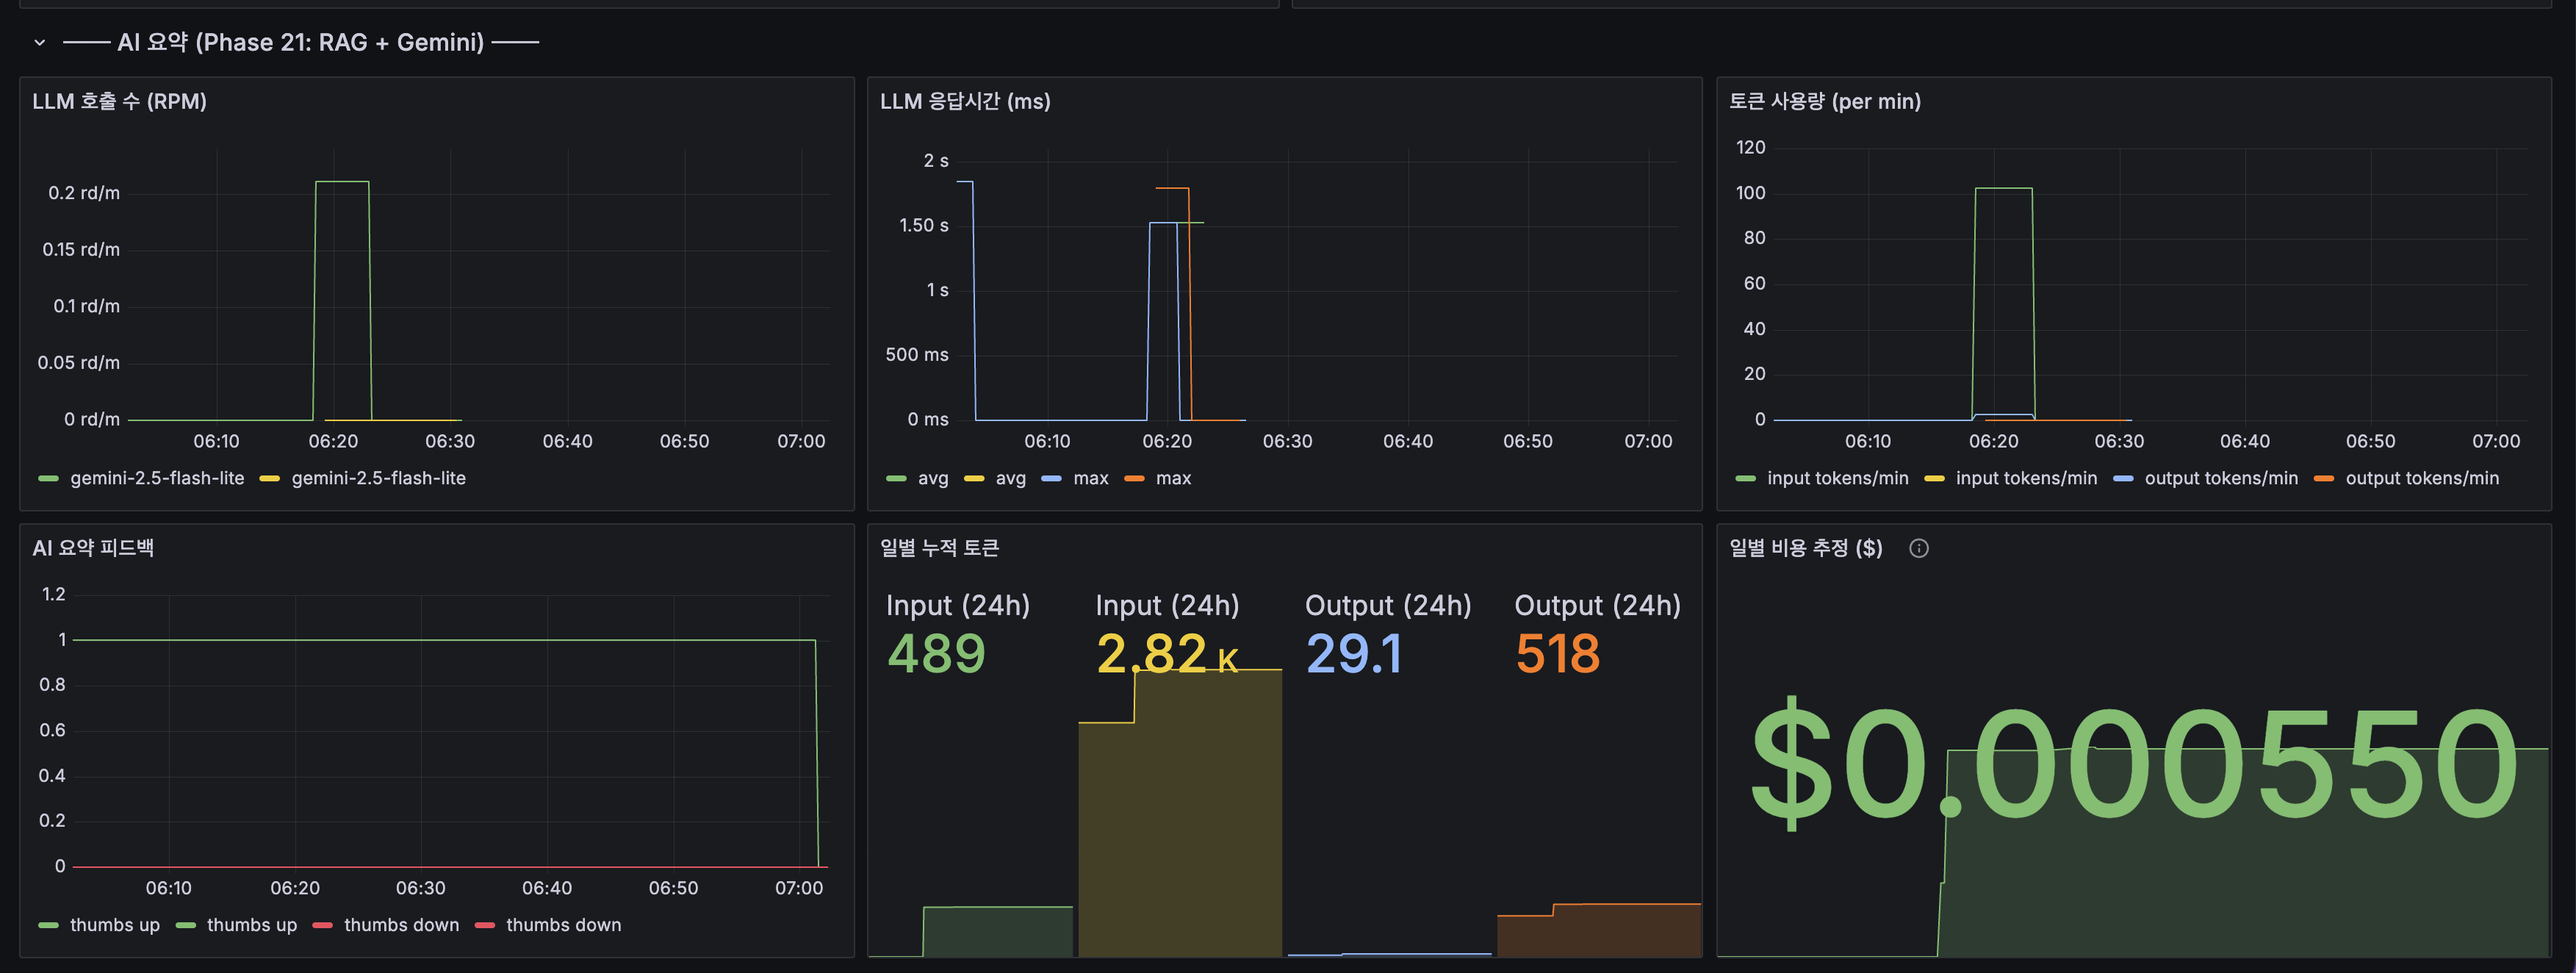
운영 관점에서는 비용과 안정성도 함께 봤습니다. 모든 검색에 AI 요약을 붙이면 비용만 늘고 효율은 낮아지기 때문에, 네비게이션 의도나 거래 의도가 강한 쿼리는 아예 AI 요약을 생략하도록 분기했습니다. 또 동일한 쿼리는 일정 시간 동안 캐시하고, 호출 수는 전역 제한을 걸어 한 번에 과도한 요청이 나가지 않도록 했습니다. 할루시네이션 방지도 구조적으로 넣었습니다. 시스템 프롬프트에 제공된 문서만 참고하도록 제한하고, 답변 안에는 [문서 N] 형태의 인라인 인용을 강제했습니다.
그 결과 사용자는 검색 결과를 먼저 확인하면서도, 별도의 AI 요약 영역에서 핵심 내용을 바로 받을 수 있게 됐습니다. 답변은 SSE로 스트리밍되어 검색 결과를 기다리는 경험을 방해하지 않았고, 인라인 출처를 통해 어느 문서를 근거로 요약했는지도 함께 확인할 수 있게 됐습니다.
관련 글: 카테고리 검색 필터링, 쿼리 확장 + Query Understanding, LTR 재랭킹 + 카테고리 자동 분류, 콘텐츠 필터링, AI 검색 요약 RAG
5. 실패와 교훈
1. LTR ON 시 72배 성능 악화
원인은 rescore window 200에서 문서당 14개 피처를 추출하는 과정이 2코어 ARM에서 지나치게 비쌌기 때문입니다. BM25 3필드 x 200문서 수준의 scorer 생성과 Nori 토큰화가 겹치면서 CPU가 완전히 포화됐고, LTR와 무관한 API까지 함께 느려졌습니다.
교훈: 기능 검증과 프로덕션 적용은 별개였습니다. 품질 지표가 좋아졌다는 이유만으로 운영 경로에 바로 넣을 수는 없고, 지금 인프라가 그 비용을 감당할 수 있는지까지 함께 측정해야 합니다.
2. LLM 학습 데이터 생성 98% 실패
원인은 외부 API rate limit을 잘못 계산했고, Spring AI 기본 retry가 HTTP 429를 재시도 가능한 실패로 보지 않았으며, 결과를 메모리 전용으로만 들고 있어 대량 실패를 빨리 인지하지 못한 데 있었습니다.
교훈: 외부 API를 활용한 파이프라인은 “기능이 된다”보다 “실패를 관측할 수 있는가”가 먼저여야 했습니다. 호출 한도는 예산처럼 계산하고, 결과는 즉시 디스크에 기록하며, resume 가능한 구조를 만드는 것이 더 중요했습니다.
3. CDC 배포 후 검색 미반영
멀티 인스턴스 환경에서 CDC Consumer와 Lucene IndexWriter의 위치가 어긋났습니다. App 2에서 CDC 이벤트를 수신했지만 App 2는 Lucene replica라 인덱싱이 skip됐고, App 1은 Kafka 환경변수 매핑 누락으로 연결 자체가 실패했습니다.
교훈: 분산 구조에서는 개별 컴포넌트가 healthy라는 사실만으로는 충분하지 않았습니다. 이벤트를 읽는 위치, 인덱스를 쓰는 위치, 설정이 실제 배포 경로에서 어떻게 연결되는지를 끝까지 따라가 보는 end-to-end 검증이 필수였습니다.
4. Flyway 마이그레이션 Replica 미전파
MySQL Replication이 끊겨 DDL이 Replica에 전파되지 않았고, ddl-auto: validate와 update의 차이로 로컬에서는 자동 처리되던 스키마 변경이 운영에서 실패했습니다. ai_summary_feedback 테이블과 blinded 컬럼이 Replica에 없어 읽기 쿼리가 실패했습니다.
교훈: 배포 완료의 기준은 단순한 마이그레이션 성공이 아니라, Primary와 Replica가 동일한 스키마 상태에 도달했는가였습니다. 운영에서는 Replication 상태와 Flyway 적용 여부를 함께 확인하는 체크리스트가 필요했습니다.
5. snippetSource에 raw 위키 마크업 저장
위키 마크업([include(틀:XXX)], {{생물 분류}})을 stored field에 그대로 저장하면서 UnifiedHighlighter가 offset을 맞추지 못해 빈 snippet을 반환했습니다.
교훈: 검색 시스템에서는 저장된 원문과 검색/하이라이팅에 적합한 표현이 같지 않을 수 있습니다. raw 데이터를 stored field에 그대로 넣는 것은 안티패턴이었고, source_text(raw)와 clean text를 분리해 인덱스 타임에 정제된 필드를 따로 저장해야 했습니다.
최종 아키텍처 + 핵심 수치
검색 성능
| 항목 | Before | After | 측정 조건 |
|---|---|---|---|
| 본문 검색 | LIKE 타임아웃 (5,000ms+) | Lucene BM25 29ms (P95 100ms) | EXPLAIN rows=27,443,742 |
| B-Tree 자동완성 | LIKE 타임아웃 (5,000ms+) | 8ms | 복합 인덱스 idx_title_viewcount |
| FULLTEXT ngram | 12,766ms | 8ms | 57만 건, 인덱스 6.7GB |
| Redis 자동완성 | Trie DFS 5ms | Redis GET 11ms (P95 68ms) | flat KV O(1), 약 5,000 prefix 키 |
| 전체 응답 | 776ms | 54ms (14.4배) | Caffeine 도입 |
| L1+L2 히트율 | 0% | 82% (L1 73% + L2 9%) | Origin 도달률 19% |
| Redis 메모리 | - | 73MB / 256MB (28.4%) | Eviction 0, Lettuce P95 2.5ms |
분산 아키텍처
| 항목 | 단일 서버 | 분산 (2 App) | 변화 |
|---|---|---|---|
| 에러율 (쿼리) | 32.53% (COUNT(*) 타임아웃) | 0% | Page → Slice 전환 |
| 에러율 (부하 100 VU) | 13.25% | 0% | App 스케일아웃 |
| 에러율 (부하 200 VU) | - | 0.09% | MySQL/Redis/Kafka 모두 여유 |
| 평균 응답 (100 VU) | 482ms | 37ms | 92% 감소 |
| P95 (100 VU) | 2,300ms | 190ms | 12배 개선 |
| 처리량 | 약 30 req/s | 109 req/s | 3.6배 증가 |
| 상세조회 에러 | 11.10% (DB UPDATE 충돌) | 0% (Redis INCR) | Write-Behind 30초 배치 |
| 게시글 생성 | 5,315ms (dual-write) | 33ms | CDC, 160배 개선 |
| KEYS 블로킹 | 34.6ms SLOWLOG | 해소 | SCAN 전환 + 3노드 격리 |
| Replication | - | Primary 50ops/s, Replica 200ops/s, Lag 0~1초 | GTID 비동기 |
검색 품질
| 항목 | Before | After | 방식 |
|---|---|---|---|
| P@10 | 0.827 | 0.853 | PhraseQuery(slop=2) + FeatureField |
| NDCG@10 | 0.6910 | 0.7387 (+4.8%p) | XGBoost LambdaMART 14피처 |
| AI 검색 | 영문 Ai 문서만 | 인공지능 1위 | DB 동의어 쿼리 타임 확장 |
| 오타 교정 | 결과 0건/무관 결과 | 프로그래밍 제안 | DirectSpellChecker |
| snippet | 앞 150자 (무관) | 검색어 주변 맥락 | UnifiedHighlighter + 500자 StoredField |
| Facet | 없음 | 30개 카테고리 전체 집계 | SortedSetDocValuesFacetCounts |
| 카테고리 분류 | Namespace 97% 편중 | 28개 주제별 (정확도 83%) | 키워드 기반 배치 분류 |
| 금칙어 | 없음 | 16,090개 탐지 | Aho-Corasick O(N+Z) |
| AI 요약 | 없음 | RAG + SSE + 출처 링크 | Gemini 15 RPM, 캐시 30분 TTL |
| 검색 최종 (Facet+태그) | - | 548ms (P95 2.61s) | 인덱스 42GB, Nori 사전 158K |
| LTR ON 한계 | - | 3,088ms (72배 악화) | 2코어 ARM CPU 포화 → OFF |
인프라 규모
- Lucene 인덱스: 42GB (5세그먼트)
- 무중단 재색인: 약 2시간
- Nori 사용자 사전: 158,539개
- 금칙어: 16,090개
- Redis: 3노드 (약 4,620키)
- HikariCP: Primary 5 + Replica 15
- Kafka: KRaft 단일 브로커 + DLQ
레디스 히트율이 80%대로 보인 이유는 k6가 일부러 캐시 미스를 유발하는 시나리오를 포함했기 때문입니다. 46개 키워드 x 페이지 x 카테고리 조합이 섞였고, 희귀 토큰과 랜덤 상세 조회도 포함돼 있었기 때문에 실제 운영 트래픽의 Zipfian 분포보다 보수적인 조건이었습니다. 실트래픽에서는 인기 키워드와 page=0에 더 집중되기 때문에 캐시 히트율은 더 높아질 가능성이 큽니다.
관련 글
- 검색 인프라 구축: 검색 시스템 장애 방지, B-Tree 인덱스 자동완성, FULLTEXT ngram 인덱스, Lucene 전환, Deferred Join 최적화, 쿼리 리팩토링, 검색 품질 평가
- 캐시/자동완성: 캐싱 전략, Trie 자동완성, Redis L2 캐시
- 분산 아키텍처: 부하 테스트 튜닝, MySQL Replication, App 스케일아웃, 조회수 Redis INCR, CDC 이벤트 기반 동기화, Redis 샤딩, 분산 안정성 검증
- 검색 품질/AI: 카테고리 검색 필터링, 쿼리 확장 + Query Understanding, LTR 재랭킹 + 카테고리 자동 분류, 콘텐츠 필터링, AI 검색 요약 RAG, 인터뷰 예상 질문 정리
마무리
최종 구조를 한 문장으로 요약하면, 무거운 계산은 뒤로 밀고, 사용자 요청 경로는 최대한 짧고 단순하게 유지하는 방향으로 정리됐습니다. 검색은 빠르게 읽히는 경로와 뒤에서 정리되는 경로를 분리했고, 상태는 가능한 한 외부화했으며, 변경 전파는 서비스 코드의 직접 호출보다 더 일관된 기준 위에 올리려고 했습니다.
돌이켜보면 이 프로젝트에서 가장 크게 배운 것은, 좋은 구조가 처음부터 정답처럼 주어지는 것이 아니라는 점이었습니다. 병목을 관찰하고, 실패를 겪고, 지금 단계에서 가장 큰 제약이 무엇인지를 다시 정의하면서 구조를 조금씩 바꾸는 과정 자체가 엔지니어링이었습니다. 그래서 WikiEngine은 단순히 검색 엔진을 만든 프로젝트라기보다, 제약 안에서 무엇을 먼저 해결해야 하는지 판단하는 연습에 더 가까운 프로젝트로 남아 있습니다.
Project Overview
WikiEngine is a search engine that loads 12,156,589 documents from six public datasets — Namuwiki, Korean/English Wikipedia, news, and web text — and reshapes them as community-board posts. Wiki documents are not used as-is: [[Category:XXX]] becomes tags and categories; news/web content is assigned source-fixed categories; author_id is evenly distributed across 100K dummy users; created_at is spread over 2020-2025 to produce a read pattern close to a real service.
Data sources
| Source | Format | Docs | Notes |
|---|---|---|---|
| Namuwiki (2021.03) | JSON | 571,364 | Namu-mark body, Korean community docs |
| Korean Wikipedia (2026.03) | XML | 739,791 | MediaWiki XML dump (ns=0 only) |
| English Wikipedia (2026.02) | XML | 7,139,510 | MediaWiki XML dump (ns=0 only) |
| Korean news | JSON | 159,639 | news article text |
| Korean web text | JSON | 1,284,822 | web-crawled text |
| C4 Korean clean | JSON | 2,261,463 | Korean web corpus |
| Total | 12,156,589 | 30 categories, ~2.16M unique tags |
Tech used
- Backend: Java, Spring Boot, Spring Batch, Spring Kafka, JPA/Hibernate
- Search/Data: Lucene, Nori, MySQL, Redis, Caffeine
- Messaging/Data Sync: Kafka, CDC
- Infra/DevOps: Docker, Nginx, Ansible, GitHub Actions
- Observability/Test: Prometheus, Grafana, k6
Functional requirements
Before starting implementation, defined exactly what the autocomplete system had to do:
- Suggestion basis: query frequency over the last 24 hours
- Number of suggestions: top 10 per prefix
- Coverage: Korean / English, up to 60-character input
- Response time: ≤240ms to keep up with average typing speed
- Freshness: up to 1 hour delay tolerated for recommendations
- Consistency: not required to show the same suggestions to all users at the same moment
Non-functional requirements
As important as functionality was deciding up front, in numbers, what speed and scale to support:
- Scale: current infra is OCI Free Tier 2-core ARM, measured under k6 load at 100 VU
- Response time: must beat average typing speed (4 chars/s), so ≤240ms
- Data freshness: up to 1-hour delay tolerated
- Consistency model: eventual consistency — no need to show all users the same suggestions at once
Key pre-design judgments
After settling requirements, the next call was not “what tech to use” but “what structure is simplest and most reasonable”:
First, my first instinct for autocomplete was a Trie, but with large documents and 60-char input, keeping every candidate in memory was too expensive. Especially for 1-2-character prefixes, candidate branching explodes; once you add re-sorting by popularity, hitting the target response time reliably becomes hard. So instead of re-traversing candidates per keystroke, pre-aggregating top suggestions per prefix and returning them on request felt more sustainable.
Second, autocomplete lookup and search-query aggregation look the same on the surface but have very different requirements. Autocomplete requires very low latency; query aggregation tolerates some delay but requires reliable accumulation. So I split the lookup path and the aggregation path, so the “show fast” structure and the “collect reliably” structure do not interfere with each other.
Third, if the recommendations may be up to one hour stale, processing every input in real time is overkill compared to periodic batch aggregation. With this judgment, the lookup path returns already-sorted results immediately, and heavy computation is deferred.
1. Search Engine Migration — From MySQL LIKE to Lucene
Step 1: steady state — MySQL LIKE search
Initial search did body lookup with MySQL LIKE '%keyword%'. The posts table had id (PK, BIGINT AUTO_INCREMENT), title (VARCHAR 500), content (MEDIUMTEXT, ~6,586 chars on average), category_id (FK), view_count (BIGINT), like_count (BIGINT), created_at (DATETIME), with posts:categories = N:1. Data was already 12.15M rows, and content contained wiki markup, so average row size was large.
Step 2: problem — timeouts and cascade failure
Under k6 load, the search API repeatedly hit 5,000ms+ timeouts. EXPLAIN showed type=ALL, rows=27,443,742 — full table scans. LIKE '%keyword%' cannot use a B-Tree index due to the leading wildcard, and 27M+ MEDIUMTEXT rows had to be string-compared per row. The deeper problem was not the timeout itself but the cascade failure: a single search query holds a HikariCP connection for seconds, and other endpoints (post list, detail, post creation) cannot acquire connections — the entire service is paralyzed.
Step 3: analysis — why MySQL full-text has structural limits
Attempt 1 — FULLTEXT ngram index
The first attempt was a MySQL FULLTEXT ngram index. For some queries it improved 12s → 6ms — a clear win. But for high-frequency tokens like the 2-character 대한, posting list traversal exploded again, and 5,000ms+ timeouts came back.
The problem was not just performance. ngram is plain 2-character splitting, not morphological analysis, so false positives were many. Estimating 12.15M docs × ~6,586 chars × ngram token combinations gave a projected index size of 300GB+. With ~47GB of disk at the time, storing it was physically impossible. MySQL FULLTEXT boolean mode also auto-excludes terms appearing in 50%+ of documents — Korean particles and common endings crossed that threshold and went missing in results. What this stage made clear was not “slightly faster MySQL search” but that MySQL full-text search structurally does not fit this data.
Step 4: alternatives — what fits the current constraints
The core question was not “which search engine has the most features” but “what search structure can this single server actually handle now.” The environment was a single 2-core, 12GB-RAM box running app, MySQL, and Nginx together; what was needed first was not large-scale distributed search but a path where search works without timeouts and the index is operationally feasible.
Elasticsearch and OpenSearch have rich features and operations and scale well to distributed search. But for this project, the moment a search engine becomes a separate process, memory footprint and operational complexity grow together. Search engines need not just JVM heap but also enough page cache for index files, so on a single server, adding a separate search process is costly. Managed OpenSearch was considered too, but cost grows and the MySQL-to-search-engine sync problem still has to be solved separately.
Embedded Lucene, on the other hand, can be controlled directly from inside the application, fits within current server resources without a separate process, keeps the search path simple with no network hops, and lets me directly tune Korean morphology, ranking, and highlighting to the needed level. So Lucene was less a flashy choice than the most operationally realistic one within the single-server constraint.
Step 5: result — what Lucene fixed and what was left
After migrating to Lucene, the first change was that body search stopped relying on timeouts and became a stable, responsive feature. Body search that had been 5+ seconds or failing for some queries stabilized at 29ms / P95 100ms. Reflecting title/body weights, popularity, and recency in ranking improved P@10 from 0.827 → 0.853.
But changing the search engine alone did not fix the entire read path. Body search got fast, but the latest-posts list still carried COUNT(*) and deep-OFFSET costs, and that path resurfaced as the system bottleneck. So afterward, instead of changing the search engine again, I re-sliced the read path: removing unnecessary total-count calculation and rebuilding the deep-OFFSET path under a different optimization. That eliminated the COUNT(*) 2,038ms, took the latest-posts list from 2,518ms → 17.56ms, and resolved error rate from 32.53% → 0%.
Related: Search system crash protection, FULLTEXT ngram index, Lucene migration, Search quality evaluation, Deferred Join optimization, Query refactoring
2. Cache Strategy + Autocomplete — Cutting Repeated Computation, Lifting Quality First
Lucene search itself was down to 29ms, but re-traversing the index for the same query repeatedly still kept burning CPU. Real search traffic concentrates on a small set of popular queries; under k6 load, BM25 + FeatureField + RecencyDecay computation continuously burned CPU and saturated to 80-100% at 100 VU.
The question here was not “where to put the cache” but “which requests do I want to return faster, and by how much.” Search results are not as cacheable as static resources, and combinations of keyword and page balloon quickly. Meanwhile, repeated requests on the same instance are best served immediately with no network cost. So putting the cache as close to the application as possible came first.
I introduced a Caffeine L1 local cache and recorded searchResults hit rate of 81.8%, autocomplete of 99.9%, and postDetail of 40.5%. Overall response time improved 775.89ms → 53.83ms (14.4×). These numbers are not from a cache-friendly cherry-picked benchmark — they were measured with rare/medium/high-frequency queries plus random detail lookups mixed in to keep miss pressure on.
Autocomplete had a separate quality issue. It was fast, but Prefix-based autocomplete returns results in lexicographic order, so typing 삼성 would surface 르노삼성 QM3 before the user-expected 삼성전자. And because Korean is input by jamo, halfway inputs like 삼ㅅ would break suggestions. To fix this, I loaded popular search-log queries into an in-memory Trie and returned top-10 suggestions per prefix via DFS. Adding initial/medial/final-consonant decomposition let 삼ㅅ → 삼성전자 work.
Trie was effective for popularity ordering and Korean-jamo handling. But each lookup carried DFS + sort cost, and updates needed Copy-on-Write memory pressure, so this structure changed again later in the distributed/scale-out phase. The point of this stage was not to finalize autocomplete but to lift perceived quality first via local cache + Trie.
Related: Caching strategy, Trie autocomplete
3. Distributed Architecture — Separating State, Read Load, and Change Propagation Before Adding Servers
Discovering single-server limits
After read-path optimization and autocomplete-quality improvements, I ran a k6 stress test (200 VU, 25 min) on the single server. Below 100 VU it was relatively stable, but ~5 min into the 200 VU phase, CPU saturated to 100%, Load Average shot to 20+, and overall response time collapsed. P95 hit 1,413ms, throughput dropped.
What mattered was distinguishing this from a simple config issue. Memory was free, GC pauses were stable at ≤3ms, the DB buffer pool hit rate was near 100%, lock contention was minimal. Only CPU stayed pinned. Connection waits and thread queueing followed as symptoms. The bottleneck was not memory or I/O but repeated CPU work in the search/lookup path.
3-1. Stateless transition + externalizing shared state
The first call was: “Before adding servers, get the in-app state out.” The app held local cache, Trie autocomplete, and token-revocation state — data that could differ across instances. Just adding app instances would split cache hit rates per server, give different autocomplete results depending on which server answered, and let logged-out tokens look valid again on a different server.
So instead of externalizing everything blindly, kept what must be served fastest as close as possible and externalized only state that must truly be shared. Search results: same-instance repeats served via the shortest path; misses backed by a shared cache — a 2-tier structure. Autocomplete: instead of in-memory Trie, pre-computed top suggestions per prefix and read directly from a shared store, so any instance returns the same results.
In the resulting structure, total cache hit rate climbed to 82%, and the rate that actually reaches DB / search engine dropped to 19%. Autocomplete moved from Trie DFS to per-prefix flat KV lookup, simplifying the response path and giving inter-instance result consistency.
3-2. Read/Write split — why the DB path was split before scaling out the app
The real question was not “is MySQL slow now?” but “can the current DB structure hold once app instances scale out?” By measurements at the time, MySQL was not the direct bottleneck — buffer pool hit rate was high, slow queries were rare, CPU had headroom. But that did not mean leaving the DB alone and just doubling app instances was safe. As app instances grow, read requests and connection counts grow; if all that read load keeps hitting one DB, today’s “looks fine” turns into tomorrow’s bottleneck.
A community board is structurally read-heavy, write-light. In such services, it is much more natural to write to one place reliably and let a separate path absorb reads. Service code already separated read-only and regular transactions, so splitting reads vs writes automatically along that boundary fit the current scale better than introducing a separate proxy.
For consistency, I picked eventual consistency suited to the service’s character over strong sync. There is a brief window after a post update where a stale value can be visible, but for a community board this delay does not significantly hurt UX. Real replication lag stayed at 0-1s.
3-3. App scale-out — actually distributing the CPU bottleneck
Even after single-server limits, read/write split, query optimization, caching, and autocomplete-quality work, app CPU was still the bottleneck. At 100 VU, app CPU pushed to ~100%, P95 to 2,300ms, error rate to 13.25%. MySQL had high BP hit rate and few slow queries, Redis had headroom. The problem was that read requests concentrated on a single app instance, piling search/lookup CPU into one place.
The point was not just “spin up another server” but how to distribute CPU-heavy reads across instances. Some requests like search need heavy ranking; others terminate fast on cache; so least-active-connection routing fit better than plain round-robin. Spreading writes across both instances would also complicate search-index synchronization, so reads were split across both apps and writes were pinned to one.
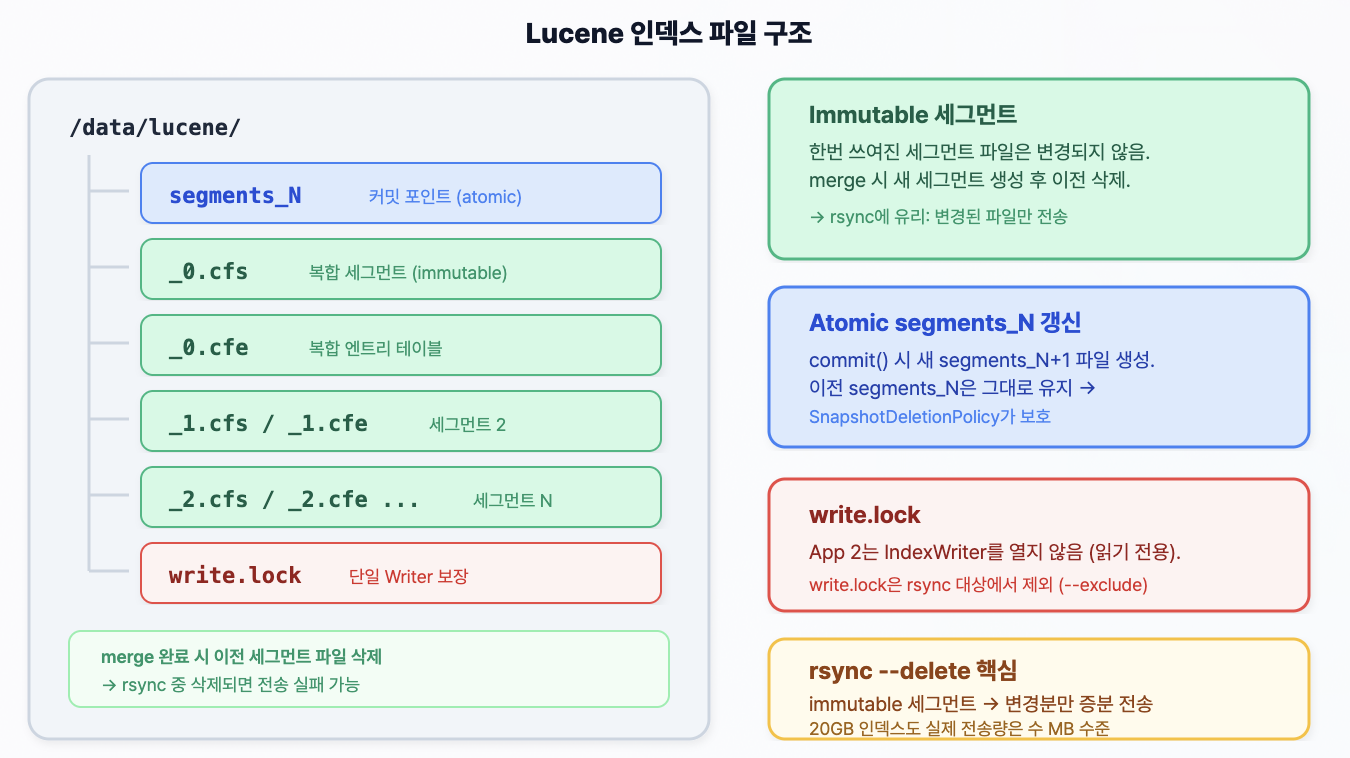
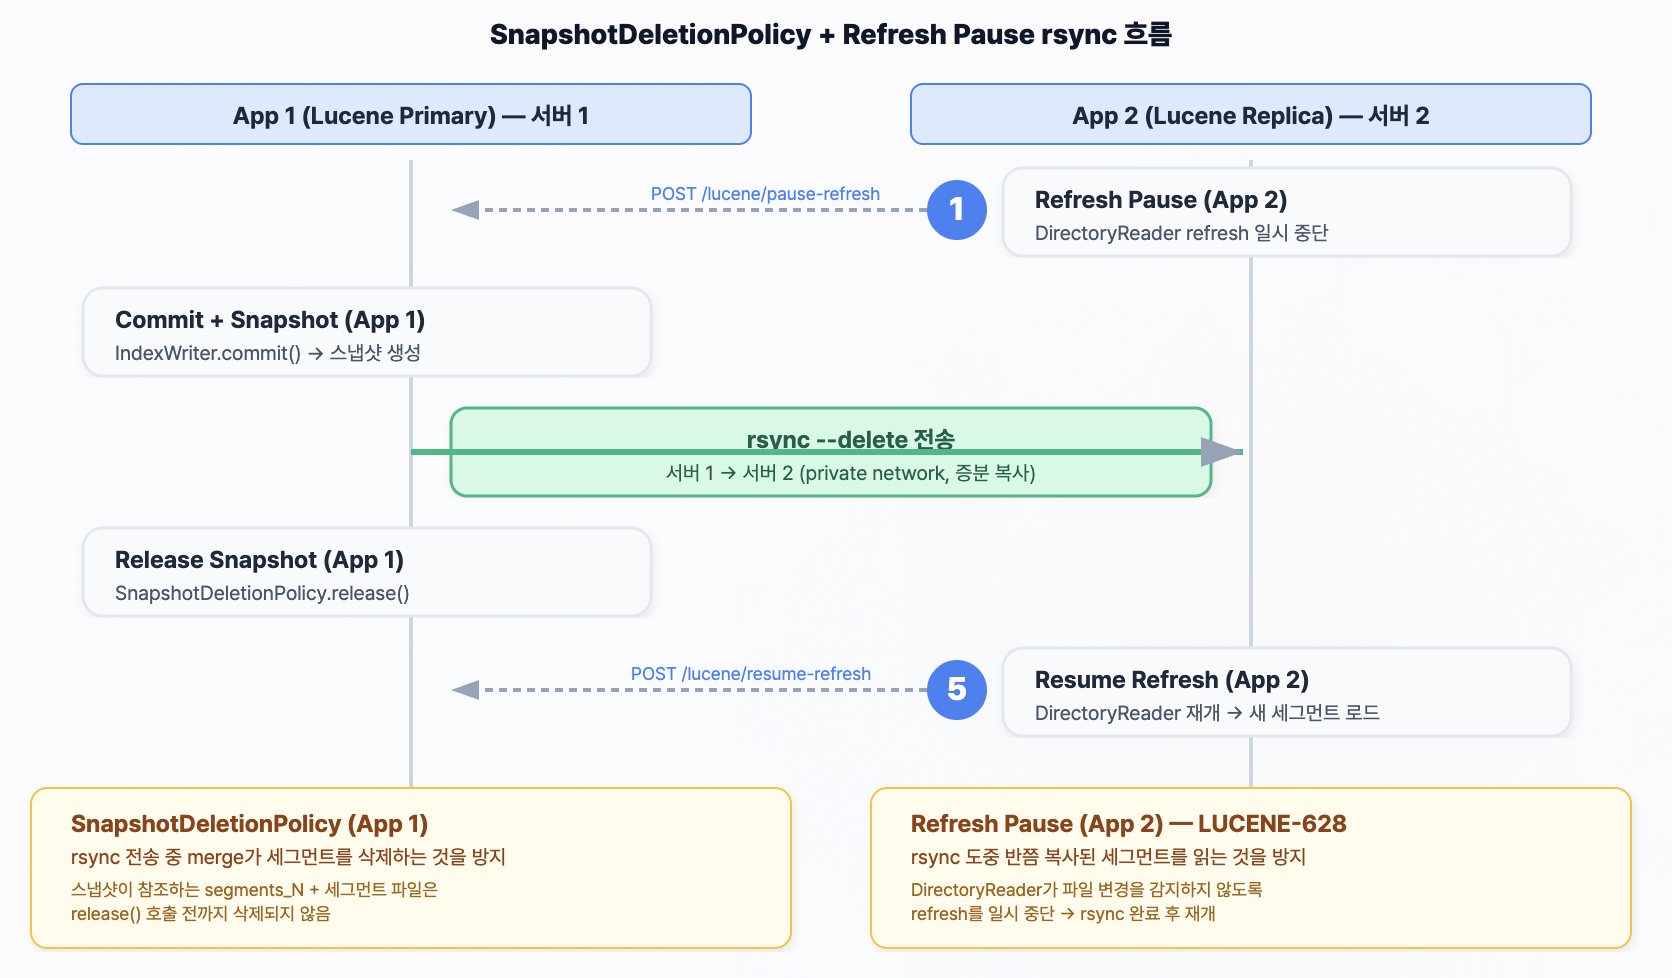
Another practical issue was Lucene index synchronization. DB sync is replication, but Lucene indexes are file-based, so doubling apps meant deciding how to keep the two instances’ search results consistent. Instead of attaching a heavier search cluster, I picked a Primary/Replica pattern where one side updates the index and the other follows.
The result: read load distributed across apps, average response 482ms → 40.93ms, P95 2,300ms → 175ms. But this exposed another previously-hidden structural issue. The detail GET request internally did a DB UPDATE to bump view count, which conflicted with the read-only path and caused 11.10% error rate.
3-4. View-count path redesign — removing writes from inside reads
After scaling apps to two, the assumption “reads go to the read path” broke down because the GET path internally fired a DB UPDATE to bump views. Single-server hid it; read/write split made it instantly conflict. Reads coming in via the read-only path tried to write internally and errored — 500s concentrated on the detail-view scenario.
So I moved view-count increment out of the read path. At request time, atomically increment a shared counter; reflect to DB later in short batches. DB writes from GETs were eliminated and error rate dropped 11.10% → 0.00%. Average response also improved 40.93ms → 37.23ms, P95 175ms → 158ms.
3-5. Change-propagation redesign — removing dual-write to secure correctness
As the distributed structure settled, the next visible problem was that data persistence and search-index updates were being handled together inside service code. Saving a post then immediately updating the search index and invalidating relevant caches is easy to read at first, but as write latency grows and partial failures appear (one side succeeds, the other does not), data integrity wobbles.
So here too, instead of jumping to the heaviest infra, I started with the lighter option to see what gets resolved and what remains. First switched to in-app async events to decouple service code, separating search indexing and cache invalidation from the user response path. That alone took post creation 5,315ms → 33ms and made the user response much lighter.
But operationally the limits were clear. DB changes that did not go through the app could not be picked up; in a multi-instance environment, following or replaying a common change history was hard. When indexing failed, the DB had the row but the search index did not — and the structure at the time did not have a baseline to recover from.
So finally I moved to a structure where DB changes themselves are the source of truth and the search index and cache consume them independently. The reason I picked Kafka and CDC was not throughput but correctness and replayability. Async makes the response light now; a replayable log defines how far back you can go to recover when something breaks. In the final structure, write average stayed at 24ms, but more importantly, dual-write was lifted out of service code and a baseline to re-read change history was established.
3-6. Redis workload separation — interference removal and blast-radius reduction over performance
The last problem was not that I was using Redis but that very different workloads were running inside one Redis instance: autocomplete suggestions (periodic bulk refreshes), general cache (TTL-driven), view counters (high-frequency short-cycle increments), and the token blacklist (security-critical, must not be lost).
Interference was actually observed. While processing the view-count batch, a command that swept all keys in one go produced tens of ms of internal blocking, during which real-time GETs and INCRs also waited. During autocomplete bulk re-writes, otherwise-fast general lookups showed abnormal spikes. So I first removed the full-scan anti-pattern, then split data by character — autocomplete / general cache / blacklist.
What mattered more than raw latency was how widely a problem in one type can spread to other features. General cache and autocomplete data can be partially lost and rebuilt, but the token blacklist must not be mishandled for security. So this stage was less about making Redis faster and more about separating things inside Redis that need to be different. The 34.6ms SLOWLOG blocking at flush time disappeared, and batch jobs and real-time requests stopped pulling each other down.
3-7. Validation — does the distributed structure actually hold?
After the distributed transition (2 App + MySQL Replication + Redis 3-shard + Kafka CDC), I re-ran a 200 VU stress test. Error rate 13.25% → 0.09%, throughput 30 req/s → 109 req/s, P95 2,300ms → 190ms. At 100 VU, P95 stabilized around 200ms, meeting the 300ms SLA.
Observability metrics: MySQL (InnoDB BP hit rate 100%, Row Lock 0), Redis (OPS normal), Kafka (Consumer Lag 0-3K converging to 0, CDC Lag peak 40ms), Nginx (Active Connection 200+) all had headroom; only app CPU stayed at 80-100%, confirming by elimination that it was the root bottleneck. The distributed structure adequately separated DB / cache / change-propagation bottlenecks; the remaining task was how to further reduce app CPU.
Related: Stress test tuning, Redis L2 cache, MySQL Replication, App scale-out, View count Redis INCR, CDC — event-driven sync, Redis sharding, Distributed stability
4. Search Quality — Toward Finding the Right Things
4-1. Synonym expansion + typo correction + snippet improvement
Target: the GET /posts/search?q= API. Lucene BM25 over 12.15M docs with title/body weights was already in place. Response time was already fine, but in real use, three quality limits remained:
(1) The engine did not understand synonyms — AI, 인공지능, DB, 데이터베이스 look the same to humans but are different terms in the index. (2) It was vulnerable to typos — common typos like 프로그래링 led to no results or unrelated ones. (3) Snippet quality was poor — slicing the first 150 chars failed when the query appeared after the middle, so the snippet could not explain why the doc surfaced.
For synonyms, compared four options. Index-time synonyms were rejected for IDF distortion and reindex cost. File-based SynonymGraphFilter is natural long-term but the lack of immediate operational reflection was a burden. Vector embedding-based semantic expansion was overkill — adding embedding models and a vector store for the level of AI ↔ 인공지능 is more complexity than the requirement justified. So this stage picked DB-based query-time synonym expansion first.
For typo correction, compared DirectSpellChecker, log-based “Did you mean?”, and SymSpell. Log-based is accurate but logs were sparse early on. SymSpell is fast but needs a separate dictionary. DirectSpellChecker uses the index as the dictionary, so it attaches with no extra infra. Snippet improvement compared full-content storage vs partial 500-char storage; a compromise that stores enough to show context around the query but avoids full storage was picked.
Result: searching AI now surfaces docs about 인공지능; typos like 프로그래링 get suggestions like “Did you mean 프로그래밍?”; snippets show context around the query rather than the lead. Along the way, applied 158,539 entries of Nori user dictionary to preserve compounds, and built zero-downtime reindex infrastructure for 12,156,589 docs since field/analyzer changes required it. Index size was about 42GB, reindex time about 2 hours.
4-2. LTR Reranking — XGBoost LambdaMART
The issue here was that “which docs to surface first” still depended on a hand-tuned linear weighting. Searching 자바, users mostly want 자바(programming language), but in actual results 자바 더 헛(Star Wars) rose higher and the programming-language doc was pushed to #4. With a dataset where popularity features barely discriminate, linear boosting inevitably leans on text-matching scores.
Compared LTR models. Linear Model is the same kind of linear combination as manual boosting — same features barely make a difference. LambdaMART, on the other hand, is tree-based and learns feature interactions: e.g., when titleLength, tagOverlap, bm25Title work together, certain types of docs are pushed up — non-linear relationships. So LambdaMART fit the current problem better.
The problem was training data. Almost no traffic, so click logs were too few. In cold start, instead of human-labeled relevance, used LLM-as-a-Judge. Combined 45 queries with each query’s BM25 top-20 to make 900 (query, doc) pairs and assigned 4-level relevance scores. Reduced non-determinism with averaging-and-rounding over 3 calls.
This did not work the first try. In the first run, most of the 900 failed; success rate was 2%. Causes: inter-round delay was too short and per-minute requests crossed the limit; Spring AI’s default retry did not treat HTTP 429 as retryable; data was kept in memory only, so mass failures were not detected fast. After fixing inter-round interval, exponential backoff, immediate CSV writes, and a resumable structure, re-collected.
Final: extracted 14 features and reranked the BM25 top-200 in a 2nd phase. Quality improved clearly. BM25 baseline NDCG@10 0.6910, LambdaMART 5-Fold CV NDCG@10 0.7387 (+4.8%p). For 자바, 자바 더 헛 was no longer #1 — 자바 (programming language) was.
But the operational test went the other way. With LTR on under 100 VU on 2-core ARM, overall avg jumped 42.81ms → 3,088ms and search 29.18ms → 8,826ms. P95 spiked to tens of seconds, and even unrelated autocomplete slowed down. So in production, LTR_ENABLED=false to disable it; the takeaway was framed not as “production-applied” but as “directly measured and judged the boundary between quality and operational cost.”
4-3. Auto category classification + native Facet switch
Facet filtering was possible, but Facet was almost meaningless as an exploration feature. The original categories assigned at wiki import were namespace-based and concentrated ~97% of docs into “general doc.” Facet aggregation was also computed outside the search engine via DB GROUP BY, so the path filtering search results and the path computing distributions were different.
So first, redefined the category values themselves. Reclassified into 28 topical categories (CS, Math, Physics, History, Music, Game, Sports, …) automatically; ~83% accuracy on 90-sample manual verification. Some misclassification on edges, but given that the goal is a navigation axis to help users narrow down, not a precise classifier, it was practical enough.
Next, brought both the category filter and Facet aggregation inside Lucene. Stored category values in the search index and computed Facet on the same reader as search, so filtering and aggregation work on the same baseline. Considered tags too, but at 2.16M unique tags, Faceting becomes a high-cardinality cost-and-UI-complexity problem with little user value. So tags are indexed only for matching quality; Facet is kept on the more stable, human-interpretable category axis.
4-4. Content filtering — operational safety
Target: the POST /api/v1.0/posts API and the search/autocomplete paths the result is exposed through. There was no harmful-content check on title/body, so any string could be saved. The problem was not just “bad text gets stored” — once stored, it bleeds into search results and autocomplete suggestions, polluting the entire system’s quality and operational stability.
The simplest method is String.contains() over a banned-word list. But as the list grows to tens of thousands, you traverse the entire body that many times — cost grows linearly with word count. This stage needed a structure that detects many patterns in a single pass over the text, which is Aho-Corasick: bundle patterns into a Trie + failure links and inspect the input once.
Exposure control was designed separately. Deleting blinded posts from the index would require re-indexing on restoration. Instead, gave posts a blinded state and excluded them from search at query time but allowed instant restoration. Empty-result responses right after app boot, before the index is ready, are cached only with a short TTL — preventing cache penetration without keeping the wrong state long.
4-5. AI search summary — RAG pipeline
Target: AI summary on the search results page. The engine could find related docs via Lucene BM25 and show titles/snippets, but users still had to click through several posts to get the answer. The earlier AI summary did not feed retrieved docs as context — it sent only the query to the LLM, so answers could disagree with results and could not cite sources.
To fix this, built a RAG pipeline that pipes search results directly into LLM context. Five steps: reuse the existing typo-correction and synonym expansion to clean the query, retrieve top docs via Lucene BM25, slice context from the top-5, have the LLM generate the answer, then SSE-stream the answer so search results appear immediately and the AI summary trickles in asynchronously.
Retrieval kept BM25 instead of dense retrieval. The current usage skews to keyword search around technical terms and concepts, and meaning expansion at the level of AI → 인공지능 is already covered by synonym expansion, so introducing embeddings + a vector store felt heavier than the requirement.
For ops, watched cost and stability. Attaching AI summary to every search would just inflate cost with low return, so pure navigational/transactional queries skip AI summary. Same query is cached for some time, with a global call limit to avoid bursts. Hallucination prevention is structural: the system prompt restricts the model to provided docs only, and answers must include inline [doc N] citations.
Result: users see search results first while the AI summary block delivers the gist immediately. SSE keeps the wait painless, and inline citations show which docs the summary used.
Related: Category search filtering, Query expansion + Query Understanding, LTR reranking + auto category classification, Content filtering, AI search summary — RAG
5. Failures and Lessons
1. LTR ON degraded perf 72×
Cause: extracting 14 features per doc inside rescore window 200 is too expensive on 2-core ARM. BM25 across 3 fields × 200 docs of scorer creation overlapped with Nori tokenization, fully saturating CPU and dragging unrelated APIs down with it.
Lesson: feature validation and production rollout are different. A better quality metric alone does not justify pushing it onto the live path; you have to measure whether current infra can pay for the extra cost.
2. LLM training-data generation 98% failure
Cause: miscalculated external-API rate limits; Spring AI’s default retry did not treat HTTP 429 as retryable; results held in memory only, so mass failures were not detected fast.
Lesson: pipelines that depend on external APIs must be observable about failure before they are functional. Treat call quotas like a budget, persist results to disk immediately, and design the pipeline to be resumable.
3. Search not reflected after CDC deploy
In a multi-instance environment, the CDC consumer’s location and Lucene IndexWriter’s location drifted. App 2 received the CDC event but App 2 was the Lucene replica, so indexing was skipped; App 1’s Kafka env-var mapping was missing, so the connection itself failed.
Lesson: in distributed systems, “every component is healthy” is not enough. Where events are read, where the index is written, and how config flows through the actual deploy path — all need end-to-end verification.
4. Flyway migration not propagated to Replica
MySQL Replication broke and DDL did not propagate to Replica; the difference between ddl-auto: validate and update masked it locally. The ai_summary_feedback table and the blinded column were missing on Replica, so read queries failed.
Lesson: “deploy complete” is not “migration succeeded” — it is “Primary and Replica reached the same schema state.” A checklist that verifies replication state and Flyway application together is required in production.
5. snippetSource stored raw wiki markup
Storing raw wiki markup ([include(template:XXX)], {{biology classification}}) in a stored field made UnifiedHighlighter fail to align offsets and return empty snippets.
Lesson: in search systems, stored source and the form suitable for search/highlight may differ. Putting raw data into a stored field is an anti-pattern; separate source_text (raw) from clean text and store a sanitized field at index time.
Final Architecture + Key Numbers
Search performance
| Item | Before | After | Conditions |
|---|---|---|---|
| Body search | LIKE timeout (5,000ms+) | Lucene BM25 29ms (P95 100ms) | EXPLAIN rows=27,443,742 |
| B-Tree autocomplete | LIKE timeout (5,000ms+) | 8ms | composite index idx_title_viewcount |
| FULLTEXT ngram | 12,766ms | 8ms | 570K docs, 6.7GB index |
| Redis autocomplete | Trie DFS 5ms | Redis GET 11ms (P95 68ms) | flat KV O(1), ~5,000 prefix keys |
| Overall response | 776ms | 54ms (14.4×) | Caffeine introduced |
| L1+L2 hit rate | 0% | 82% (L1 73% + L2 9%) | 19% reach origin |
| Redis memory | - | 73MB / 256MB (28.4%) | Eviction 0, Lettuce P95 2.5ms |
Distributed architecture
| Item | Single server | Distributed (2 App) | Change |
|---|---|---|---|
| Error rate (query) | 32.53% (COUNT(*) timeout) | 0% | Page → Slice |
| Error rate (load 100 VU) | 13.25% | 0% | App scale-out |
| Error rate (load 200 VU) | - | 0.09% | MySQL/Redis/Kafka all spare |
| Avg response (100 VU) | 482ms | 37ms | -92% |
| P95 (100 VU) | 2,300ms | 190ms | 12× |
| Throughput | ~30 req/s | 109 req/s | 3.6× |
| Detail-view error | 11.10% (DB UPDATE conflict) | 0% (Redis INCR) | Write-Behind 30s batch |
| Post creation | 5,315ms (dual-write) | 33ms | CDC, 160× |
| KEYS blocking | 34.6ms SLOWLOG | resolved | SCAN switch + 3-node isolation |
| Replication | - | Primary 50ops/s, Replica 200ops/s, Lag 0-1s | GTID async |
Search quality
| Item | Before | After | Method |
|---|---|---|---|
| P@10 | 0.827 | 0.853 | PhraseQuery(slop=2) + FeatureField |
| NDCG@10 | 0.6910 | 0.7387 (+4.8%p) | XGBoost LambdaMART, 14 features |
| AI search | only English Ai doc | 인공지능 #1 | DB synonym query-time expansion |
| Typo correction | 0/irrelevant | suggests 프로그래밍 | DirectSpellChecker |
| Snippet | first 150 chars (irrelevant) | context around query | UnifiedHighlighter + 500-char StoredField |
| Facet | none | full aggregation across 30 categories | SortedSetDocValuesFacetCounts |
| Category classification | namespace 97% skewed | 28 topical (83% accuracy) | keyword-based batch classification |
| Banned words | none | 16,090 detected | Aho-Corasick O(N+Z) |
| AI summary | none | RAG + SSE + source links | Gemini 15 RPM, cache 30-min TTL |
| Search final (Facet+tags) | - | 548ms (P95 2.61s) | index 42GB, Nori dict 158K |
| LTR ON limit | - | 3,088ms (72× worse) | 2-core ARM CPU saturated → OFF |
Infra scale
- Lucene index: 42GB (5 segments)
- Zero-downtime reindex: ~2 hours
- Nori user dictionary: 158,539 entries
- Banned words: 16,090
- Redis: 3 nodes (~4,620 keys)
- HikariCP: Primary 5 + Replica 15
- Kafka: KRaft single broker + DLQ
The Redis hit rate landing in the 80s is partly because k6 deliberately included cache-miss-inducing scenarios. 46 keywords × pages × categories combinations were mixed in with rare tokens and random detail lookups, so the conditions were more conservative than a Zipfian production distribution. With real traffic skewing more to popular keywords and page=0, the hit rate would likely be higher.
Wrap-up
The final structure in one line: defer heavy computation, keep the user request path as short and simple as possible. Search separated the fast-read path from the cleanup-behind path; state was externalized as much as needed; change propagation was placed on a more consistent baseline than direct in-service calls.
Looking back, the biggest lesson was that good architecture is not handed down as the answer from day one. Observing bottlenecks, hitting failures, redefining what the largest current constraint is, and changing the structure step by step — the process itself is engineering. So WikiEngine is less “a project that built a search engine” and more “a project that practiced judging what to solve first inside constraints.”

댓글
댓글 수정/삭제는 GitHub Discussions에서 가능합니다.